BTC Breakdown – Reaccumulation at RiskBitcoin just posted a decisive 4H candle close below 55 SMA, mid-Bollinger Band, and the primary ascending trendline. Volume spiked to 7.31M, and RSI dropped to 38, confirming bearish momentum.
⸻
🧩 Wyckoff Structure Under Threat:
• ❌ LPS level invalidated
• ❌ Phase D uptrend broken
• 📉 No breakout above ATH (~109.8K) after three attempts
• 🟠 Still holding BC (Pole End) at ~105.8K
• 🔁 If this breaks next, the entire Phase D/E thesis collapses
⸻
🔻 What’s Next?
• Support:
• S1: Lower BB (~106.9K)
• S2: 105.8K (BC level — key structural base)
• Break of 105.8K = invalidation of reaccumulation, transition into potential distribution. Watch for daily close for confirmation.
• S3: Point of control at 104k
⸻
📊 Breakdown Triggers Confirmed:
• ✅ Close below mid-BB (108.9K)
• ✅ RSI < 45
• ✅ High-volume red candle
• ✅ Structural break of ascending LPS pattern
A short hedge can be initiated with a tight stop over breaking candle high. Note that this could be the shakeout moment i mentioned in my related post.
⸻
Unless BTC recovers 108.5K+ with rising volume quickly, this is now a valid short breakdown, and reaccumulation thesis hangs by a thread.
#Bitcoin #BTCUSDT #Wyckoff #Breakdown #CryptoTA #BTC4H #PriceAction #TechnicalAnalysis
Reaccumulation

Bitcoin 4H Outlook: Dual Wyckoff Reaccumulation in Play⚙️ Technical Thesis:
We're currently witnessing the unfolding of two back-to-back Wyckoff reaccumulation structures on the 4H timeframe:
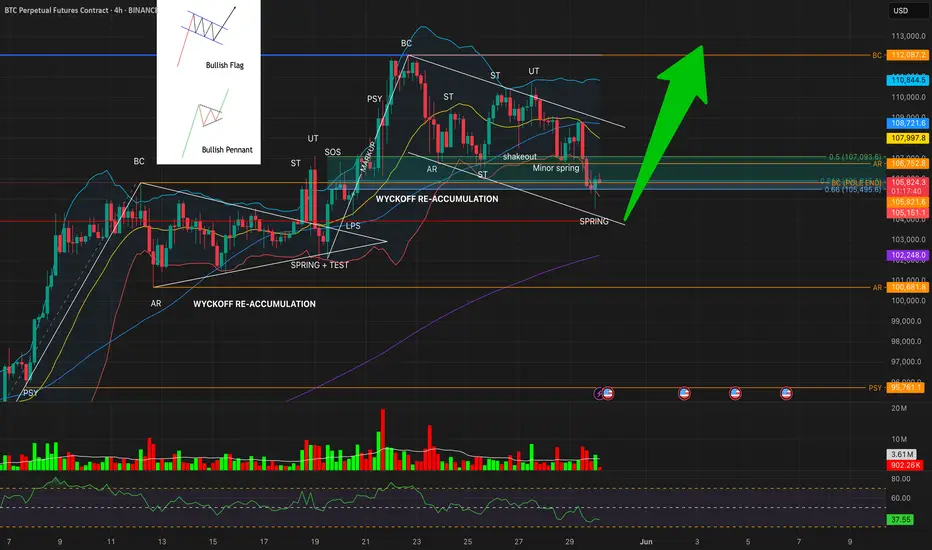
📦 Reaccumulation #1 (Left)
Structure: PSY → BC → AR → ST → Spring + Test → LPS → SOS
Bullish pennant formed after Spring, leading to a strong breakout
BC of this phase (105,821) now acts as a major upper resistance
📦 Reaccumulation #2 (Right)
Structure: BC → ST → UT → Shakeout → Minor Spring → SPRING (current)
Current price has tagged Spring at the convergence of:
Lower Bollinger Band ($105,174)
61.8% Fibonacci retracement ($105,915)
🧪 Market Internals
RSI: 38.31 → deeply oversold, aligned with a Spring phase
Volume: Fading on last leg down, hinting exhaustion
BBs:
Upper: $110,828
Basis: $108,006 (confluent with 55 SMA)
Lower: $105,174
200 SMA: $102,248 (macro support)
Pattern context: Another bullish flag is forming within the second structure
🎯 Trade Expectations (Pending Spring Test as Confirmation)
If this Spring holds:
🔄 LPS → Look for bullish reaction with increased volume
TP1: AR retest around $106,752
TP2: 55 SMA + BB Midline confluence at ~$108,000
TP3: Range target or previous BC level near $112,000–$113,000
A decisive break below $105,000 with RSI < 35 and rising volume would invalidate the Spring and shift focus to breakdown risk.
🔍 Wyckoff View
This is a classic Spring setup from a Wyckoff reaccumulation structure. Two sequential structures are visible, and the first structure’s BC now serves as the foundational support for the second. This kind of layered support builds conviction — but needs validation via LPS and SOS phases.
Yes the major trendline was broken, but we are now consolidation and reaccumulation for the next leg up, unless the pattern is invalidated.
🕹 No short setups active unless structural failure confirmed.
💬 Share your view: do you see this as a Spring or potential failure?
#BTCUSDT #Wyckoff #Reaccumulation #CryptoTrading #BitcoinAnalysis #TechnicalAnalysis #Spring #LPS
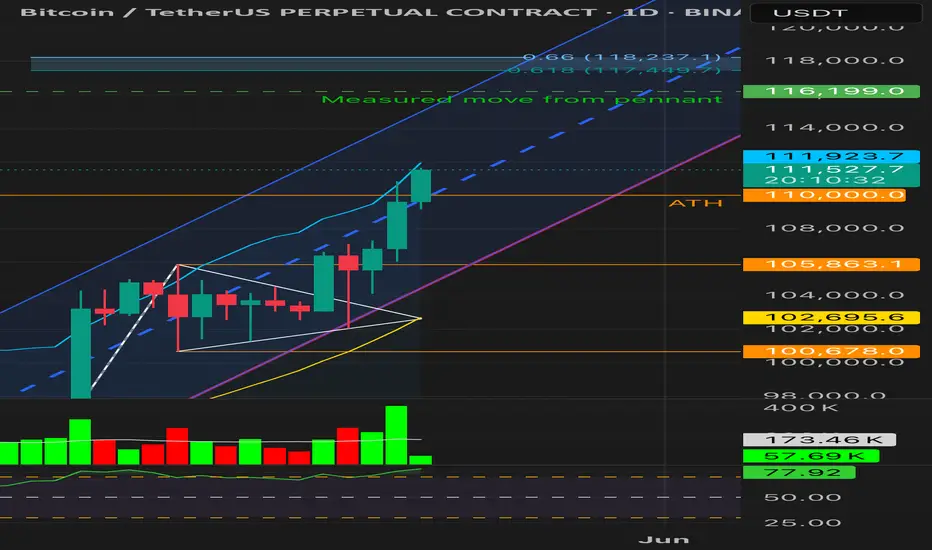
BTCUSDT 4H – Reaccumulation Apex Compression | Decision Time📌 Price is now being squeezed between major trendline support and ATH resistance (~110K) — forming an apex structure, typical of Wyckoff Phase D → Phase E transitions.
🧠 Wyckoff Structure So Far:
Phase A/B/C: BC → ST → UT → Spring → LPS
Phase D: Multiple SOS rallies followed by a BU (backup to edge of creek)
Now: Testing the upper boundary of the range again — is this the launch point for Markup (Phase E)?
🔼 Bullish Breakout Conditions:
✅ 4H close above 110,625
✅ Rising volume above 27.4K MA
✅ RSI > 60
🟢 Targets:
TP1: 116,199 (measured move from pennant)
TP2: 117,449–118,237 (Fib confluence zone)
TP3: Trailing TP with 1.0% callback
🔽 Bearish Breakdown Risk:
❌ Close below 107,867 with RSI < 45 + rising volume
Would signal failure of the BU and reversion toward:
BC: 105,863
AR: 100,678
📊 Indicators:
RSI: 55.77 (neutral/bullish)
Volume: Still below average — shows compression
55 SMA: 107,762.7
BB Midline: 108,653.9
⚖️ No hedge short entry valid yet
Let the apex resolve — patience until confirmation.
#Bitcoin #BTCUSDT #Wyckoff #CryptoTrading #TechnicalAnalysis #BTC

BTCUSDT – Reaccumulation Breakout or Bearish S/R Flip?Timeframes: 1W • 1D • 4H
Structure: Wyckoff Reaccumulation nearing Phase E — but ATH is acting as resistance
🔹 WEEKLY OUTLOOK: Macro Structure Points to Markup
Last weekly candle closed above the reaccumulation Buying Climax (BC), showing bullish intent
Weekly upper Bollinger Band is rising toward 113k
RSI at 67, strong but not overbought
Structure suggests we’re entering Wyckoff Phase E
Weekly Targets:
🟢 TP1: 113,049 (Upper BB)
🟢 TP2: 116,199 (measured move)
🟢 TP3: 118,237 (Fib 0.66 extension)
🔹 DAILY OUTLOOK: Still Holding Above Reaccumulation Range
Multiple daily closes above the BU (backup) zone, but all below 110k ATH
RSI is strong (~66), and price is tracking near the upper BB, but volume is not convincing
Until a daily close above 110,000, breakout remains unconfirmed
🔹 4H OUTLOOK: Structure Valid, Momentum Rising
BU zone held; price made two lower lows followed by a higher high
RSI has reclaimed 57+, and volume is picking up modestly
4H structure looks like an early Phase E breakout attempt, but...
⚠️ Caution: Is This a Bearish S/R Flip?
While the broader Wyckoff structure suggests a transition into markup, we must also consider the bearish scenario:
BTC may be failing a support/resistance flip at 110k
All timeframes have rejected at or below 110k, despite multiple attempts
If we see a lower high under 109k + 1D close below 105,863 with red volume and RSI < 45 → this becomes a confirmed bull trap
📊 TL;DR:
BTC is structurally bullish — but we are at the final test zone.
🔓 Breakout confirmed: Daily close above 110k
🔒 Failure confirmed: Close below 105,863 + red volume + RSI breakdown
Stay nimble. This is either the last shakeout before markup… or the top of the range before reversal.
#Bitcoin #BTCUSDT #Wyckoff #CryptoTrading #TechnicalAnalysis #Reaccumulation #Breakout #SupportResistance
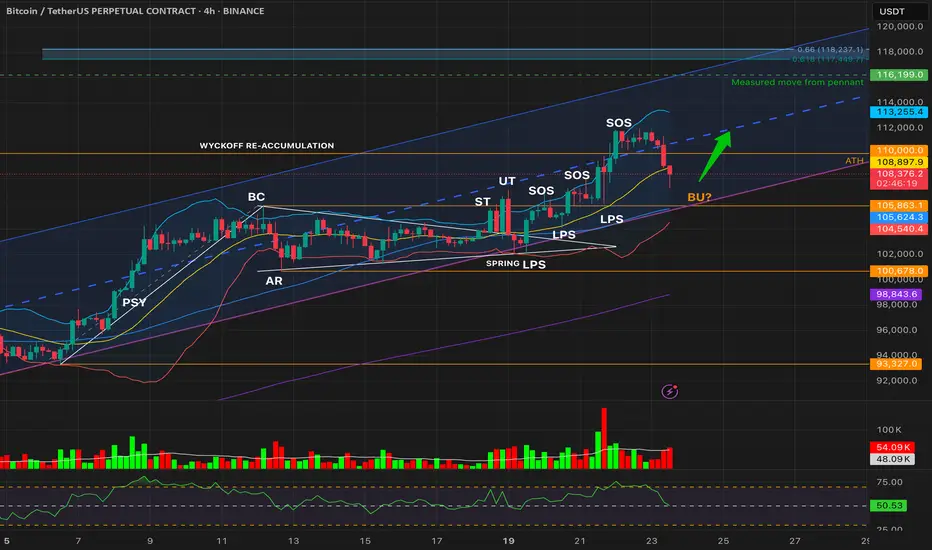
BTCUSDT 4H — Re-Accumulation in Play or Breakdown Brewing?Bitcoin is currently testing a critical confluence zone just below the prior ATH breakout (110k). After a clear Sign of Strength (SOS) breakout, price has retraced to retest the:
🔸 Mid Bollinger Band (108.9k)
🔸 Previous ATH breakout zone
🔸 Local channel support & uptrend line
RSI is neutral at 50.76 and volume remains slightly elevated — suggesting a potential BU/LPS retest phase in this Wyckoff re-accumulation.
📉 Breakdown Risk?
So far, no breakdown triggers confirmed per our risk model:
⛔ Price > lower BB (104.5k)
⛔ RSI > 45, not in weak momentum
⛔ No pattern breakdown with RSI < 40
That means no short hedge activated yet — but caution is warranted. A close below 104.5k with weak RSI & volume spike would invalidate the bullish structure.
🎯 Upside Targets if BU Holds:
Resistance: 113.2k (Upper BB)
Measured move from the pennant: 116.2k
Further confluence at 118.2k (Fib 0.66 extension)
🧠 Weekend Watchlist:
Do not trade based on 4H chart to avoid fakeouts and traps. Use it as early signal and confirm with daily close!
🔹 Hold above mid-BB keeps re-accumulation valid
🔹 Breakdown below lower-BB = structural failure
🔹 Volatility likely to spike — stay risk-managed
📚 Still within Wyckoff markup logic unless proven otherwise.
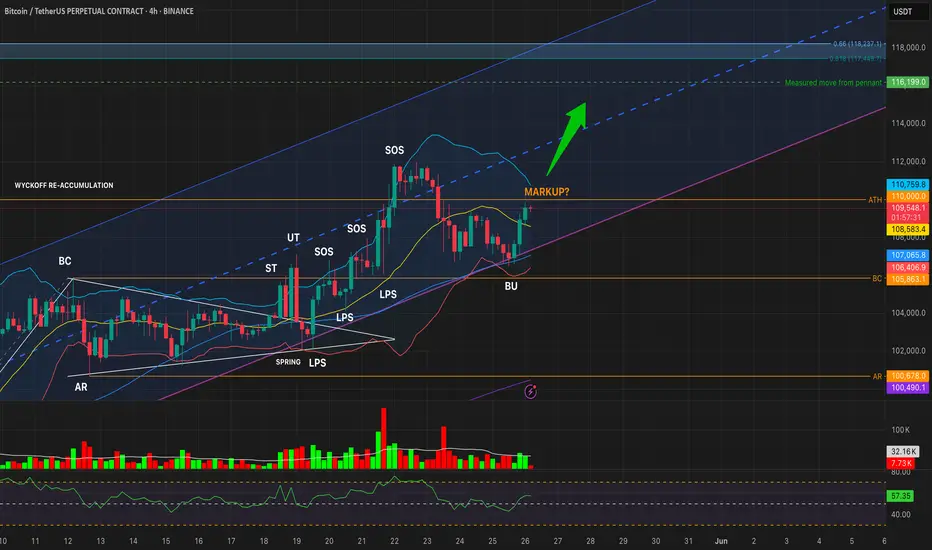
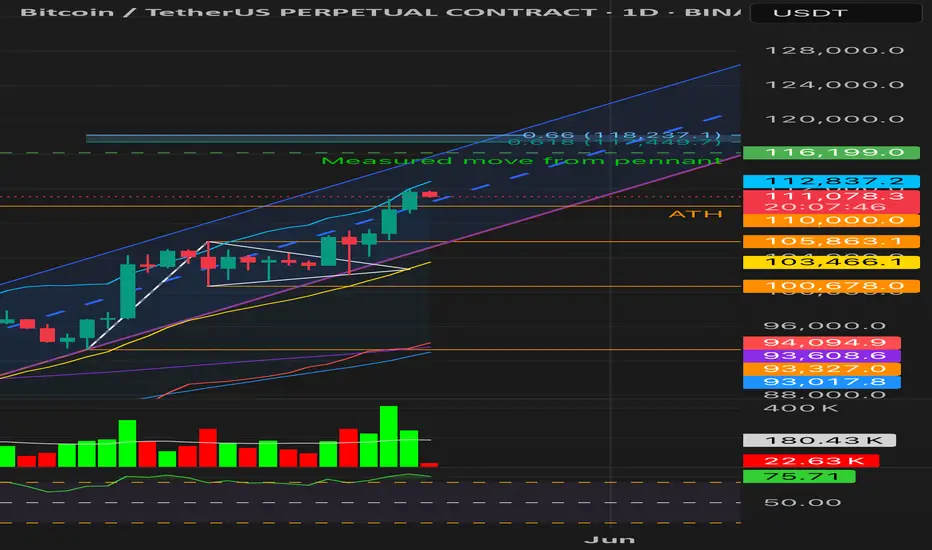
BTC Re-Accumulation Breakout | Daily Close Confirmed | Phase DBitcoin just confirmed its first daily close above the pennant breakout, reclaiming the previous ATH (~110K) with conviction.
We now have both structural breakout confirmation on the 1D chart and clear Wyckoff Phase D progression on the 4H.
⸻
1D Chart Highlights:
• Daily Close: 110,993
• Breakout from bullish pennant
• Volume expanding into the breakout
• RSI: 75.38 → strong momentum, not overbought exhaustion
• TP Ladder:
• TP1: 112.8K (Upper BB)
• TP2: 116.2K (Fib 0.618)
• TP3: 118.2K (Fib 0.66 + trailing)
⸻
4H Chart Highlights (Wyckoff Re-Accumulation):
• SPRING → TEST → LPS → SOS
• Structure has shifted into Phase D
• Currently forming a BU→ATH zone retest (textbook Back-Up)
• Volume declining, showing lack of supply
• RSI: 67.60 (bullish territory)
⸻
No Short Hedge Triggered
⸻
Summary:
This is a low-risk consolidation above previous ATH, backed by strong momentum and classic Wyckoff mechanics.
As long as BTC holds above ~110K and volume remains controlled, bullish continuation toward 116–118K remains the base case.
⸻
#Bitcoin #BTCUSDT #Wyckoff #Crypto #Reaccumulation #Breakout #TradingView #TechnicalAnalysis #PhaseD
BTC | Testing ATH — Breakout or Trap?Daily close just under ATH at 109,609
We had only 1H confirmation above ATH, with the first 4H close above ATH likely in 30 minutes. The breakout volume is well above average (Volume MA: 172.89k), but daily candle still below resistance.
This could be:
• A Sign of Strength (SOS) transitioning into Phase E markup,
• Or a premature breakout without higher timeframe validation.
⸻
Breakout Validation Checklist:
1. 1H Close Above ATH (~110k) ✅
▸ Initial signal confirmed, but not sufficient alone.
2. 4H Close Above ATH (Pending ~30 mins)
▸ Must close above 110k, with no strong upper wick.
▸ Confirms intermediate-term strength.
3. Daily Close ≥ 110k
▸ Still missing. Required for macro breakout confirmation.
▸ Watch for candle body, not just wick.
4. Throwback & Support Hold at 109.6–110k
▸ Ideally after 4H confirmation, a retest and bounce = textbook
SOS → BU → Markup pattern.
5. Invalidation Risks:
▸ Daily close <109k with high volume
▸ RSI divergence on 4H
▸ Rejection from 114k–116k Fib cluster
▸ Large bearish engulfing below ATH
⸻
Wyckoff Context:
We’re likely in Re-Accumulation Phase D, testing the breakout.
No signs of UTAD or distribution — but low conviction breakouts at ATH are known trap zones.
⸻
What’s Next?
If 4H + Daily confirm, momentum may push toward:
• TP1: 114,449 (Fib 0.618)
• TP2: 116,199 (Measured move)
• TP3: 118,237 (Upper Fib extension)
⸻
Follow for real-time BTC setups based on structure, RSI, and volume — no hopium.
Like & share if this helps clarify the levels you’re watching.
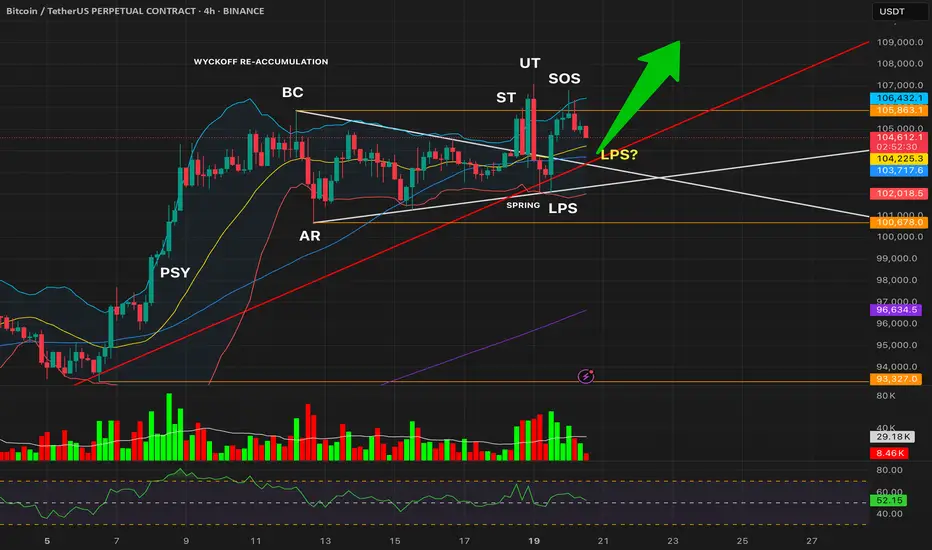
Wyckoff Re-Accumulation – LPS in Play (BTC 4H)
After weeks of sideways action, Bitcoin shows classic **Wyckoff Re-Accumulation** behavior:
### 🧱 Phase Breakdown:
🔹 **Phase A**
* **PSY**: Initial supply surge
* **BC**/**AR**: Range boundaries established
🔹 **Phase B**
* **ST**: Testing top of range
* **UT**: Upthrust above resistance, followed by rejection
🔹 **Phase C**
* **Spring**: Trap move below major trendline
* Cleared liquidity, shook out weak hands, rebounded fast
🔹 **Phase D**
* **LPS**: First higher low after spring
* **SOS**: Breakout from resistance on strength
* **LPS?**: Ongoing retest, holding higher low structure
---
📈 If current LPS holds, this confirms Phase D and opens the path to **Phase E (markup).**
💡 A valid Spring + LPS combo can be one of the highest R/R setups in Wyckoff methodology.
#Wyckoff #BTC #ReAccumulation #Spring #CryptoTrading
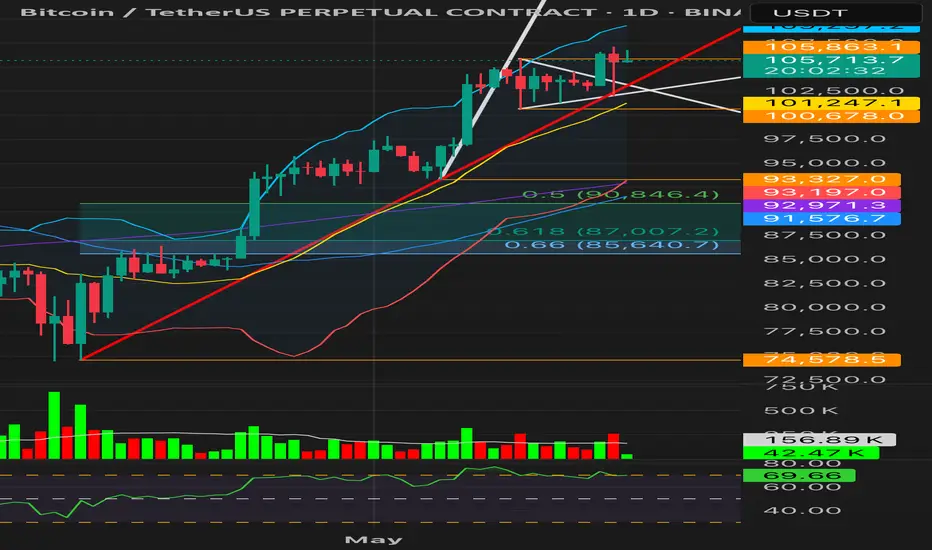
BTC – Distribution Denied. Reaccumulation Confirmed?
Timeframes: 1H (breakout retest) | 1D (macro continuation)
⸻
Updated Context
BTC invalidated the LPSY scenario on 1H:
• Price broke above the golden pocket (0.618–0.66)
• Also cleared the symmetrical triangle range high
• Now retesting the breakout with declining volume = classic reaccumulation behavior
The earlier 1H structure mimicked distribution, but failed to follow through. There was no markdown — instead, price reclaimed the range.
⸻
Daily Chart Support
• Second daily close above triangle apex
• RSI > 70 (currently ~70.3) → sustained bullish momentum
• Yesterday’s candle: long lower wick + above-average volume = demand stepping in
• Structure is building above $100K, which had been a major psychological barrier since Dec 2024
⸻
$100K – The New Base
BTC has tested and reclaimed $100K multiple times (Dec, Jan, May).
Now it’s acting as a macro accumulation floor, not resistance.
The longer price holds above this zone, the higher the probability of explosive continuation.
⸻
Next Levels to Watch
• Support (retest): 105.3–105.8K
• Validation: Strong 1H or daily close above 107.1K
• Targets: Upper BB (109.3K), then psychological round number → 110K
⸻
Conclusion
The bearish 1H thesis is now invalid.
BTC is above the range, retesting it, with macro structure and momentum on its side.
This is how reaccumulations trap early shorts and fuel the next markup.
#BTC #Bitcoin #Crypto #Reaccumulation #Wyckoff #Breakout #100K #TriangleBreakout #BTCUSDT #PriceAction
FNV to new ATHFNV looks good for a break to new ATH. We had that nice long 3 year distribution like schematic, we broke down, got lots of people short, re-accumulated long stops at all those consolidation lows and have had multiple clear breaks to the upside. People interpreting the schematic as a distribution, are gonna be shorting every supply zone between here and ATH's. That coupled with the stops that have already built up above the highs will create the clouds of liquidity that will fuel these uptrends
Look at the fractal re-accumulation that occured once we started breaking back up to the topside.
Sure looks familiar

Bitcoin(BTC): Entering Reaccumulation Phase (DROP???)As we are over-expanding on Bitcoin, we also need to keep in mind that we have a really high chance of seeing the "reaccumulation" phase activate soon.
We are monitoring the charts and waiting for a bigger correction to happen before the next bullish market, so eyes open, everyone!!
Soon, we should see a really good buying opportunity.
Swallow Team

How I Rode the Gold Trend Using Multi-Timeframe AnalysisHey Traders! 📈
I want to share an analysis of a recent opportunity on Gold that came up, focusing on using multi-timeframe analysis to spot a reaccumulation pattern.
Market Context:
On the daily timeframe, Gold was showing a retracement. By zooming into the 1H timeframe, I identified what seemed like a reaccumulation (REACC) model—giving a potential entry point to go long in this trending market.
The Entry Setup:
On the 1H TF, after a retrace, the price continued the uptrend with strong structure, confirming a breakout.
I entered long, aligning with the market trend and using a trailing stop to manage the position and capture potential further upside.
Floating PnL:
Right now, the trade is floating around 12RR and still trailing! This is a great example of how multi-timeframe analysis can help uncover high-probability setups.
This educational breakdown is meant to help others see the power of combining market structure and risk management to stay in profitable trades. Hope this helps you spot similar setups in the future! 🚀
Leave a comment if you surfed with this trend too!

BTC HTF internal re-AccumulationBTC producing internal HTF re-Accumulation from last leg up.
Targets gonna be: ATH
In case of Model Fails = 48k. and waiting for future possible Accumulation

BTC re-AccumulationCurrent PA present itself as Model-2 re-Accumulation. Still could evolve into Model-1.
Overall targeting ATH. In case of decent closes above each mark levels.
Could turn into Distribution. Targeting 48k.
Range high would be a crucial point imo.

Ideal Bullish SetupQLYS has one of my favorite re-accumulation patterns that is setting up for a 40% rally over the next few months.
Breakout level = 172.49 (it should complete the breakout on 3/12 -3/13)
*Initial Target = 175 by 3/14/2024
** Target 1 = 184 by 3/22
Target 2 = 192
~Initial Target and Target 1 will hit on the first leg up following this breakout, Target 2 might not hit until the second leg up after a pullback to form higher low.
Expected path/forecast is the black arrow, summary:
- run to 184-192 by end of March 2024 (as early as 3/22), sign of strength
- Pullback to test 172-175 for support, backup/retest
- If that holds it will begin markup to 245 (this could take until August-November of 2024)
---------------------------------------------------------------------------------------------------------------
Options Play:
QLYS Apr 19 2024 185.00 calls for around 3.35
Not financial advice
-----------------------------------------------------------------------------------------------------------
QLYS trades similar to the rest of the cybersecurity names, so this will be a great supplement play to my main cyber longs PANW and CRWD. QLYS just has more affordable call premiums and can buy more time. Its setup is also more stable to support a more sustained run.

Post Earnings Continuation to 585This idea is an update to my original idea "Earnings Pop to 520" (see link).
NFLX needs to make a sustained break above 569 to initiate the next move higher to 585 (minimum target).
Once we get this break it will take the following path - expected path is the black arrow:
- Run to 585 (by 2/2/2024 earliest, 2/9/2024 latest)
- Pullback to test 577 for support
- Then at least one more leg higher to 600-620 ( point target = 610 by 2/16/2024)
The green funnel represents buying pressure that will drive this higher. The most important channel is the dashed deep purple/blue boundaries w/ solid blue center - this is the demand zone that it will respect during the markup.
-----------------------------------------------------------------------------------------------------------
Bigger picture:
If you go back to Jan. 2022, there is a gap down from 563.36 - 566.88. The earnings pop filled this gap and we are currently establishing support in that range.
Confluence at the 585 level as an initial target:
- 0.786 retracement of the ATH (700.99) back in Nov 2021 = 585.80
- larger degree activate markup level at 585, this will act as another bullish driver to send this higher to 610 after 585 is tested
- Equilibrium levels where supply = demand at (2/2/2024, 583) and (2/5/2024, 584)
** Stop loss is a sustained break below 556. It can trade below that intraday, but if it closes below 556 on 2 consecutive days it will assume risk of dropping lower to test 537
Good Luck bears, bulls still have this.
~Jerrymandering 101

AUDCAD R:R 1:4This is for short term
Awaiting for News Release.
Marked Possible Buy zone
Once Reached Entry zone Look for Liquidity sweep and BOS in LTF then Enter
And this is risky too.
Please DYOR before entering the trade.

LONG WAY TO PARADISEWell, I wish that I could tell you it was easy,
Just take the paved road right to paradise
But the truth is my friend, the pain and suffering never ends
Make amends with medicine, amnesia, and lies
The grains sift coarsely through the hour glass
And they pound like boulders on the brain
All those things you did for fun,
Never hurting anyone,
Careless shadows in the sun, just empty and lame
And it's no, it's no use thinking that you're wrong
The past is old and gone
It's best to move along and find your Avalon...

BTC Breaks Out from 200 Days Range Bitcoin has been on quite a journey, spending over 200 days locked in a range-bound pattern. But, as the saying goes, "good things come to those who wait." Bitcoin has finally made a breakout move to the upside, and it's got its sights set on an ambitious target of $40,000. However, it's essential to recognize that it will likely need some time for reaccumulation before testing the range once more and forging ahead. 📈🎯
Breaking Free from the Range:
Look closer how this reaccumulation looks at 1H time-frame :
We are always moving from one liquidity to another
For what felt like an eternity, Bitcoin has been trading within a range, caught between certain price levels. But now, it has broken free, like a phoenix rising from the ashes, and its upward journey has begun. 🌅🚀
The Reaccumulation Phase:
After such a substantial breakout, it's only natural that Bitcoin would want to take a breath and reaccumulate its strength. This period of consolidation is essential to fortify the newfound levels and gather momentum for the next phase. ⏳🔍
Retesting the Range:
Before aiming for the ambitious $40,000 target, Bitcoin is likely to revisit the range it spent so long in. This retest will serve as a confirmation of the new support levels and ensure the foundation is solid for further upward movement. 🔄💪
Trading Strategy:
Observation: Keep a close eye on Bitcoin's price action and how it interacts with the former range boundaries.
Patience: Be prepared for a period of reaccumulation and consolidation. It's during these times that savvy traders position themselves for the next leg up.
Risk Management: Maintain sound risk management practices, especially when dealing with a market as dynamic as Bitcoin.
Conclusion:
Bitcoin's breakout from its long-standing range is an exciting development. However, it's crucial to remain patient and adaptable. The cryptocurrency market can be both exhilarating and unpredictable, so it's essential to be ready for a range retest and subsequent movements.
As Bitcoin sets its sights on $40,000, make sure you stay informed, exercise caution, and be prepared for the journey ahead.
❗️Get my 3 crypto trading indicators for FREE! Link below🔑

Why not coconut :DBitcoin had a 20 week rally starting 21 November 2022 after 23 weeks of double bottom formation which was the sign of strength (SOS) event in this accumulation structure.
Now, after another 26 weeks of sideways re-accumulation type structure, Bitcoin has retested 25k zone multiple times and flipped this once resistance in to support and is ready for the markup towards 48k where i'll be looking to take profits.
Take care :)

KPR Mill Limited - Reaccumulation Review► Phase of reaccumulation begins with a buying climax, wherein the previous rally takes a halt.
► Then a drop is seen which goes to the automatic reaction where other buyers jump in as they see value in the stock.
► After AR, a secondary test happens where another round of selling happens.
► AR and ST define the range of the reaccumulation. Note- at this point we are still not clear whether this is a distribution of reaccumulation.
► Then a spring occurs (optional). This is where weak hands are thrown away from the reaccumulation.
► In between support and resistance, creek occurs where price moves in neither direction doing time-pass here and there.
► Once the resistance is broken, we see big volumes at the LPS - last point of support. This is where we can confirm it is a reaccumulation phase.
This material shows schematics of reaccumulation phase and is only for educational purposes. Please consider taking professional advise from your financial advisor before entering any positions.
Please like and share if you find the material useful.

pt.1 FX:EURUSD Sorry i had to step out at the end for a quick sec. This is a shot breakdown of how a market structure is created i will be back to release the second halve of this video later tonight. Lmk in the comments what you think!

JUNE 14 2023- BUY tradea classic RBR in GU.
RR: 1:10
entry at 5min and 15 min demand zone.
wyckoff schematics on lower timeframe.
HIGHER TF- Movement is bullish ---> check structure then refine in lower tf.
