Reaccumulation


Possible Long Scenario France 40 (FRA40)To me it look like a good Re accumulation schematic playing out. Just waiting on a test.
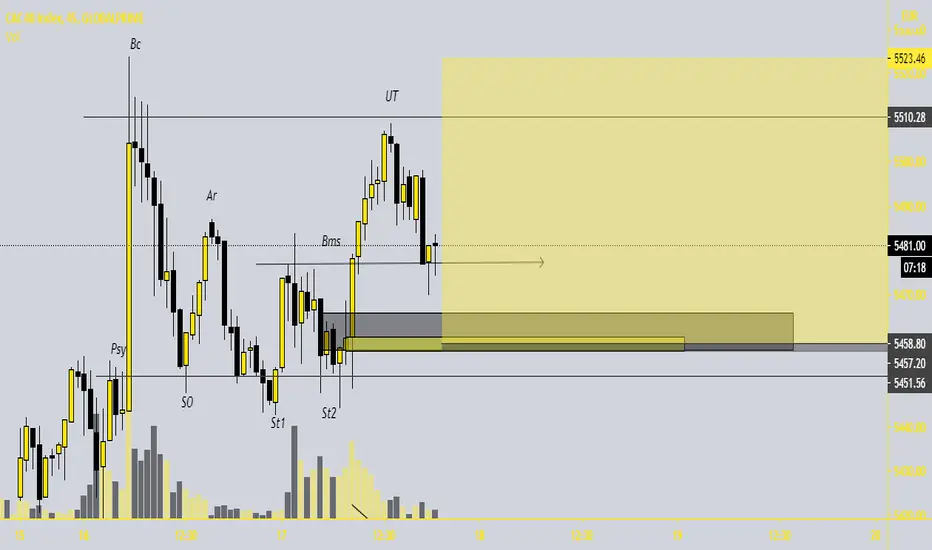
EURUSD - REACCUMULATION (LONG)1HR REACCMULATION COULD BE PLAYING OUT, JUST NEED TO SEE A BREAK OF STRCTURE TO THE UPSIDE
PRICE SPENT CONSIDERABLE TIME ABOVE THE BUYERS CLIMAX ZONE , NOT CONSISTENT WITH LIQUIDITY GRABS/MANIPULATIONS OF THE HIGHS IN A DISTRIBUTION
PRICE DID NOT SPEND ANY UNNECCSSARY TIME BELOW THE AUTOMATIC RESPONSE AND SIGN OF WEAKNESS LEVELS THUS PERHAPS FURTHER SUGGESTING A DESIRE TO MOVE TO THE UPSIDE
AN IMBALANCE WAS FILLED IN DURING THIS DOWN MOVE AND APART FROM ANOTHER IMBALANCE (SEEMINGLY INSIGNIFICANT), THERE IS NOT MUCH IN THE NEARBY PROXIMITY BELOW PRICE FOR IT TO SHOOT FOR
MANY LARGE TF INSTITUTIONAL CANDLES AND ALSO AN IMBALANCE ARE WAITING ABOVE PRICE, ABOUT 100+ PIPS AWAY, IF A BREAK OF STRUCTURE DOES OCCUR, THESE ZONES SHOULD BE TARGETED

Updates: Bitcoin formed a simetric triangle flag!!! Good signalWe're in Bitcoin from Friday and Bitcoin is prepare to a up movement!!! So, investor are buying in this simetric triangle of re-accumulation!!!
As we are in consolidation and re-accumulation in this zone, Bitcoin is prepared to a bullish movement!!! So, I believe that it's arukk a good signal to continue buy more Bitcoin. But, as I have 0.06 lots inverted between these 2 trade, I just trade with 0.06 lots that i still open up these posiiton one from Friday and one from yesterday.
And also, guys, we're forming a elliot wave analysis using this model that I am to prepared for you to understand in the cycle of trend. Remember that my own target is $12,000 USD.
We're in profit in our first trade of Friday protecting our long position and then, our second position is in profit, so at the moment, the break even it's keep in this zone until we see any updated for tomorrow or the next days!!!
Good luck on this position!!!

UNISWAP Wyckoff Spring Setup. Reaccumulation scenarioDownsloping consolidation. Reaccumulation scenario
Spring Setup. Confirmation: close above $6.30
Pattern failure: Stop loss at $5.37
Wyckoff Crypto Discussion
Join us each Thursday for a free discussion of the cryptocurrency market from a Wyckoff perspective. These sessions are hosted by Alessio Rutigliano and Roman Bogomazov.
www.youtube.com

(Part 3) EUR/USD Top Down Analysis - Actionable Setups Hi traders and thank you for joining this analysis
As promised, today I'll be looking at the intraday price action of EUR vs.USD to create an actionable trading plan!
In my two previous posts, I have discussed the long term and medium-term price action in depth.
Our analysis points to higher prices so it really is a matter of tactics at this point!
If you haven't caught up with the price action, you can check out the two posts below:
(Part I) EUR/USD Top-Down analysis with Wyckoff and Elliott Wave
(Part 2) EUR/USD Top-Down analysis: PnF and Target setting
Now that you're caught up, let's check out today's chart:
We see two major trading ranges, the solid lines depict a horizontal Wyckoffian trading range, let's call this Trading Range 1 (TR 1)
and the dashed lines take the slope of price action into consideration and I call them acceleration channels, but for today let's designate it (TR 2)
we see from the left that after price accelerated too much to the upside, it became oversold and created a buying climax and a change of behavior
Price also shows it's strength by progressively closing and committing above the local high (#2)
The mrkt was also not able to commit below the blue ribbon and reversed after a scoop below the value zone
All of these observations signal a strong buying pressure.
It is entirely possible to hold the 1.185 level and continue higher as part of the next impulse wave unfolding
Otherwise, the formation of a triangle is possible as volatility windes down and price action reaches a point of equilibrium (the apex)
Both these possibilities signify price's adherence to TR2, as a result a break and commitment above the 1.2 handles would be quite possible
On a more conservative short-term view, an acceleration to the lower range of TR1 is possible (the major buy zone). That would create the classic Phase |C| shakeout or spring and
create the causality to push the price higher.
For the folks who prefer a more visual representation, I've created rough sketches on the chart above to guide your trading in the next few days! (The buy moves / zones are highlighted in green)
And that's it for my EUR/USD analysis. I will continue to post short-term updates on intraday as price action unfolds. Be sure to follow me for future updates!
If you liked my analysis or are following through, please give it a thumbs up! I put a lot of time into my posts and your support will let TradingView know my articles are helpful!


SNAP ReAccumulation?SNAP has had an incredible run into earnings and obviously profits have been taken off the table. It is trading below the pivot range for August and has been sold pretty heavily at previous Month's Close price. With a Key LVN arounf 20.30. and a narrow developing pivot range for September I'm watching for a failed new low into the LVN as a possible long candidate. There are 130000 OI contacts in 21C 16 OCT 20 I'm watching for an accumulation zone which may explain the narrow range around 21 in the common.
No trade yet. Lets watch for an entry.

Update on gold.Camarilla monthly levels on the 12 hour chart. As you can see 1748 crucial resistance. Breaking that could lead to the upper 1700s quite easily. As you can also see we have some large bearish divergence. Wave trend is minor up. macd is crossed up. OBV is high. PP is getting higher. Oscillator has not much to say here. This area could be redistribution because of where we are. At the same time it could be reaccumulation because of how long we have been here. 2 months in this range. and consolidating in the upper bounds. either way will move hard one way or another
Level H4 to break out and then to target H5 and H5. OR if we lose H3 will high probability travel to Pivot and then potential L3 or beyond

USOIL BUY from 50% of re-accumulationit was an expected drop from 40. i knew about this from past month about retracement from 40. After rising from zero it made a formation which target was 39.5/40 and after completing the target market always retrace back from the target area. although there was no conformation of sell but when the target complete its obvious that market will retrace back. There is a trading strategy that tells exact point of target at the same time target become a retracement area because of perfection.
32.41 is a perfect touch point for now.
Don't Forget to Hit the like button if you find it helpful and informative and follow to catch every wave correctly and remember to share ideas.
Previous ideas

RENUSD Low cap cyclical reaccumulationExample of cryptocurrency in cyclical reaccumulation.
Trading the Crypto Market with the Wyckoff Method
3 Session Course totaly devoted to cryptocurrencies and Wyckoff Method. 6 hours of materials and exercises.
www.wyckoffanalytics.com

GBPUSD BUY: RE-AccumulationGo for buy in gbpusd. It has formed reaccumulation pattern above strong support. it will make new high. Good time to make money from gbpusd.
Don't Forget to Hit the like button if you find it helpful and informative and follow to catch every wave correctly and remember to share ideas.
Previous analysis

EURUSD - Wyckoff and Market PhasesHello Traders !
Today I would like to share with you an addition confirmation why I shorted EURUSD. I used Wyckoff Market Phases
Market Phase:
- Accumulation Phase: During a bull market, the accumulation phase begins when the informed investors usually enter their positions.
- Re-Accumulation Phase: As soon as the price leaves the accumulation phase and the new trend becomes visible, the phase of Re-Accumulation begins. Here, more and more investors are joining
the trend and ensuring higher prices
- Distribution Phase: We are currently in the Distribution Phase. At this stage, the market is often overbought, although the uninformed traders still believe that more bullish pressure is coming.
Afterwards the price will drop .
Wyckoff:
- This analysis clearly shows Wyckoff Theory.
1) Accumulation: The big players buy carefully
2) Mark Up: classic Up Trend
3) Distribution: Up Trend runs out of the steam and the market goes down or into a sideways trading range. The big players starts shorting the price.
4) Mark Down: classic Down Trend after distribution
Proof for Wyckoff: The market is ranging now for a while which clearly proofs the Distribution Phase on GBPJPY . Afterwards of a Distribution the Mark Down is following and the price will drop a lot.
I hope you guys could learn something out of it. Very important and nice theory.
Thank you and we will see next time
- Darius.

BTC & AAPL - Wyckoff Re-AccumulationOverview:
Spent a few hours studying recent BTC moves, trying to identify the "right lenses" to view the price action.
Incredibly enough, I found a fantastic Wyckoff schematic, that matches: Wyckoff Phase, Price Action, and Volume.
Nearly identical.
Analysis:
Here is the Wyckoff schematic, with matching phases, price action, and volume.
I did not have the chance to re-create it in TV, however, please use the following link for reference.
d.stockcharts.com
Cheers!

USDCAD short Exact Explained (Market Phase, Compression, S&D)Hello Traders !
I decided to post USDCAD with an exact explanation.
Market Phase:
1) Accumulation Phase - Smart money, experienced traders and institution join the market
2) Re-Accumulation Phase - Here, more and more investors are joining the trend and ensuring higher prices.
3) Distribution - Is the origin and the initial phase of a bear market, at this stage, the market is often overbought
Compression:
It shows us the power of the Supply and Demand Zone. This is is typically a Uptrend or Downtrend till the next Supply or Demand Zone. From there the price will reverse.
Let me now in the comment section below your view on USDCAD and what you think about my Analysis.
Please leave a Like
Thank you and we will see next time
- Darius.


3-Day Price Action hints at another dropBitcoin has been erratic over Christmas which is unsurprising. However a summary of the Price Action on the 3-day chart points to the possibility of another dip.
We have a clear downtrend, a pullback into the 10-20 EMA zone and bearish candles forming over the last 7 days with strong rejections to the upside. We also have convgergence on the MACD and RSI indicators.
This is a very valid setup for a short trade and bears looking to ride the trend lower will be watching closely for a break of the previous 3-Day candle. If this level is broken (around $7120 on most exchanges) we will likely see a move further down to support or to re-test the previous lows.
That all said, I still think Bitcoin still has all the signs of a re-accumulation phase of a new bull market (see previous post). However this is just a word of caution to not jump the gun as a short term dip to $6500-$6800 before is possible.

Bitcoin Bears tiring out?There are many confluent reasons to suggest Bitcoin is in a re-accumulation phase of a new bull market.
To set the scene, BTC has been in a clear downtrend and mostly trading below all key Daily EMAs for several months. So this has been a good time to be stacking sats whilst protecting dollars.
However, Bitcoin is still finding key support at a 61.8% retrace of its 2019 high, showing significant interest from long term bulls and offering a second opportunity to accumulate at these levels.
Last week we also saw bullish RSI divergence for a second time, suggesting sellers are losing steam. However on this occasion BTC did not make it to the base of its long term channel before bouncing, further hinting that a bottom might be in.
It's still hard to find reasons to go ultra-bullish right away, but the chart shows many good reasons to be re-accumulating for the long term.
It is still unclear what 2019 was really all about for Bitcoin. Was this really the start of a new bull market or merely a bear market rally post the $20k euphoria? We'll probably have to wait until next year to know.
Fundamentally however, with the upcoming halvening, increasing scarcity, precious metals breaking bullish and a precarious global economy with spiralling debt, Bitcoin looks pretty compelling right now.


Whale Reaccumulation Zone?Pattern suggests possible reaccumulation by a handful of whales on Bitfinex, where Longs skyrocket to all time highs on taps to the .618 and .65 retraces of the macro bull run which began back in April. Meanwhile funding rate on Bitmex remains fairly neutral, suggesting the Longs are from Bitfinex only.
A long squeeze, if it happens, may not kick in fully unless we break the local low of $6618 (on Bitfinex).
I remain short, but finding reasons to be careful.


XTZ to show bullish Wyckoff and Elliott Wave Structures
Hi everyone and welcome to my analysis.
It is once again hype time for many alts and Bitcoin is volatile and thankfully this time a lot of cryptos show finishing accumulation signs.
As a start, we can look at XTZUSD to see the beautiful Primary wave I of a larger bullish trend. Alternately, this might be an ABC bullish reaction to the initial downtrend created by XTZ until early 2019. Regardless, the trajectory is upward.
In the chart above, you can see the ABC pullback from the 5 wave bullish structure (which might be a wave II or B of an ABC). Now for those who like the extra fine details in EW analysis, this mostly looks likes an WXY double 3. So we have a smaller ABC in the marked W, and X and Y. But in my analysis EW just plays a guiding role in understanding the overall market structure. The point is, you need to see a 3 legged correction that doesn't give back all of the gains. The detailed count does not matter as much, when our trading strategy is defined by the Wyckoff method and not EW.
So off to our possible re-accumulation then. We can see the selling climax of wave A falling beautifully at 0.236 Fib level, which is a common pullback level for wave II in EW. Interestingly, the automatic reaction off the selling climax also falls at the 0.618 of the larger bullish trend, which again gives some weight to the analysis.
The structure of a trading range usually beings with a stopping action, where due to extra high demand, or extra high supple, the big market players (the composite operator - the CO) would take on a contrarian attitude (phase A). As a result an automatic reaction and a test of the low/high is formed.
After the shares change hands, (phase B), a last point of fear or capitulation occurs, when people loose their hopes of the market going up ever (this is similar to Elliott's description of wave II sentiment). Again since the majority is selling at this point, we have CO buying (phase C), which creates a stopping action, absorbs the last of the supply, and creates the final bullish push out of the trading range (phase D)
Also, in (re)accumulations, we typically see a diminishing supply up until the phase C capitulation.
So all of that in mind, one thing doesn't look right here:
We see that after our phase C shakeout, we follow the uptrend with a climactic action, with the largest supply in the range, that signal’s CO’s activity. So why is that so? Are we wrong? Is this a distribution?
Of course in the Wyckoff method we tend to focus more on “diagnosing” the market, rather than predicting it. If this current uptrend follows a UTAD formation, then we will shift our view to a bearish one.
For now, we need to look for other signs.
My hypothesis is that this is due to the hype of altcoins raising again. The market ALWAYS goes opposite to the majority’s expectation (which another way of saying the CO is contrarian). If all of us crypto traders are on a lookout for an upturn in alts, then with the positive signals that we see here, we all jump in to secure our part in the uptrend. What happens next? The CO sells it’s shares to profit from our available liquidity. (also CO here is similar to whales, the concept is the same, only Wyckoff studied them in stocks)
So to find better perspectives, we need to look at the BTC cross:
Let’s look at it from a EW and traditional charting perspective:
Given that we’re looking at correlating markets, we should see some type of similarity between the crosses.
One of our hypothesis was that this is a market with an WXY correction, waiting for wave Y to unfold. (or similarly, a wave ABC with C unfolding)
In the following screenshot, we can see a similar structure, with a count that makes sense for the narrative:
We see the wave A impulse type, a wave B rising triangle with a matching count, and wave C’s inception point.
We can also do the following count though:
Though here is when it gets interesting:
When we look at the market from a systematic Wyckoffian view, We can see the corrective pullback and selling climax similar to the USD cross. From this perspective, we see that we are still missing Phase C of our trading range. As we are going with a bullish view for now, we are looking for a pullback either to the 0.0013 area or the 0.00112 area. Before a sustainable uptrend to form.
This point, goes hand in hand with the observation that we had a buying climax in our USD pair, and validates the expectation for a pullback before bullish continuation
All in all folks, I believe a successful trader must refrain from predicting the market. Having an expectation or sentiment might be helpful, though it can easily introduce bias into our analysis and cause our updated view to follow too late after the market conditions switch. A great trader, is like a doctor. WE must know what signs in the market signal a specific behavior, and wait for confirmation to validate or reject the idea. So we shall wait for the market to create confirmation or rejection signals for us, and we will update this analysis here as the market unfolds.
If you folks enjoyed my analysis, and want to stay up to date with updates, don't forget to follow me.
If you have any suggestions and criticisms please let me know in the comments! we are here to empower each other to survive this market!
Shayan
