Thinking of Buying a House? 🪓As many of you know the price of real estate has been rising at an unprecedented rate. Along with this is also the rising lumber rates.
- If you are thinking about buying a house; right now would NOT be an ideal time.
- You are paying an inflated price for a home while also paying for the additional lumber costs, which are up 146% since march! Now many people are selling their homes for a great profit!
- Just like the stock market - Buy Low / Sell High.
Realestate

Extra Space Storage Inc. (EXR) Has More Room To RunEXR has been leading the S&P 500's real-estate sector, and there are no divergences yet in price, which tells us this stock could have further up to go.

Go Long KDH (VN Stock)Go Long KDH at 36.5 with a huge volume breakout bar.
The bar confirmed for the breakout bar out of resistance at 35.8 from the day of 4 May and finished test resistance with a long-tail pinbar of the 19 May.
The average volume continuously increase to support for longterm uptrend.

This ticks all the boxes!!!Combining Tech and Real estate, eXp World Holdings, Inc. operates as operates as a cloud-based real estate brokerage firm. The company is headquartered in Bellingham, Washington and currently employs 354 full-time employees. The firm's segments include Real Estate Brokerage Services, Mortgage Origination Services, and Corporate and Other. The company operates over the Internet through its Website, exprealty.com and a cloud-based platform to provide its residential real estate brokerage services. Through its Website, buyers can search real-time property listings, and sellers list their properties and gain exposure across the various markets it operates within. The company also provides buyers and sellers access to a network of professional, consumer-centric agents and brokers.
With such a low cap, and such high earnings, this seems very very promising. 2020 Revenue Increased 84% to Record $1.8 Billion; Drives Most Profitable Year in Company History With Net Income of More Than $31 Million.
Just look at the juicy balance sheet. Analysts also keep the rating at $50+ at a hold or buy.
Price is outside far ATR on Keltner channels so we bought in which seems to have bottomed. I may DCA too.
Let's go long on this gem.
(Disclaimer, not financial advice)
NASDAQ:EXPI

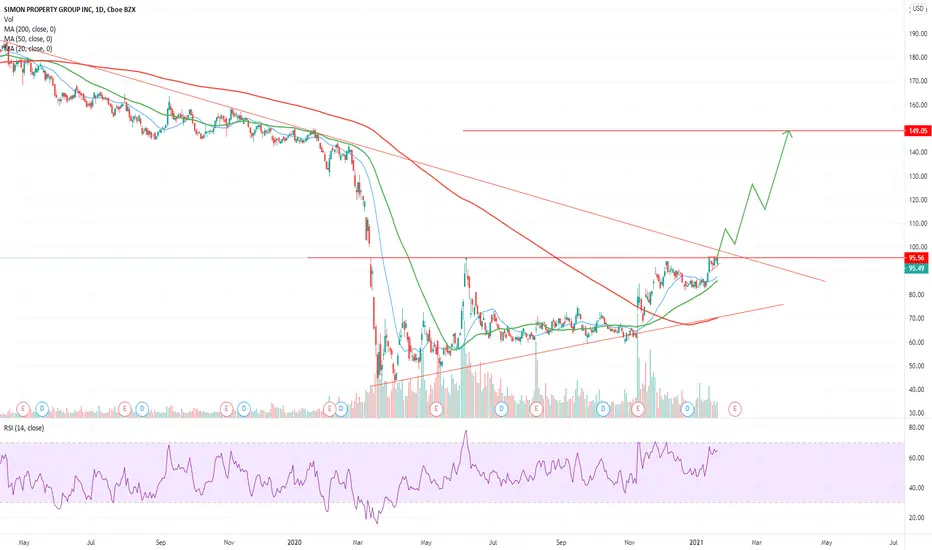
Buy $SPG - NRPicks 16 AbrSimon Property Group operates as a real estate investment trust dedicated to the ownership of world-class stores, restaurants, entertainment and mixed-use destinations.
The company is in a delayed sector, consolidated its recovery and uptrend.
- Revenue $4.6B
- Net Income $1.1B
- EBITDA $3.2B
- EBITDA MARGIN 71.1%
- Dividend Yield 4.54%

If Wall Street Crashes, Will Crypto Go Up or Down?If Wall Street Crashes, Will Crypto Go Up or Down?

Time to buy call options on DRVThe Real Estate Sector seems to be extremely overbought on all oscillators at a potential trendline while DRV (The Inverse) seems oversold. I think that the safest way to play this right now would be to buy some calls on DRV.
Is Wall Street About to Crash? Crypto and the Real-Estate MarketIs Wall Street About to Crash? The TL;DR is: Probably.

Legacy Housing (LEGH) an interesting small_cap to deal with Legacy Housing - LEGH on Nasdaq.
This is one of the small-capitalization stocks that I monitor.
I like real estate at a time of inflationary uncertainty.
Right now, it's graphically locked into a triangle.
I'll keep an eye out for a break.
Know more about it:
Youtube profile of the company: www.youtube.com
Seeking Alpha analysis: seekingalpha.com

GBCS - US Based - NET PROFIT penny Stock - The KingThey focus in real estate investment and medical service
Growing fast

Zillow retracement looks like a great buying opportunity !!!Date- 4/42021
CMP- 133.41USD
Shares of Zillow have seen a ~40% correction from 52-week highs since mid-February.
Though the stock prices have declined the housing market seems to show no signs of cooling down.
The stock price currently bounced off the trend line acting as a support and also enjoys a strong support zone as shown in the chart.

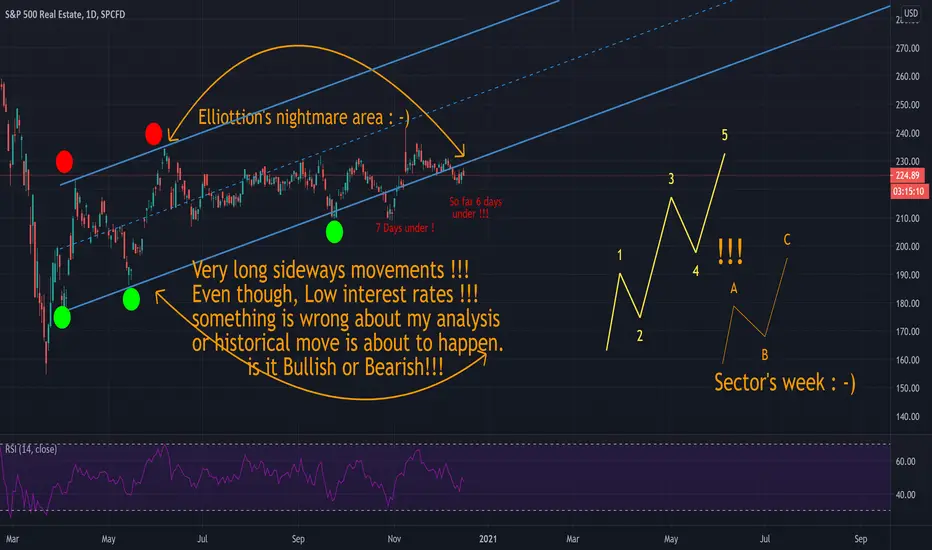
RMR: Elliott impulse wave finishing, correction wave incoming?Hi. I've plotted a resistance zone that's been prevalent since the start of the year. I've also plotted some Elliot waves: some past, some current and some incoming.
The recent Three Drives pattern is over and unfortunately I didn't recognize it in time. But a good question then is what's next?
Well there is a clear impulse wave occurring at the moment. The high price difference between the MA 56 and close price strongly indicates that the impulse wave will continue to finish wave 3 and 4. The exact time when this will happen is uncertain, the price on point 5 is just an example.
But this means a correction wave is incoming when the impulse finishes.
There are two decent position to make if you believe the impending waves are probable:
When the current impulse wave has finished there is a good timing for a short position to profit off of the correction wave.
When that correction wave is complete there will most likely be an impulse wave. A long position when this is apparent or a long position on the B point of that wave could both be decent.
Thank you. Please, if you have any thoughts or comments do leave them below and I would gladly discuss or adjust my interpretations and methods with you.
This does not constitute financial advice. Any projected prices, even if explicitly stated, are made with intent to discuss the symbol and potential interpretations. Any trades shown or mentioned are examples and neither recommendations or mandates.

$GHVI 230T digital real estate$GHVI
240b addressable market
150+ operating countries
18x growth for past 2 years
Revenue Growth - 87% YoY
100b potential market cap 🤑
GHVI Can do 10x 🌟if it goes like Zillow 40x 🌟🌟
If they go monopoly 100b it’s 100x 🌟🌟🌟

UWMC"We are happy to announce that $UWMC has been included in the preliminary list of IPO additions for the Russell 1000 and Russell 3000 indexes." -UWMC

REA - Will we get a chance to get in at a lower price?Volume divergence indicating (high probabilty) that we may have a cheaper REA share price soon. I'm eyeing the high 120's to low/mid 135's as support and a potential entry.

Care Property Invest: Fibo suggests to buy at 24.80€Private placement of 1.736.346 shares at a price of 25.55€ made today to acquire "Résidence des Ardennes" (Attert, Belgium) makes the share price tumble more than 3.35% once trading is opened at 14:30h (closed since 9:00). Fibonacci retracement suggests buying at 24.80€. However, volatility in markets due to lockdowns may drag the price towards 18.80€ again but with these good fundamentals it's hard to imagine:
P/E = 22.34 (industry 20.95)
EBITDA 5YA = 105.2%
LT Debt to Equity ratio = 55.53%
Total Debt to Equity ratio = 93.27%
Payout ratio = 71.68%
So, good entry point at 24.80€. But today a triangle also closed and normally when triangles close, means spike up or down. Let's keep eyes focused on China and its covid19 evolution as well in order not to be caught by surprise as last March when everything was falling since the end of January 2020.
Man is the only animal that trips twice over the same stone, however maybe market psycology is already discounting that. Who knows.

Is this the next EXP? Looking at some interesting accumulation here. REAX business model in the Real Estate market could hit in a low interest rate market here in 2021.
Thoughts?
Not financial advice, just a guy looking at some trends.
Thoughts below please.

SPG is about to break out Real estate is expected to out perform the index in 2021. NYSE:SPG is about to break out and go for a nice bull run, long the break above 96$. Anticipated price movement is shown on the chart, stop 80$.
Hit the like button and follow if you find this useful :)
This is only my own view and not financial advice, do your own analysis before buying or selling
Happy Trading!
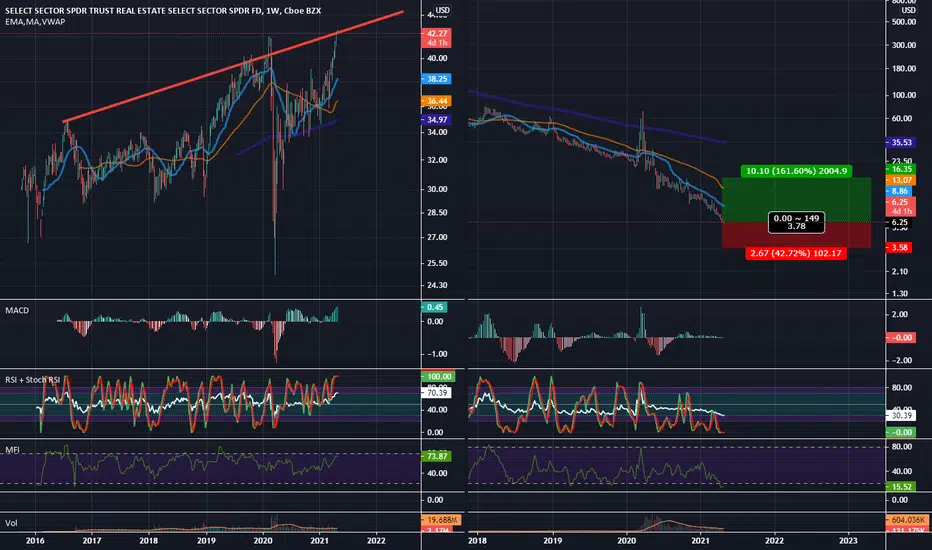
XLRE (real estate sector) in trouble!The real estate sector is in trouble! The sector is presumed to climb up another 20% (more or less) before plummeting under the “unloading zone”

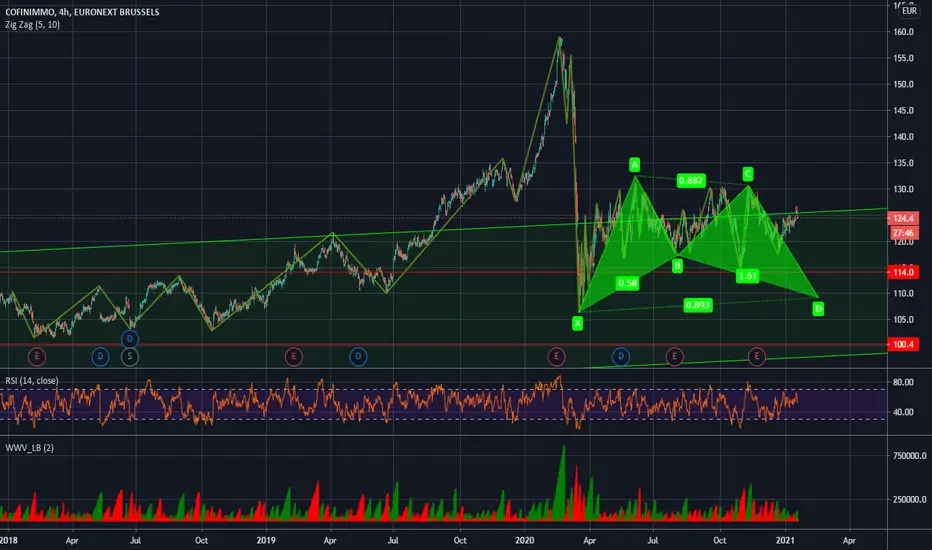
COFINIMMO: Bullish bat pattern on its way?Long-term perspective is bullish. However, key support at 100 and 114. 18 February = limit date to buy.
RDFN AlertDouble top, possible downside potential, can play the 77.06 - 72.27 range . Can look for a short term play or grab something with time if we break through our 70.47 support (yellow) .