WARNING: Why US Real Estate Bubble Is About to Implode!Dear Friends
You know how D4rkEnergY is here to help you! That's his mission - he is here to make everyone happy. He will warn you about buying your dream home
now. Here is why!
XHB index, the Homebuilder Index, is where we want to look if we want to get an idea about the real estate market in US. It's a really good leading indicator, and are composed of sectors like: homebuilding, construction supply, home improvement, electrical components and home furnishing etc.
It predicted the market crash in 2007-2008 - notice how the index already crashed in 2006 before the real crash happened. Also notice how 2018 has been a huge bloodbath. This could very well be a sign of an coming crash, IF we continue down.
And down we will go - most likely. We already survived one Head and Shoulder pattern due to help from the EMA50. But we are now below this critical area, and the EMA now working against us as resistance.
So here is D4rkEnergYs advice to you:
Don't buy a house now - wait a year or 2 and you can get your dream home on sale!
D4 Loves You <3
Please leave a LIKE! Thanks in advance
Realestate

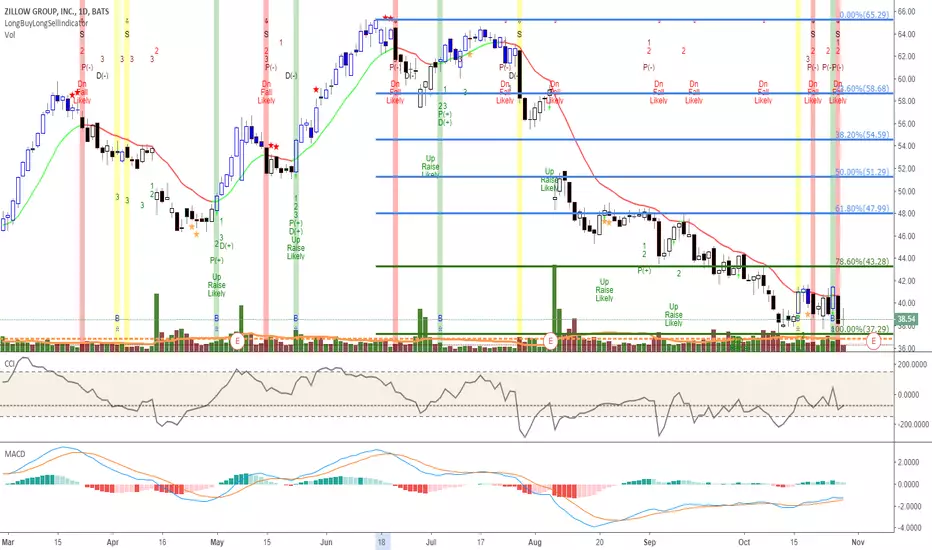
Zillow Group - The Digital Real Estate game changerZillow Group is likely the RE game changer for changing the way RE is bought and sold from 5-7% commissions and today's housing markets. Not a Redfin fan for being a game changer, and Zillow still needs to figure out some things with FSBO (for sale by owner).
Down 43% from peak. 1/2 share entry and 1/2 share standing order lower, just thoughts for now.
ZG
VIX
RDFN
Buy and sell if you can or hold a month or 10 The numbers are telling the story here. I believe in playing the trend with high success.

Real Estate Paints A Very Clear PictureThis, my Custom Real Estate Index, paints a very clear picture that RE does not like the recent FED rate increase and is under pressure. One could state that investors are fearful that RE returns could be pushed towards the negative and that the US Real Estate markets could "roll over" with another Fed rate increase.
Right now, the price channel and regression channel are the only keys we have to price boundaries. My theory is that any further breakdown would be cause for grave concern as this could be the start of a much deeper bearish trend. Yet, be cautious initially as this could be a "washout low" formation setting up like we saw in 2016 (elections).
That reminds me, be prepared for some unusual price swings before the US Mid-term elections. The 30~60 days prior to any election are usually quite volatile.
Be cautious of the Real Estate sector right now. One or two more Fed rate hikes and this sector could turn into a falling knife very quickly.
I'm actively looking for a bottom to setup. It would help if the Fed decreased rates or started discussing a balanced forward approach to rates.

IYR Elliott Wave Analysis: Tracking Recent Price ActionHello Traders,
IYR ended the cycle from 03/23/18 (72.71) low at the peak of 07/06/18 (82.20) in blue wave (3). Below from there, the ETF ended the correction from 07/06/18 (82.20) peak in blue wave (4) at 79.23 low.
Up from there, the ETF ended the cycle from 07/25/18 low in red wave W at 08/20/18 (83.62) peak. The internals of that move unfolded as a Elliott Wave double correction where it ended black wave ((w)) at 08/06/18 peak (82.46), black wave ((x)) pullback at 08/13/18 low (80.55) and finally black wave ((y)) of red wave W at 08/20/18 peak (83.60). The ETF is currently in the progress of correcting the cycle from 07/25/18 low (79.23) in 3-7 or 11 swings in red wave X.
Near-term focus remains towards 81.74-81.48, which is 100%-123.6% Fibonacci extension area of black wave ((a))-((b)) to end black wave ((c)) of red wave X pullback. Afterwards, the ETF is expected to find buyers for red wave X higher ideally or should do a 3 waves reaction higher at least. We don’t like selling it into a proposed pullback as the right side remains to the upside.

The most logical short in the stock market: TAOEarlier this month, my friend Harrison Schwartz wrote an eye opening article exposing the disaster that is in store for Chinese Real Estate investors (seekingalpha.com). The article analyzes the unthinkable situation China is in, and what is most likely going to happen. After reading it, my first thought was how can I make money off of this inevitable crash? That brought me to TAO, an ETF that tracks Chinese Real Estate. Fundamentally, this ETF could drop 80% over the next year or two. Technically, the signs are there as well. It is the most logical trade I have ever made.
Looking at the chart, there is a clear head and shoulders pattern that has formed over the past 10 months. A death cross has recently occurred, marked by the 50 day moving average crossing below the 200 day moving average, a very bearish signal. There has been a recent bounce after bullish divergence on the RSI which could lead more short term gains. However, if TAO reaches the low $29's, it will most likely get stopped out by resistance in the 200 day moving average and resume its plummet, where I will be looking to enter a highly leveraged short position. Lastly, the weekly chart for TAO confirms the long term bear trend that it has entered, as RSI is pointing down hard, validating the recent bull trap.

LONG BITCOIN TO BOTTOM AT $5K? History reveals hidden "There is nothing new in Wall Street. There can’t be because speculation is as old as the hills. Whatever happens in the stock market today has happened before and will happen again" -Jesse Livermore. Despite claims that millennials are the most purpose driven generation, history shows they have failed to overcome the traps of speculation and investment. From the Tulip bubble(1634) to the Gold bubble(1980), we saw the psychology of fear and greed in market prices. Just when it seemed investors and traders have learned, then came the dot com bubble(1996) which was followed by the Real estate bubble(2008). In the middle of the financial crisis in 2008, A new technology was born, with a promise to end all financial crisis and restore trust to the financial system. Despite its disruptive and use case, we have found ourselves once again in a bubble which raises the question, "Have we ever learned from history?"
I will argue that yes we have. The fact is, regardless of the disruptive nature of any invention, markets eventually run ahead of reality, greed kicks in and then comes the dip. Bubble are arguably healthy for the ecosystem as it eliminate the "dump money" looking to get rich quick. They also create Technical entry points for long term investor. But how do we know when a market has bottom?
History has shown that most market crashes are likely to bottom at 75% dip on just below. Stock market traders use market sentiment charts to measure this. For stock trading, when the market sentiment index scale(0-100) reaches or drops below 25, it indicates a buy signal. Looking at the BTCUSD chart, price fall from all time high to $5000 or slightly below indicate a dip of 75% which shows we are left with 25%. Cryptocurrencies are a highly volatile asset class and thus, its very difficult to pin point the exact momentum to which the price will reverse. This for what it is, will serve as a technical point for a major reversal together with fundamentals at the given time.

IYR, Daily, BearishThere's a triple divergence on the IYR chart (U.S. Real Estate ETF).
1. First high
2. Second high, lower high on MACD
3. Third high, even lower high on MACD
There is some space between 1. and 2. on the MACD. I would appreciate if anyone knows whether the MACD gap would disqualify 1. as the first high in a divergence analysis.

$POLY The Future of Tokenized SecuritiesPoly has been on a steady uptrend minus the latest downtrend due to BTC. I do anticipate however the start of a massive uptrend once Bitcoin breaks back to the upside over 12,000 causing a massive surge in Alts especially with its niche technology of tokenizing commodities, real estate, venture funds and venture capitol.

Short Real EstateI dont trade Real estate but i would if my trade/platform would give the chance.
A nice short seems to be presenting here. Entry below Heikin ashi doji en stop above it. TP below in range. Move SL at own discretion, but not to tight.

Real estate is screwed from hereReal estate broke through the 50 MA and with the rising interest rates and the central banks starting to sell their MBS then this market will plummet soon.

IYR Weekly - interesting locationJust an observation on the real estate ETF while I was reading up on the US mortgage debt and its connection to real estate stocks.
Intriguing as I learn more this. IYR is in an very interesting spot.
Apparently, the current mortgage debt levels are similar to levels leading up to the 2008 crash.
fred.stlouisfed.org

Best range trading of 2017? RWR - DailyAside of that false breakout (circled) this has been (and still is?) great to play the range.

UNIBAIL RODAMCO possible break up!!Unibail could break up all the way to 230. Watch out at this levels, price action rules. It will probably get to 219 and at that level we will check closing and opening price. It should happen by this week.
I am already long since 208 and this week will decide if I will keep it long or short it.
Have a nice trade :)


Profit taking level reachedInvestors may realise some of the +5.5% and let the rest run. If price pulls back, we are provided with another opportunity to buy cheap.

Technically Speaking, Real Estate Could Move UpThe SPDR fund tracking the Real Estate Sector (XLRE) has been in a clearly defined upward trend since November 2016. As of the close on May 12, this fund is at the bottom of the cycle which is near a strongly established support. The projected future movements are highlighted below.
When we take a look at other technical indicators, the relative strength index (RSI) is at 41.0131. RSI tends to determine trends, overbought and oversold levels as well as likelihood of price swings. I personally use anything above 75 as overbought and anything under 25 as oversold. The current reading has the fund relatively neutral although it recently came down from near the overbought level The RSI is currently at a similar level where all the previous bottoms have occurred. This is the first indicator the fund should begin moving up.
The true strength index (TSI) is currently 2.6338. The TSI determines overbought/oversold levels and/or current trend. I solely use this as an indicator of trend as overbought and oversold levels vary. The TSI is double smoothed in its calculation and is a great indicator of upward and downward movement. The current reading declares the stock has been moving down, however, it is also near the same level where the previous bottoms in this cycle have been established. The TSI has also been trending up in a bullish wedge pattern. With the indicator around the same support level, this is the second indicator the fund should begin moving up.
The positive vortex indicator (VI) is at 0.8623 and the negative is at 1.1873. When the positive level is higher than 1 and higher than the negative indicator, the overall price action is moving upward. When the negative level is higher than 1 and higher than the positive indicator, the overall price action is moving downward. Currently the negative indicator is slowly moving upward which is bearish for the fund. At the same time, the positive indicator has begun to move upward. When the negative indicator finally does reverse downward and the positive makes more strident gains, the fund should be in its upward cycle.
The stochastic oscillator K value is 39.1887 and D value is 41.1774. This is a cyclical oscillator that is highly accurate and can be used to identify overbought/oversold levels as well as pending reversals and short-term activity. I personally use anything above 80 as overbought and below 20 as oversold. When the K value is higher than the D value, the stock is trending up. When the D value is higher that the K value the stock is trending down. This indicator is technically in the middle of the oscillation possibilities at the moment. The next 2-5 trading days are pertinent to determine if the actual long-term movement is to the upside.
I have broken down the last three times the fund was near its current point in the trend channel. All three of them resulted in a minimal gain of 3.92% in a minimum of 12 trading days. My current projected movement is on the conservative side, however, the stop-loss will be any movement below 31.24. Movement to this level breaks outside the support level and could lead to major downward movement for the fund.
Considering the RSI, TSI, VI and stochastic levels, the overall direction favors a move to the upside, although definitive upward movement may take a few more days to develop. Based on historical movement compared to current levels and the current position, the stock could gain at least 3% over the next 22 trading days if not sooner.
More information at LimitLessLifeSkills

Vonovia Break EvenMy Vonovia position in on break even. The breakout happend perfectly, there was a bigger pullback, thats an opportunity to move the stop.
If it breaks the 31.75 i will move my stop.
This is a long term Position, I'm even interessted in holding this Company.

SCHH relief rally stalling at fibsPrice has been in a relief rally since November which has formed a bear flag right up to the fib retraces. Should break out of this flag to the downside where we'll test the November low at the very least.

Sell Intu PropertiesIntu has under performed the FTSE and the Real Estate sector over the past 3 months. The short term trend is negative and the stock scores poorly in my fundamental model.

Great Opportunity to buy farmland in South AmericaThis stock buys you land all over South America.
319,000 Hectares between Brazil and Paraguay, just to name a few (mostly in Brazil).
Exposure to an incredible emerging market.
Exposure to commodities long term (grain and sugar mostly, cattle as well)
Management is a powerhouse.
JP Morgan owns 7% of the float.
George Soros made this company happen.
Google Eduardo Elsztain - greatest Argentine real estate investor. He's LND's Chairman.
Commodity prices are depressed. As commodities rise in the future it will generate more income for farmland.
Brazilian currency has gotten crushed in the last 10 years. New strength in the Real will benefit Brazil's economy.
Company has no debt.
Excellent growth.
Farmland known for its fantastic risk/return profile (it's land in Brazil, Peru, Chile, Argentina, etc, not a technology fad).
Under $5 per share so institutions are not allowed to invest, yet. What happens when prices hover above $5 per share? Domestic institutions have this stock on their radar and capital flows one way.
Boo Ya.
Most importantly, we have a great looking chart.

Real estate reversal pattern seems to be forming $REKAMEX:REK
Sell price target at $18.40 based off of a 38.2% Fibonacci retracement

Short DRN?Broke down out of upward trend
Retraced to .382
Trying to break below support
RSI declining
Z score trending toward zero
EFI<0, declining
Watching
