$TNX & short term yields breaking support levelsWhile the #fed reserve has made it clear they're not stopping rate increases yet, #bonds yields put a top in days ago. $TNX actually did it some time ago!
We noticed certain sectors, like insurance, began lowering premiums done time ago. Did they know something was start didn't?
Small community banks are getting crushed and if rates crater it may alleviate the balance sheets of those remaining.
Anyway, the fed tends to overdo everything they do. Many are calling recession or something much harsher. Time will tell but banks going busy is not a good sign.
Realestate

BRICS gain as West plunderBRICS nation are growing root in rapid speed. Mexico has joined BRICS recently and many are lining up.
China just mediated a diplomatic pact between Iran and Saudi Arabia, gaining more grounds in Middle East.
A new superpower bloc in the making. A potential new reserve currency that is backed by commodities such as gold is on the rise.
We are seeing majority of BRICS nations are purchasing gold at breakneck pace. They know the US Dollar hegemony that is backed by nothing, may one day lose its dominance.
As US banking sector continues to crater, soon it will spill over to the next most vulnerable industry, which is real estate. Housing market is extremely critical to the overall well-being of US economy.
With companies laying off employees, prices of necessities continue to rise and Jerome Powell continue raising rates, path down the road don't look too bright.
By Sifu Steve @ XeroAcademy

Real Estate Sector; A Very Bearish FractalJust like in the lead up to the 2008 the REITs have been going up with no sign of slowingh down whilst inside of an Ascending Broadenign Wedge/Channel and has on it's 4th attempt gone above the Supply Line Breifly only to very quickly come back down again and now it's cracked below botht the 21 and 55 Month EMAs; The last time it's done marked the beginning of an accelerated move down and the eventual Breakdown of the wedge where it then went for the measured move of the wedge which is the price where the wedge began; In this case that would be back down at $289.91
For more context as to how this dump started check the Idea in the Related Ideas Tab as that has a Weekly Timeframed Chart of the VNQ ETF that was showing Bearish Variables before the REIT's Decline Began.

Real Estate: Further Trouble Ahead until Bottom January 2025#ichimoku #realestate
Monthly Chart
1. Touched Top of Major Trend Line December 2021
2. Resistance at Top of Trend Line
3. Lower High/Lower Low Bear Channel
3. Ichimoku Death Cross
4. Kumo Cloud Flat
5. Target 45.13 January 2025
6. Ichimoku Time Theory Confluence - 9 Period + 26 period
Weekly Chart
1. Stochastic Death Cross

LANDSHARE HAS THE STRONGEST AND THE BEST POTENTIAL.This is my technical analysis for this great project called LANDSHARE where a real asset are tokenized specifically real estate.
The project offers an investment into the real estate " TOKENIZED ASSET " for only 50$ .
This project has a great potential to reach 600$ based on the technical analysis and on the other hand the fundamental analysis say it has the potential to reach 1000$ .
Also the crypto space may get involved in the real estate businesses where LANDSHARE will be the face of it.
The team behind LANDSHARE project are doing amazing things to improve the project and developing it in the right way.
Not financial advice.

However you slice it, real estate doesn’t look good.While it might not be the subprime/GFC “SELL” kind of situation, the real estate sector is undoubtedly facing headwinds.
With the most recent Fed’s preferred inflation measure, the Personal Consumption Expenditure (PCE) printing higher than consensus, maybe it’s about time we take the Fed’s hawkish commentary more seriously. To review, let us look at interest rate expectations from a month ago vs today. Market expectations are now pricing in three 25bps hikes instead of one, and more importantly no more rate cuts in the second half of 2023. This rise in rates expectation has notably resulted in sideways action for equities, while the dollar strengthens. What a difference a month makes!
Mostly importantly, it’s not hard to see how higher rates will translate into higher mortgage rates. This is bad news for home buyers as borrowing becomes more and more unaffordable. In fact, higher mortgage rates have continued to weigh on the minds of Fed officials as underscored by the following statements in the latest Fed minutes, including “Participants agreed that activity in the housing market had continued to weaken, largely reflecting the increase in mortgage rates over the past year.” and “Participants agreed that cumulative policy firming to date had reduced demand in the most interest-rate-sensitive sectors of the economy, particularly housing.”
Existing home sales are now at a 12-year low, surpassing the 2020 lows. Only 2 other periods post-GFC, saw a lower print, and it’s worth noting that mortgage rates during those periods were at the same level or lower.
Home prices have also started to turn over, ending a 12-year run higher. Lower prices could indicate tepid demand in the housing market, which we will watch closely over the next few prints.
And forward-looking indicators all seem to point towards contraction. With US Building permits and NAHB Housing Market Index slightly off the covid low, while the MBA Purchase Index close to the 7-year low.
It does seem like however, we slice it, real estate looks pretty ugly now. One way to express the bearish view on real estate could be to use the CME E-Mini Real Estate Select Sector Futures which tracks the S&P Real Estate Select Sector Index. Looking at the sector futures alongside the 30-year Mortgage rates shows us the effect of the rising rates on the real estate sector.
On the technical front, we see the sector future breaking the short-term support established since October 2022, while the longer-term trend seems to point downwards.
Given our view that rates have further to go, negative home prices and sentiment measures across the board, and a technical break lower, we see the potential for the sector future to trade lower. We set our stops at 196, a previous resistance level, and the take-profit level at 163, with each 0.05 increment in the index equal to 12.5 USD.
The charts above were generated using CME’s Real-Time data available on TradingView. Inspirante Trading Solutions is subscribed to both TradingView Premium and CME Real-time Market Data which allows us to identify trading set-ups in real-time and express our market opinions. If you have futures in your trading portfolio, you can check out on CME Group data plans available that suit your trading needs www.tradingview.com
Disclaimer:
The contents in this Idea are intended for information purpose only and do not constitute investment recommendation or advice. Nor are they used to promote any specific products or services. They serve as an integral part of a case study to demonstrate fundamental concepts in risk management under given market scenarios. A full version of the disclaimer is available in our profile description.
Reference:
www.cmegroup.com
www.federalreserve.gov

Present and On-Going Forecast Real Estate Market The formula that I worked on for weeks, finally I can put the puzzles together a chart of an ongoing real estate chart and what I provided is an economic formula that's used to adjust the median sales price of houses sold in the US for inflation and mortgage rates. Here's what each part of the formula means in more detail:
MSPUS: This variable represents the median sales price of houses sold in the United States. The median sales price is the price at which half the houses sold for more and half sold for less.
MORTGAGE30US: This variable represents the average 30-year fixed rate mortgage in the United States. A mortgage is a loan that people take out to buy a house, and the interest rate on the mortgage can affect the overall cost of the house over time.
USCPI: This variable represents the United States Consumer Price Index, which is a measure of inflation. Inflation is the rate at which the general level of prices for goods and services is rising, and it can affect the value of money over time.
The formula itself is a bit complicated, but it's essentially using these variables to adjust the median sales price of houses sold in the US for inflation and the impact of mortgage rates. Here's how the formula works:
1+MORTGAGE30US/100 calculates the interest rate on the mortgage, expressed as a decimal.
^0.08333 raises this interest rate to the power of 0.08333, which represents the monthly interest rate.
1+MORTGAGE30US/100)^0.08333-1 calculates the mortgage payment factor, which is the amount by which the median sales price of houses sold needs to be adjusted based on the mortgage interest rate.
1/(1+MORTGAGE30US/100)^0.08333 calculates the present value of the mortgage payments.
(1-(1/(1+MORTGAGE30US/100)^0.08333)^360) calculates the total value of all of these mortgage payments by taking the present value of each payment, summing them over the 360 months of the mortgage, and then subtracting that sum from 1.
USCPI*300 adjusts the value of the expression by the consumer price index multiplied by 300, which accounts for the effects of inflation over time.
MSPUS is then multiplied by the result of steps 3, 5, and 6 to calculate the adjusted median sales price of houses sold.
When you put it all together, the formula is a complex expression that takes into account mortgage rates, inflation, and a value in US dollars, and calculates a value that has been adjusted by these factors, By using this formula, you can get a more accurate picture of the real cost of buying a house over time, which can help them make more informed decisions about the housing market.
The formula that I worked on for weeks, finally I can put the puzzles together a chart of an ongoing real estate chart and what I provided is an economic formula that's used to adjust the median sales price of houses sold in the US for inflation and mortgage rates. Here's what each part of the formula means in more detail:
MSPUS: This variable represents the median sales price of houses sold in the United States. The median sales price is the price at which half the houses sold for more and half sold for less.
MORTGAGE30US: This variable represents the average 30-year fixed rate mortgage in the United States. A mortgage is a loan that people take out to buy a house, and the interest rate on the mortgage can affect the overall cost of the house over time.
USCPI: This variable represents the United States Consumer Price Index, which is a measure of inflation . Inflation is the rate at which the general level of prices for goods and services is rising, and it can affect the value of money over time.
The formula itself is a bit complicated, but it's essentially using these variables to adjust the median sales price of houses sold in the US for inflation and the impact of mortgage rates. Here's how the formula works:
1+MORTGAGE30US/100 calculates the interest rate on the mortgage, expressed as a decimal.
^0.08333 raises this interest rate to the power of 0.08333, which represents the monthly interest rate.
1+MORTGAGE30US/100)^0.08333-1 calculates the mortgage payment factor, which is the amount by which the median sales price of houses sold needs to be adjusted based on the mortgage interest rate.
1/(1+MORTGAGE30US/100)^0.08333 calculates the present value of the mortgage payments.
(1-(1/(1+MORTGAGE30US/100)^0.08333)^360) calculates the total value of all of these mortgage payments by taking the present value of each payment, summing them over the 360 months of the mortgage, and then subtracting that sum from 1.
USCPI*300 adjusts the value of the expression by the consumer price index multiplied by 300, which accounts for the effects of inflation over time.
MSPUS is then multiplied by the result of steps 3, 5, and 6 to calculate the adjusted median sales price of houses sold.
When you put it all together, the formula is a complex expression that takes into account mortgage rates, inflation , and a value in US dollars, and calculates a value that has been adjusted by these factors, By using this formula, you can get a more accurate picture of the real cost of buying a house over time, which can help them make more informed decisions about the housing market.

When to Buy Real Estate Investing in 2023This video is my strategic analysis for when I will be looking to buy my next real estate investment property. I use the Cash-Shiller Index, CPI, and charting techniques of mean reversion to create indicators I will follow in the years ahead as real estate trends downward following the rise in mortgage rates and fall in home prices.

Copper & Stocks DivergingCopper and S&P500 is making a divergence.
Could this mean that we are going to be seeing weakness creep into the real estate market with Lumber and copper falling recently?
SPY has tracked copper closely with the rise & fall in inflation and yields.
The most used commodity in the world should provide pivotal insights into the next turn in the market.
If we do enter disinflation/deflation that's typically not positive for equties despite the "soft landing" narrative.

$VNQ: At a buy zone...This could be a substantial bottom in $VNQ here, worth monitoring at the very least. I have no position here, but tracking thee main ETFs and top 30 market cap stocks at all times, as well as my own watchlist for my long term account, and my screening tool output. Sentiment has been quite bad, and we had a rapid worsening of financial conditions for home buyers, akin to that of 1982, which is a very dramatic move, affordability wise. Let's see how this evolves, I'm thinking bond yields and mortgage rates will likely start to come down hard from here onwards as well, so naturally, Real Estate will breathe some fresh air.
Cheers,
Ivan Labrie.

im forced to assume dumpsterfire in real estate still oncomparisons are telling us simply when more people are able to borrow money real estate does better. interest rate data from whale crew tells us as long as we climb this indication the risk gets worse for borrowers. as long as those go in the specified direction im looking at higher prices in this fund. all is normal as in everyone is doing fine, and still doesnt want to buy a home; snafu reit. housing market could recover i just want these metrics to go the opposite way before i call it a recovery.

SUNTECK REALTYHello and welcome to this analysis
In the monthly time frame it formed a Bearish Harmonic ABCD in JAN 2022 near 590 and since then has retraced 62% of its last leg.
In the weekly time frame it has formed a Bullish Harmonic Gartley around 315 suggesting the correction is most likely over.
It can be a good stock to accumulate between 330-370 for upside levels of 420-500-650. The view would be considered invalid below 285.
Good risk reward set up for medium to long term at the current level.
Happy Investing

US Real Estate in Massive BubblePrice of median US home as a multiple of median US household income. Biggest bubble in over 35 years!
Back to reality soon.

O for the winReal estate is not the same as it was a year ago, I like O for 2023 and look to make some gains going into Q1. LONG

lets be honest 🙅🙍 real estate is a dumpi think this ones pretty simple. we can get whatever kind of home price report feasible, and the result is technical daily continuation to the downside. this can go one of two ways; bad, and worse.

Multiple bullish patterns on DRVLong DRV = 3x Short Real Estate. To me looks primed and ready to go in the mid term to short term. DRV has been heading downwards in this ascending channel, and it has broken to the upside of the channel. Target of that one is around 66.77. Since breaking out of that pattern it has created two smaller bullish patterns, another ascending channel, and a bull flag with shorter term target of 57.77.
I am not a professional, there are many ways to interpret charts and signals, I am only sharing what I see. Thank you.

XLRE...Looking for a downside move on the real estate sector as its forming a rising wedge at the moment. While your at it follow my other account @dting5 I'll be posting there within the next month!

AX.UN will be a BUY under 8.60TSX:AX.UN has a NAV near CAD$19.
It has been viciously beaten down from its high.
It is now below is 0.5 fib from the Post-COVID bull run
I would personally wait to buy until it reaches the 0.618, and I would wait for confirmation of a reversal on the weekly chart.
I am personally more likely to purchase TSX:SRU.UN (SmartCenters) if Canadian RE starts to rally - it has a higher dividend and I am more familiar with them in general.
Disclosure: I own exactly 4 shares of this company. They were dripped from a larger position I owned earlier in the year but sold off. Yes, it pays me a CAD$0.20 monthly dividend. :D

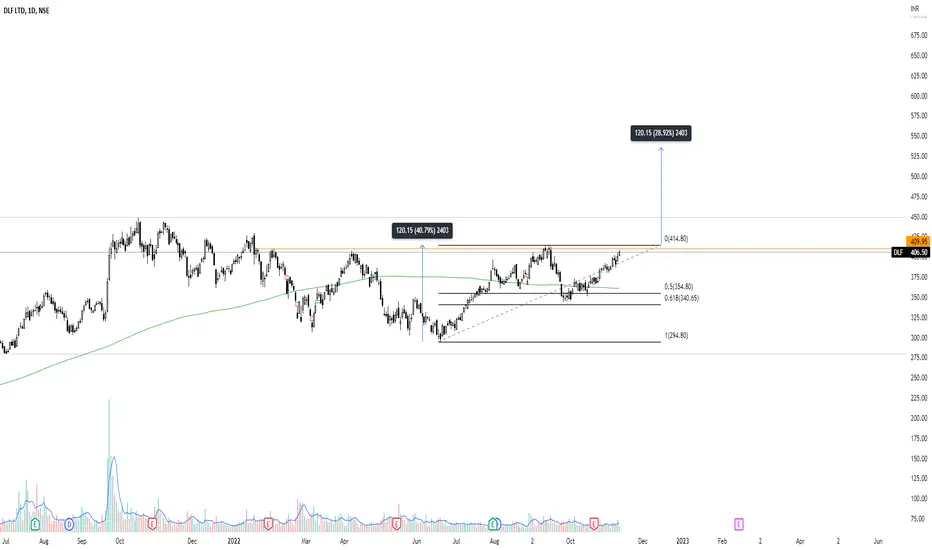
DLF gearing upWith positive news and overall indian real estate market gearing up, DLF is a good stock to invest or trade in. Was trading in range. Retraced to 0.618 fib level, and going for the major horizontal breakout. With Possible upside of 120 points. And also a cup handle kinda pattern.
Comparing Vanguard to BTC In both of these charts, you can see the correlation between 2 sectors that had if not IDENTICAL run ups due to their nature of being overbought and unregulated. (housing crisis of 08 vs Crypto crisis of 2022)
As of now we are still on our path downwards. The housing crisis took until Nov 2007 to late 2009 to start on the path of recovery. We know cryptocurrency is here to stay and the technological advances in our payments systems and the way we book keep and communicate will eventually if not be on blockchains.
Being that it took us 2 years to recover from the housing crash by implementing regs such as Dodd Frank and Fannie Mae, Freddie Mac, FHA, VA, ext. we have a much more investor friendly housing market. Crypto will soon be on that path with regulations. 2023 should be a ideal year to add to short positions or even build upon current ones. However 2024 it would be unsafe to carry that mentality. Regardless of who is president, this market sentiment will turn around and 2024 we can expect a reversal.

Real Estate Blue Chip SPG Simon Property“This is the paradox of public space: even if everyone knows an unpleasant fact, saying it in public changes everything. One of the first measures taken by the new Bolshevik government in 1918 was to make public the entire corpus of tsarist secret diplomacy, all the secret agreements, the secret clauses of public agreements etc. There too the target was the entire functioning of the state apparatuses of power.”
Simon Property Group seeks hyper-privatization of property, by which they can expand their capital and power network
Political outcomes will drive the future for this corporation. Midterms of 2022 will be a catalyst to the upside, but then 2024 presidential cycle holds the true power.

Long GEO Group niche REIT - cool ticker, book valueThe cliche about prison life is that I am actually integrated into it, ruined by it,
when my accommodation to it is so overwhelming that I can no longer stand or even imagine freedom, life outside prison, so that my release brings about a total psychic breakdown, or at least gives rise to a longing for the lost safety of prison life.
The actual dialectic of prison life, however, is somewhat more refined. Prison in effect destroys me, attains a total hold over me, precisely when I do not fully consent to the fact that I am in prison but maintain a kind of inner distance towards it,
stick to the illusion that "real life is elsewhere" and indulge all the time in daydreaming about life outside, about nice things that are waiting for me after my release or escape.
I thereby get caught in the vicious cycle of fantasy, so that when, eventually, I am released, the grotesque discord between fantasy and reality breaks me down.
The only true solution is therefore fully to accept the rules of prison life and then,
within the universe governed by these rules, to work out a way to beat them.
In short, inner distance and daydreaming about Life Elsewhere in effect enchain me to prison, whereas full acceptance of the fact that I am really there, bound by prison rules, opens up a space for true hope.
if there ever was such a thing as no-brainer easy money
this is it.
Republican sweep up in the November Primary is what the market will begin to front-run this summer
targets are potentially conservative.
Real Estate and Construction costs are already massively inflated, the market has not yet revalued the enterprises like GEO Group
short squeeze can happen here if the retail cohort swarms it

Daily Real Estate ETF [DRV]: 1-Month Forecast Fundamental Perspective:
In the past 50 days, the Direxion Daily Real Estate Bear 3X ETF (DRV) has experienced a surge of over 90%. As a leveraged ETF corresponding to the inverse of the Housing Market, this hardly comes as a surprise. In the past two weeks alone, the Federal Reserve raised benchmark interest rates by another 75 basis points in its ongoing struggle to curb inflation, and this has resulted in the mortgage interest rate increasing nearly 7%, adding even more pressure on potential homebuyers who are already struggling to navigate the historically high prices across the country. With 90% of mortgage holders having interest rates below 5%, not many are willing to part with a home, only to purchase a new one at an increased rate of 6.3%. Fueled mainly by this lack of supply, housing prices continue to rise in the short term, further amplifying the strain on the ever-growing housing bubble.
Technical Perspective:
From a technical standpoint, DRV is currently caught in a cross-current of two opposing channels, shown on the graph in yellow. The larger, ascending channel has been active for nearly a year, while the smaller, descending channel became active late last month when the price of DRV broke through the horizontal resistance of around $60. Examination using a custom, multi-timeframe WaveTrend indicator (coming soon) also indicates that a minor bearish divergence may playout in the second week of October, followed by a more significant bullish divergence that may push the price towards the upper portion of the ascending channel during the first few weeks of November.
Note:
The forecasted candles (shown in white) are based on lower timeframe fractals on the Heiken Ashi plot. They are intended to demonstrate one possibility of how price may interact with horizontal supports and channel boundaries in the coming month. The pivots in the projected price action have been retrofitted to be consistent with standard channel mechanics and Fibonacci spaced time intervals.
