Major Support Confluence, Tactical Rebound or Looming Flush?__________________________________________________________________________________
Technical Overview – Summary Points
__________________________________________________________________________________
Momentum: BTC is working a major daily support zone (102.6–103k USDT) with strong confluence across 1D, 12H, and 2H pivots. Technical rebound in play, but still no strong behavioral catalyst.
Supports / Resistances: Key support clusters at 102.3–103.3k (2H, 720min, daily pivots). Main resistances: 106.4k–110k.
Volume: Very high on 2H/1H near supports, hinting at possible washout/profit-taking. No buy climax identified.
Risk On / Risk Off Indicator: Strong bullish signal from 1D to 30min (neutral on 15min), while lower TFs remain under selling pressure.
Multi-TF Behavior (ISPD DIV): No excess or euphoria: market is waiting/compressed, caution is necessary in the short term.
__________________________________________________________________________________
Strategic Summary
__________________________________________________________________________________
Global Bias: Tactical bullish but cautious — confirmation on clean rebound needed to strengthen conviction.
Opportunities: Technical entries in the 102.6–103.3k zone with stops below 102k (aggressive) or 97.5k (defensive). Profit-taking zones at 106.4k/109.9k/110k.
Risk Areas: Invalidated below 97.5k (swing), potential flush down to 94k/88–89k. Heightened vigilance around macro releases.
Macro Catalysts: PMI prints (June 23), Fed on pause, increased geopolitical risks (latent volatility and cross-asset caution).
Action Plan: Prioritize active management: reduced position sizing, mechanical stops, and real-time bias adjustment based on volume and behavioral response.
__________________________________________________________________________________
Multi-Timeframe Analysis
__________________________________________________________________________________
1D–12H: Major supports (D Pivot Low 102626.8), structural uptrend, strong Risk On signal, but no behavioral/volume extremes.
6H–4H: Ongoing technical rebound, moderately high volume, support confluence, BUT short-term TF pressure remains.
2H–1H: Very high volume at support, possible local flush, but still no bullish behavioral confirmation—monitor for rapid volatility.
30min–15min: Tentative stabilization post-support absorption, no clear psychological excess, risk of further downside if rebound not confirmed; Risk On / Risk Off Indicator is neutral at 15min.
Summary: Bullish structural setup, but fragile micro dynamics—discipline and speed are key.
__________________________________________________________________________________
Fundamental & On-chain Overview
__________________________________________________________________________________
External factors: Fed on hold, US inflation slightly higher, robust economy, increased geopolitical risks (hot spots Israel–Iran, Ukraine–Russia). Latent risk-off sentiment but not yet materialized.
Calendar to watch: June 23, 09:45–10:00 UTC (US PMI & home sales).
On-chain: Low user activity, high institutional volumes, off-chain flow dominance, leverage high (mostly in stablecoins, limiting crypto-margined liquidation spirals), no euphoria or panic detected.
Risk/reward synthesis: Key technical buy zone 102.6–103.3k (stop < 102k/97.5k), targets 106.4k/109.9–110k. Below 97.5k: bearish bias, defensive risk management needed.
__________________________________________________________________________________
Final strategic synthesis
__________________________________________________________________________________
BTC remains "structurally strong but tactically fragile": major support confluence and bullish sectoral signal, but persistent micro selling pressure and macro/cross-asset uncertainty. Only entries on clear technical signals, mechanical stops and active risk management offer rational short-term setups in this volatile and compressed environment.
__________________________________________________________________________________
Rebound

TMGH Chart AnalysisTMG Holding trend has unfortunately reached a lower region than before. Despite its continuous projects' updates, it reached the mentioned support line 51.233, if it continued decreasing it might reach the support line 51.142 then 51. On the other side, this decrease isn't expected to be long. It is expected to rebound to reach the resistance line 51.386, then the resistance line at 51.631, then the resistance line 51.806

Rebound of EGX30EGX30 stock is currently in an increasing region. In case of falling, it's expected to break the support line 32,892.565 to reach then 2nd at 32,568.193 then the third at 32,543.242. In case of rising, it's expected to rebound at the resistance line of 32,934.151, to reach the 2nd at 32,875.931 then the 3rd at 32,850.979

TMGH Rebound ExpctationTMG Holding trend has reached its downward zone at the support line 51.142. In case of a rise, it is expected to breach the resistance line 51.233 and reach the resistance line at 51.625 points, then reach the third resistance line at 51.777 points. This upward direction is expected due to TMGH signs MoU For Development of New Large-Scale Mixed-Use Project In Iraq, which is expected to generate total sales of $17 Billion, and income of $1.5 Billion per annum upon project completion. In case of falling, it's expected to break the 1st support line at 50.961 points, then the second support line at 50.900, then the third line at 50.779.

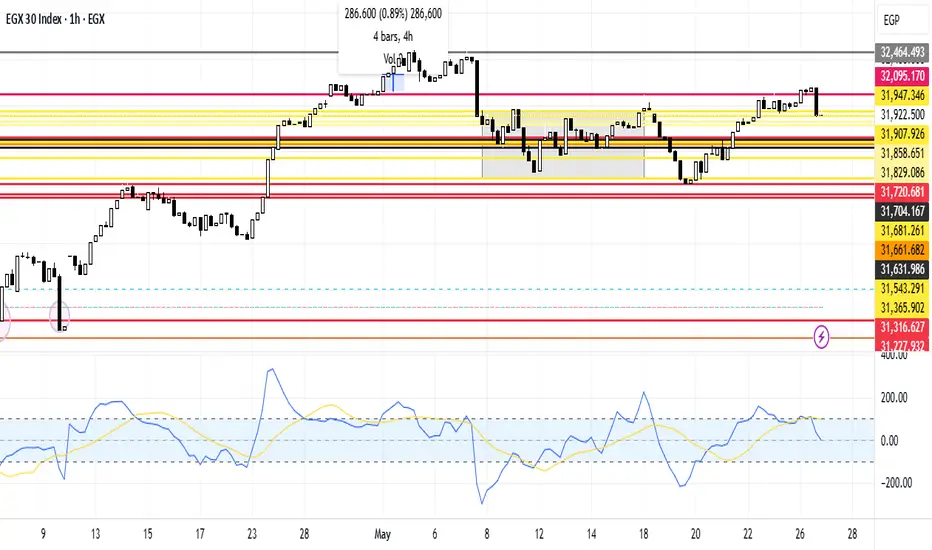
EGX30 Movement AnalysisEGX30 stock is currently in a higher region than before. Unfortunately it rebounded to the support line 31,907.926. In the case of continuing downward it's expected to reach the support line 31,858.651 then break the support line 31,829.086. In case of taking an upward trend, it is expected to breach the resistance line at 31,907.926 and then reach the resistance line at 31,947.346. And reach the third resistance line at 32,095.170 points.
SWDY Rebound AnalysisSWDY stock is trying to peak up, but unfortunately, it's rebounding back from the resistance line 80.081. In case of falling, it'll break the 1st support line 79.982 till reaching the 2nd support line 79.922, then the 3rd support line 79.832. In case of rising, it'll breach the 1st resistance line at 80.193, the 2nd resistance line at 80.344, and the 3rd resistance line at 80.464, which is more recommended due to its latest collaboration with Modon Holding to build an industrial zone for Egypt's Ras El Hekma on 10 Million square meters.

TMGH in a Lower RegionTMG Holding trend has reached its downward zone at the support line 50.779, but rebounded. In case of a rise, it is expected to breach the resistance line 51.021 and reach the resistance line at 51.142 points, then reach the third resistance line at 51.233 points. In case of falling, it's expected to break the 1st support line at 50.568 points, then the second support line at 50.477, then the third line at 50.386.

GBP-JPY Long From Rising Support! Buy!
Hello,Traders!
GBP-JPY is trading along
The rising support line
And the pair will soon hit
A trend-line from where we
Will be expecting a local
Bullish rebound and a
Further bullish move up
Buy!
Comment and subscribe to help us grow!
Check out other forecasts below too!
Disclosure: I am part of Trade Nation's Influencer program and receive a monthly fee for using their TradingView charts in my analysis.

Gold missing inverse relationship with DXYIn the earlier analysis, the expectation is for DXY to trade slightly lower to the round number level of 100.
With Gold's inverse relationship with the US Dollar, anticipating further downside for the DXY should mean that we expect to see some upside on XAUUSD.
However, the current price action on Gold is still signalling further downside.
The good thing is that the price is approaching the support area where the 3200 price level and the 61.8% Fibonacci retracement level align.
Look for a reaction in this area, for a possible rebound to the 3320 price level. Alternatively, if the support area is broken, there could be further downside to the 3000 price level.

NZD_USD REBOUND AHEAD|LONG|
✅NZD_USD is trading in an
Uptrend and the pair is making
A local correction in a way
Which also resembles a bullish
Wedge so after the retest of the
Horizontal support around 0.5917
A local bullish rebound
Is to be expected
LONG🚀
✅Like and subscribe to never miss a new idea!✅
Disclosure: I am part of Trade Nation's Influencer program and receive a monthly fee for using their TradingView charts in my analysis.

Euro can rebound from mirror line and start to move upHello traders, I want share with you my opinion about Euro. This chart illustrates how the price started trading within a range, where it initially corrected to the buyer zone and reached the mirror line. After that, it began to rise and, in a short time, moved up to the upper boundary of the range, which coincided with both the support level and the support area. Next, the price reversed and dropped back to the buyer zone, breaking through the mirror line. However, EUR soon resumed its movement within the range and eventually reached the upper boundary again. After consolidating near this area for a while, it made a slight correction before rebounding to the mirror line. Later, the Euro broke out of the range and eventually breached the mirror line, reaching the current support level, which aligned with the seller zone. Although it briefly rose after breaking this level, it recently reversed and fell back into the seller zone. At this point, the Euro might test the mirror line before starting to move upward, exiting the seller zone. Based on this, my TP is set at 1.1050. Please share this idea with your friends and click Boost 🚀

EUR_USD SUPPORT BELOW|LONG|
✅EUR_USD is trading in
A downtrend but the pair
Will soon hit a horizontal
Support of 1.0180 and
After the retest we will
Be expecting a local
Bullish rebound
LONG🚀
✅Like and subscribe to never miss a new idea!✅

EUR_JPY WILL GO UP|LONG|
✅EUR_JPY has been falling recently
And the pair seems locally oversold
So as the pair is approaching a horizontal support of 160.000
Price growth is to be expected
LONG🚀
✅Like and subscribe to never miss a new idea!✅

BloomZ Inc. Breaks Key Resistance, Signals Bullish MomentumThe share price of BloomZ Inc. (NASDAQ: BLMZ) surged by 7% in pre-market trading, signalling a potential breakout moment for the stock. This sharp move has propelled the price above the critical resistance level of $0.580, which had previously acted as a barrier to upward momentum.
Technical Indicators Favour Bullish Continuation
This breakout is accompanied by a move back above key moving averages, including the 50-day and 200-day MAs, reinforcing the bullish sentiment. These moving averages now serve as dynamic support levels, which can sustain further upward momentum.
The price action is also supported by positive market sentiment and a recent re-rating of BLMZ’s valuation.
Market participants are optimistic about the company’s prospects, contributing to increased trading volume and renewed investor interest. Broader market strength today has further amplified the stock's performance, creating an ideal backdrop for continued gains.
Next Levels to Watch
With the resistance at $0.580 decisively breached, traders are now eyeing the next significant levels around $0.620 and $0.650. Sustained trading above $0.580 could establish a strong base for further bullish activity, while a pullback to retest this level would provide an opportunity to confirm it as new support.

GBP-USD Long From Support! Buy!
Hello,Traders!
GBP-USD went down again
And is about to retest a
Horizontal support level
Of 1.2298 from where
A local bullish rebound
Is to be expected
Buy!
Comment and subscribe to help us grow!
Check out other forecasts below too!

Why NVDA was not a good candidate for Selling Short last weekBy Friday last week in NASDAQ:NVDA , Support of the Market created an inside day to reversal rebound white candle that engulfed, indicating that the minor drop down out of this trading range was just that: a minor slip of price to below fundamental levels.
Volume was well above average and Volume Oscillators--TSV, TTVA or Chaikin Osc--ticked up along with money inflows. Never assume that a break to the downside from a stable sideways trend is going to continue down. Inside days are no longer a "sure thing" for selling short.
Along with support from a bottom formation, the minor nudge before the black candle that dropped below the low of the sideways trend also was a factor in determining that NVDA was not going to run down. Sell short risk was exceedingly high based on these factors.

ETH/USD Potential Rebound from Bullish Trendline, Target $6,000This analysis focuses on COINBASE:ETHUSD price movement in the daily chart, highlighting a strong bullish trendline pattern. Currently, Ethereum's price is forming higher lows, indicating strength in the ongoing upward trend. The price is approaching the trendline, signaling a potential rebound that opens up bullish opportunities.
If the price successfully bounces off the trendline, the profit target is set at the psychological level in the range of $3,500 to $6,000. However, if the price breaks below the trendline, this bullish signal will be considered invalid. The stop loss is placed at the psychological level of $2,200 or if the price breaks below the trendline.

HelenP. I Euro can rise to resistance zone and then rebound downHi folks today I'm prepared for you Euro analytics. If we look at the chart we can see how the price entered to upward channel, where at once broke resistance 2 and dropped to the support line of the channel. Then price turned around and rose to resistance 2, broke it, and some time traded in the resistance zone, after which rebounded and grew to almost the resistance line of the channel. Euro continued to move up inside the upward channel until it reached the trend line, after which turned around and started to decline. In a short time, the price exited from the upward channel, and then it fell to resistance 2 and broke it. Some time traded below this level, EUR continued to move down and reached resistance 1, which coincided with one more resistance zone. Price some time traded in this area and later broke resistance 1 and fell below, but a not long time ago it rose to the trend line, and then rebounded down. So, in my mind, EURUSD will grow to a resistance zone and then continue to decline, breaking the trend line again. That's why I set my goal at 1.0840 points. If you like my analytics you may support me with your like/comment ❤️

$AMZN: Fast Rebounds Reveal Fundamental Support LevelThe new technologies that Amazon is embracing, including robots/robotics, and a brilliant CEO keep this huge company moving forward.
The HFT-driven gap down in August was massive but the rebound was fast. This isn't the first time the stock has moved right back up to its prior quarter's fundamental support range, aka Dark Pool Buy Zone.
Now, NASDAQ:AMZN is slightly above that range to challenge the July high. A stock to watch ahead of its earnings report October 24th.

Bitcoin can rebound from support zone and start to growHello traders, I want share with you my opinion about Bitcoin. By observing the chart, we can see that the price traded inside the range, where it at once rebounded from the buyer zone to the bottom part. After this, it turned around and rose back, and some time traded between 58000 level. Soon, the price broke this level, thereby exiting from the range and later entering the wedge, where it turned around from the resistance line and started to decline. In a short time, BTC declined to the buyer zone, where it reached the support line of the wedge. Then, the price started to grow from this line and rose from the buyer zone, but later it made a correction to the support line, after which turned around and continued to move up. Later BTC reached 62600 current support level, which coincided with the support zone and broke this level. Next, the price reached the resistance line of the wedge and then rebounded down. A not long time ago Bitcoin exited from the wedge and now trades inside the support zone. In my mind, BTC can decline to support zone and then start to move up. For this reason, I set my TP at 65500 points. Please share this idea with your friends and click Boost 🚀

HelenP. I Bitcoin can correct to support zone and then bounce upHi folks today I'm prepared for you Bitcoin analytics. Some time ago price declined to support 1, which coincided with the support zone, and soon broke this level and continued to fall. In a short time it declined to support 2, which coincided with one more support zone, some time traded near and later dropped to the trend line, breaking support 2 too. Next, the price started to grow near the trend line and quickly rose back to support 2, broke it, and then made correction. After this BTC rose almost to support 1, but then it turned around and declined below the trend line. Soon, the price rose back and continued to move up between the trend line and later reached support 1. Later BTC broke support 1 and even rose higher than the support zone and now continues to move up. For this case, I expect that BTCUSDT will correct to the support zone and then continue to move up, therefore I set my goal at 65000 points. If you like my analytics you may support me with your like/comment ❤️

HelenP. I Gold will rebound from trend line and continue move upHi folks today I'm prepared for you Gold analytics. A few moments ago price declined to the trend line and then started to move up near this line to support 2, which coincided with the support zone. When the price reached this level, it broke it and rose a little more, but soon turned around and dropped, breaking support 2 and the trend line too. Soon, Gold turned around and continued to move up next, and later it broke the trend line with support 2 one more time. Next, the price rose to support 1, which coincided with one more support zone, and some time traded near this level, after which turned around and made a correction movement below the trend line. Gold some time rose near below this line and later broke support 1, after which in a short time broke the trend line too. Just now, the price trades close to this line and I expect that XAUUSD will rebound from the trend line and continue to move up. For this reason, I set my goal at 2620 points. If you like my analytics you may support me with your like/comment ❤️

BOJ capitulates spectacularly Shinichi Uchida, Deputy Governor of the Bank of Japan (BOJ), says the bank won’t hike interest rates when markets are unstable, delivering a clear message on what traders need to do to prevent them doing so again: create volatility.
It’s an amazing statement, signalling the BOJ can and will be bullied by markets to avoid doing what is right for the Japanese economy. It’s an incredibly dovish admission, giving traders the green light to re-establish carry trades until the BOJ starts making noise about hiking rates again, or we see a major global economic downturn.
The Yen is tumbling understandably.
Adding to the dovish surprise, Uchida said the BOJ must maintain the degree of monetary easing for now and suggested the BOJ would not be behind the curve if it didn’t usher through rate hikes “at pace”.
It’s a capitulation of the grandest scale, undoubtedly orchestrated to restore calm to financial markets. It was only just over a week ago the BPOJ hiked more than expected and provided a hawkish outlook on the monetary policy outlook.
USD/JPY surges as carry trades established
USD/JPY has surged back above resistance at 146.50 on Uchida’s remarks, putting a potential retest of the January 2023 uptrend in play. The formation is also yet to be completed, but the three-candle pattern looks like a morning star, adding to confidence that we may have seen the cyclical bottom.
Should the price manage to remain above 146.50, consider buying with a stop below the level for protection. The intersection of the former uptrend and horizontal resistance at 148.80 is one potential trade target. Should that go, 149.70, 150.90 and 151.95 are the next upside levels of note.
The downtrend in RSI (14) has been broken, signalling downside momentum may be ebbing. It has yet to be confirmed by MACD but looks trustworthy given the speed of the rebound.
It’s not just bottoming patterns being seen in USD/JPY but also other pairs such as EUR/JPY and GBP/JPY.
-- Written by David Scutt
