✅NZD_USD TIME TO BUY|LONG🚀
✅NZD_USD has been falling recently
And the pair seems locally oversold
So as the pair is approaching a horizontal support
Price growth is to be expected
LONG🚀
✅Like and subscribe to never miss a new idea!✅
Rebound

GER 30 INDEX 1H moving versionsThis is a massive Bear market but we have Possible rebound before we Go to HELL :)
Im 100% sure that markets going to new much lower levels due to several problems in economy.
If we have a little lucky we will can open short position for longer time at a higher price for more profit.
This fall we can see nowadays not too much compared to other bear market in the past especially the 2008 crash . i beleve that the next crash in the near future reaching the same order of magnitude.
Good luck! :)

XAUUSD H4, HOLD ABOVE 1869.62 TO TARGET 1909.80 XAUUSD still has a room for rebound.
Break Above 1869.62, Bullish To 1909.80 & 1919.77.
Strong Resistance at 1998.39.
Anyway, Break Below 1828.38, Open The Way To Retest 1786.28.
Strong Support at 1786.28.
If Break 1786.28: Strong Bearish.


EURUSD H1, ABOVE 1.0591,TARGET 1.0674 -1.0806As expected,EURUSD hit 1.0635.
As I said in the previous idea, "So far, EURUSD still rejected from1.0340. While Above 1.0340, Potential Rebound to target 1.0635 & 1.0800."
For now, while Above 1.0591,EURUSD Still Bullish. Open The Way To Target 1.0674-1.0806 Area.
1.0459-1.0591 Neutral Area, Short Term Consolidation.
But, Below 1.0459, would Cancel EURUSD Short Term Bullish. Open The Way To Retest 1.0348.
Below 1.0348 Would be a Strong Bearish.

A long-overdue small-cap reboundThe small-cap Russell 2000 Index has been the underdog among the four major US indices since last year. Its post-pandemic rally halted in early 2021, and subsequently, it went sideways for more than a year without making new highs. Meanwhile, the tech darlings continued to go north all the way until the beginning of this year.
The first half of 2022 has been marked by widespread risk-off sentiment and a precipitous drop in the US equity market. After being down almost 30% from the high, we now find the Russell 2000 Index at significant technical support levels that we believe a meaningful rebound will likely ensue.
The Index has bounced right at the 50% Fibonacci retracement level near 1700. We also observed bullish RSI Divergence where price made lower lows, but RSI showed higher lows, suggesting the bearish momentum is waning and at the cusp of a reversal.
Entry at 1806, stop above 1680. Targets are 1880 and 2100.
Disclaimer:
The contents in this idea are intended for information purposes only and do not constitute investment recommendations or advice. Nor are they used to promote any specific products or services. They serve as an integral part of a case study to demonstrate fundamental concepts in risk management under given market scenarios.

First stopPlease be carefull, protect your money and your stuff.
So the first stop should to be to 48K and 52K
See you.

Time for DeFi to Rebound? This chart represents a basket of top DeFi projects. DeFi tokens are down bad from their bull run highs, but seem to be bouncing off an area of previous accumulation / support.
Will we get a bearish retest of the 200SMA? This would amount to a ~30% pump for DeFi.
Bitcoin or ETH could easily steal the show, but perhaps worth keeping an eye on!
happy trades,
CD

BTC Market Cap Crosses $970 BillionIn a rebound of more than 5% on Wednesday, BTC jumped above the market cap of $970 billion for the first time this week.
While the recent rally was not so significant, it gave the digital asset enough support to remain above $40,000.
After touching a high of almost $41,500 on Wednesday, BTC pulled back and dipped below $40,000 for a brief period.
However, Bitcoin increased gradually during the past 12 hours and is now trading near $40,800. In addition, BTC’s dominance stayed above 41% during the recent volatility.
“Bitcoin is currently seeing some buy pressure. We could see some short-term relief in the market over the coming days/weeks as protective positions unwind after today’s highly anticipated rate hike. However, I think Bitcoin and the crypto space are unlikely to gain significant traction in 2022.

LRCUSDT target price $1.8Bullish harmonic target $1.8
fibonacci 0.618
$1.6~$1.9 target.
Waiting for market rebounding is only thing that we can do.


GBP-USD Risky Long! Buy!
Hello,Traders!
GBP-USD fell sharply and got oversold
And we are now witnessing a recovery
With the price now being above the kye level again
From where I am expdecting further growth
But trading now is risky, please use 0.5% risk
Or even don't trade at all!
Buy!
Like, comment and subscribe to boost your trading!
See other ideas below too!

EURGBP With an Attempted Breakout The price action of the EURGBP is currently attempting a breakout above the upper limit of the descending channel on the reinvigorated bullish bias. The euro was bolstered today following the release of the better-than-expected German ifo business climate numbers for February.
The preceding downtrend, taking the form of a 1-5 Elliott impulse wave pattern, was completed at the major support level at 0.83120, which has already prompted several bullish rebounds recently.
If the breakout is successful, the price action would then test the 61.8 per cent Fibonacci retracement level at 0.83592. The next target would be the 38.2 per cent Fibonacci at 0.84048.

Bitcoin (BTC) Price Prediction: BTC/USD Holds above $39K SupportOn February 17, the bears succeeded in breaking below the $41,800 support as BTC price attempts a rebound. The breakdown signals the resumption of a downtrend. In retrospect, the largest cryptocurrency has been range-bound between $41,800 and $45,000 price levels. The bulls made several attempts but failed to break the $45,000 overhead resistance. Sellers have regained temporal control of prices as BTC/USD declines.
Resistance Levels: $70,000, $75,000, $80,000
Support Levels: $50,000, $45,000, $40,000

Bitcoin showing Bullish Divergence on weekly chart. On weekly charts BTC is sowing a bullish Divergence. Btc recently rebounded from over sold zone in RSI on daily charts. With this divergence, it seems that BTC could show a bullish rally with next target to be last swing high of $50900.
Keeping in mide Feds hawkish stance and current rally in Dollar index and 10 Year bond yield, this could be a false alert but im keeping my hopes up and believe that BTC could rally again in coming weeks.

run uptrend next target to fibo 38.2%now I provide the signal I have an idea with this symbolic pattern, after CCI run over -300% and MFI over sold lower than 20 and RSI touching 20 along year ago RSI lowest is 22 that make me analysis again in facebook for my friend to look that rebound pattern that BTC beginning comeback again and now I special looking at uptrend of fibonacci next target is 38.2% or around 46.7-47.5K for sure
let's take a nap and see what is happening

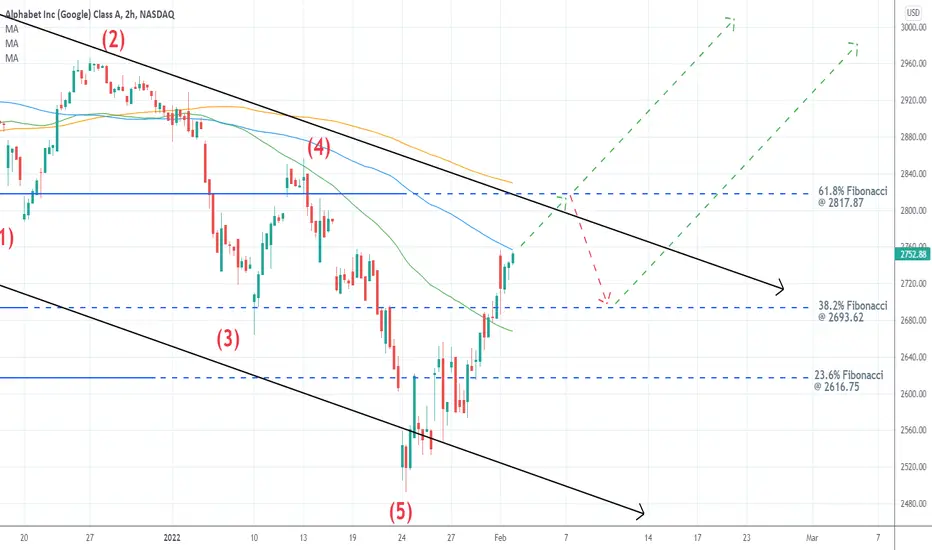
Breakout Play on GOOGL The share price of GOOGL rose in after-hours trading yesterday after Google's parent company Alphabet posted robust earnings for the fourth quarter. This entails the opportunity for catching the newly emerging uptrend.
The upswing commenced following the completion of the last 1-5 Elliott impulse wave pattern at the lower limit of the descending channel.
The price action is to test the 100-day MA (in blue) after today's open. If it manages to break it, the next target would be the 61.8 per cent Fibonacci retracement level at 2817.87, which is currently converging with the 200-day MA (in orange) and the upper limit of the channel; both factors making this last Fibonacci threshold a more significant barrier.
Conversely, a failed breakout could potentially lead to a dropdown to the 38.2 per cent Fibonacci at 2693.62, which is about to converge with the 50-day MA (in green). Traders could potentially use such a dropdown to buy the dip of the correction.
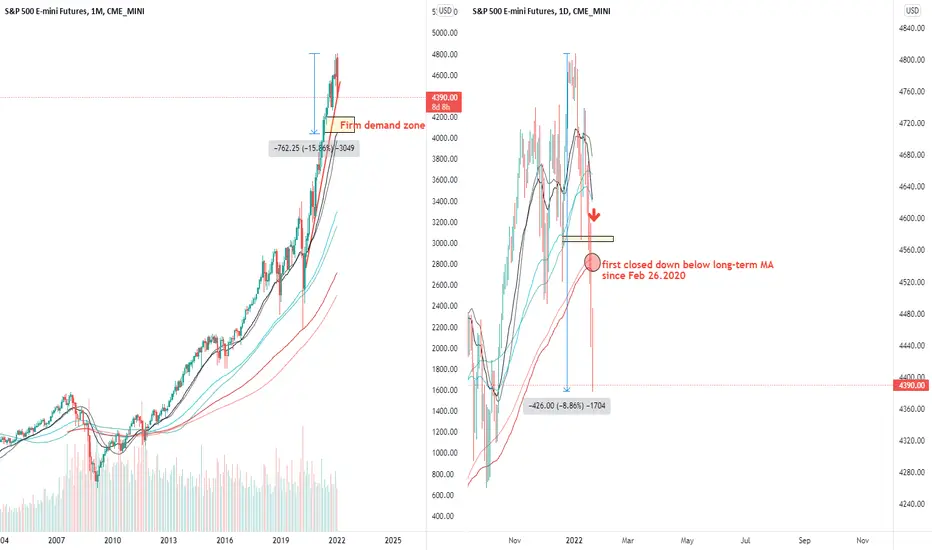
JICPT| How low can S&P go after the bloody week! Hello everyone. S&P tumbled with other indices last Friday. Frankly speaking, it was really ugly on the daily chart as it closed below the long-term MA for the first time since late Feb of last year.
How further down it might go?
On the monthly chart, it's still in the bullish uptrend. The firm demand zone from my view is around 4050-4200 . That's another 8-9% drop from the current level.
On the day chart, the six consecutive bearish candles may scare a lot of investors. From the recent high created on Jan. 4th, S&P fell by almost 9%. However, I'm a bit optimistic on the recovery in the next few days. Look at the angle it fell, it's free fall . The rising US 10y yield and possible 3-4 times of rate hike in 2022 is gradually pricing in.
The free fall is breakout, which is likely to be followed by downtrend channel or sideways range. I will pay attention to the demand zone on the monthly. I'm expecting price will react to the zone and bounce back. if not, price is likely to drop by another 20%, probably seeking support around 3300
What do you think? Give me a like if you're with me.
Simple New Max StrategyXLF is making new max today. There is an oportunity to take a long position today. In the next days the price should validate the new support, there we will have a second buy oportunity.
Back to basics strategy...

✅BITCOIN BUYING OPPORTUNITY|LONG🚀
✅BITCOIN is set to retest a
Strong support level below
After trading in a local downtrend from some time
Which makes a bullish rebound a likely scenario
With the target being a local target above
LONG🚀
✅Like and subscribe to never miss a new idea!✅

✅EUR_JPY BUYING OPPORTUNITY|LONG🚀
✅EUR_JPY is trading in a downtrend
But a strong support level is ahead
Thus I am expecting a rebound
And a move up towards the target
LONG🚀
✅Like and subscribe to never miss a new idea!✅

✅AUD_JPY WILL GO UP|LONG🚀
✅AUD_JPY is retesting the horizontal support
The support level is strong
So I am expecting a rebound
And and move up from the level
To retest higher supply areas
LONG🚀
✅Like and subscribe to never miss a new idea!✅

USOIL REBOUNCE READY FOR LONG🚀WTI Is falling from the recent highs
In a bearish correction to retest the strong key support level below.
Once the price hits the level expecting a strong rebound and a move up to retest a local resistance above
LONG🚀
There is broadening pattern and look like the price is going to test the bottom trendline and its Daily Support.
Resistance 1
84.5 - 85.5 supply area
Support 1
73.0 - 75.0 demand area
Support 2
61.5 - 62.5 demand area
Conclusion: Fluctuation between 77-85 is the most probable Scenario!
Risk Disclosure: Trading Foreign Exchange (Forex) and Contracts of Difference (CFD's) carries a high level of risk. By registering and signing up, any client affirms their understanding of their own personal accountability for all transactions performed within their account and recognizes the risks associated with trading on such markets and on such sites. Furthermore, one understands that the company carries zero influence over transactions, markets, and trading signals, therefore, cannot be held liable nor guarantee any profits or losses.
