Roku: Trend Change LookoutRoku has touched the crucial $340 support zone and seeing a trend change to upside with an inverse hammer followed by a green candle. Selling pressure is slowing down as well. In technical short term, potential upside from $340 to $370/380. Also Roku has just rebounded above swap at $345.58. With a good momentum, could see a nice push upside rebound with RSI rebounded above 30.
Rebound

CAD-JPY Will Go UP! Buy!
Hello,Traders!
CAD-JPY is retesting a horizontal support
And even though the pair is bearish
And the higher timeframes are drawing
Something suspiciously resembling H&S
I believe that a local rebound is likely
Especially given that SL here is so tight
Buy!
Like, comment and subscribe to boost your trading!
See other ideas below too!

ERG/USDT Start: ERGO reaches for the stars. 10x possible?Intro:
- ERGO rebounds from 7.5$ and goes for new ATH.
- Unfortunately ERGO on tradingview does not show the full history. We include the resistance levels around 10$, 12.5$ and 17$.
But since we believe in this coin and its potential we will start covering it here.
- ERGO worked together with Charles from Cardano and they talk highly from each other which is a good thing if you believe in ADA and it's approach.
- Guys please give me some feedback to improve my charts, analysis and commentaries.
Daily chart on the left hand side:
- Price looks a bit like a short bullflag that broke out today.
- Volume drop for three days with one up day today that does not say anything yet.
4h chart on the right hand side:
- We see a failed bullflag that did rebound around 7.5$.
- No RSI analysis yet.
Expectation:
- We expect a fully grown bullrun for ERGO which seems undervalued at the moment.
Basic rules:
- Never buy the top/ ATH
- Take profit as long as you can (also partial profit is profit)
- Use Stop/loss for leveraged positions
- If you are not experienced, don't leverage in the first place
Enjoy the ride and don't be too greedy.
If you like the content, please like, comment and give this channel a follow.
We would love it if you could share your thoughts in the comments.
Discussions are very welcome here.
Always do your own research and keep in mind that my charts and comments cannot be considered financial advice.
Cheers
ps.
Chart explanation:
Main lines:
- Green lines are tested support lines.
- Orange lines are resistance lines or, if we are above, possible support lines which were not tested yet.
- Cyan line is for volume trendline.
- White lines are Fibonacci retracement levels
Helplines:
- Purple lines are trendlines we take a look at.
- Blue, green, white and pink lines are 200MA, 100MA, 50MA and 20MA.
- Yellow lines are for visual help only.
Boxes:
- Either entry zone or support zone . Check the description.

Apple's Shares Likely to Spring Up Shortly Apple had one of its best quarters ever, posting record-breaking revenue growth. Even still, the share price fell by $3 on iPhone chip supply bottlenecks.
The correction is likely to bottom out at the 23.6 per cent Fibonacci retracement level, creating an opportunity for trend-continuation trading.
The market is likely to price in these concerns later today, allowing for sustained price appreciation afterwards. Bulls should consider going long only on the condition that the share price consolidates within the Pennant over the next several hours.

Tesla Shatters All EPS Expectations, Set to Climb Higher Yesterday, Tesla delivered its earnings data for Q2. The electric vehicle manufacturer beat all topline and bottom-line expectations, reporting a net income of more than $1 billion for the first time ever.
The share price is likely to rebound from the bottom of the ascending channel, as well as from the 200-day MA (in purple) and the 100-day MA (in blue), and test the psychologically significant resistance at 700.00.
If it manages to break the latter, the share price is then likely to head towards the 61.8 per cent Fibonacci retracement level.

Cup And Handle on the AUDUSD There is an opportunity to trade on a potential bullish rebound on the AUDUSD. That is, if the price action manages to break out above the Handle and the 50-day MA (in green).
If it then manages to penetrate above the 23.6 per cent Fibonacci retracement level, the upswing is likely to head towards the 38.2 per cent Fibonacci at 0.75186, next.
Keep in mind that the 100-day MA (in blue) is currently converging with the 23.6 per cent Fibonacci, which could initiate another bearish reversal.

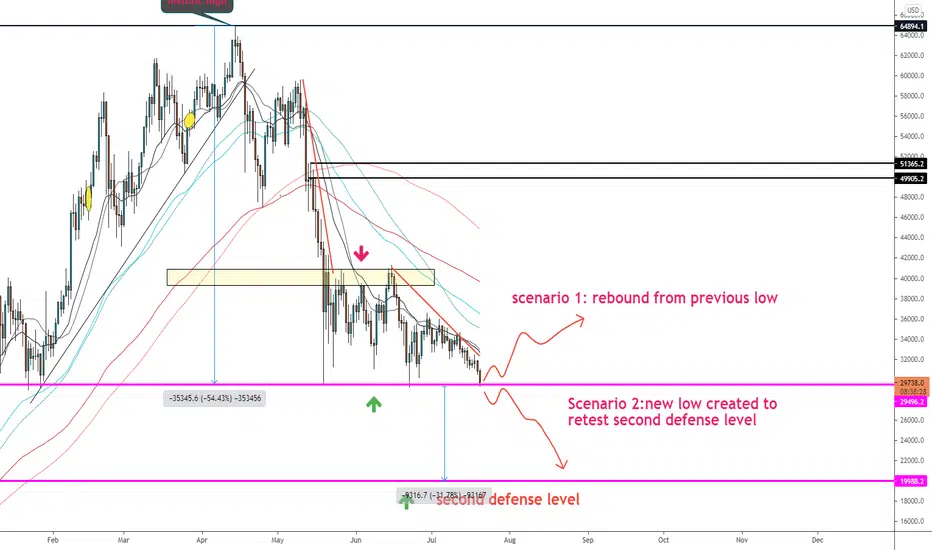
JICPT| BTC gotta make a choice of where to go! Hello Bitcoin traders. BTC has moved to previous low level of $29799. Now, it has to make the choice of where to go!
Scenario 1: buyers come in to push the price up to $34500.
Scenario 2: sellers take control to break the previous low and further down to second defense level of $20000.
Without positive influencers joining in, the second scenario is likely to happen. That will be another 30% drop from the current level.
I think buyers should pay special attention to risk management. Don't use high leverage. Once the breakout happen, it might go down significantly with a fast speed.
I would recommend buyers to buy BTC ETFs, e.g. GBTC
Give me a like if you're with me. Please trade safe and stay safe!
EUR-GBP Long From Support Again! Buy!
Hello,Traders!
EUR-GBP went up from the support the last time
Just as I predicted in my previous analysis on the pair
And now it is retesting the same level again
The support has shown its strength
Thus, a rebound to retest the falling resistance
Seems like a probable scenario
But as it was the case with the previous long
The trade is risky so wait for reversal signs
Buy!
Like, comment and subscribe to boost your trading!
See other ideas below too!

AUDUSD Develops an Inverted Head and Shoulders Pattern The price action consolidated above the 50-day MA (in green) and then broke out above the 23.6 per cent Fibonacci retracement level at 0.75508.
After the AUDUSD jumped past that crucial threshold, it also probed the 100-day MA (in blue). Presently, the bullish momentum appears to be waning just below the Distribution area (in red).
Notice that the 38.2 per cent Fibonacci at 0.76159 serves as a major resistance level. A potential reversal from this significant turning point could drive the price action back below the 23.6 per cent Fibonacci.
In turn, this could result in the establishment of an Inverted Head and Shoulders pattern, provided that the price action then rebounds from the Accumulation range (in green).

Watch Out for a Rebound on AUDCAD The AUDCAD established a Descending Wedge pattern, which in itself is demonstrative of a potential bullish rebound from its lower end. The likelihood of such a rebound taking place is bolstered by the fact that the Wedge appears to be bottoming out at the major support level at 0.92650.
Moreover, bullish pressure appears to be rising now that the price action has reached the lower end of the broader consolidation range, as underpinned by the Stochastic RSI indicator.
If the price manages to penetrate above the upper boundary of the Wedge, it is likely to then pull back before continuing to head higher. The first target is the 61.8 per cent Fibonacci retracement level at 0.93402.

USDCAD to Rebound and Continue Climbing The pair started developing a new Markup, as we forecasted last time (see link below). This happened after the price managed to break out above the Accumulation range, as postulated by the Wyckoff Method.
Due to the strengthening of the dollar, the price is likely to continue appreciating in the near future, though the correction could fall as low as the 61.8 per cent Fibonacci retracement level beforehand.
Several factors substantiate the expectations for future gains. The Bollinger Bands are tightening, which indicates diminished adverse volatility for the time being.
Meanwhile, the underlying bearish momentum is waning, as indicated by the MACD indicator. Finally, all of this happens as the price action is consolidating above the 38.2 per cent Fibonacci retracement level.

BTCUSD Look at this. Rebound imminent.Look at the 15min EMAs, they coincide perfectly with the trend line rebound as we get all the buy signals in one row for the very short term.

NIFTY CLIMAX RALLY TO 16000With all odds absorbed NIFTY will make its landmark figure 16000 on 10/06/21
It is a simple ABC correction with C=1.62*A
nifty will hold this level for day long so ,the TRADE PLAN is
take LONG today (09/06/21)for profiting long calls.
take SHORT tomorrow after 3.15 pm(10/06/21)and keep it for 3 days for 15450 levels

Textbook Range Play on the USDCAD The USDCAD has been behaving as per the expectations of the Wyckoff Cycle for quite a while now, which provides an insightful outlook on the likely behaviour of the price action in the near future.
Following the completion of the last Markdown, the pair went on to start establishing the current Accumulation range. Its existence is confirmed by the ADX indicator, which has been threading below the crucial 25-point benchmark since the 14th of May.
The development of a Hammer candle, which entails rising bullish pressure around the lower boundary of the Accumulation (at 1.20250), means that the price action has indeed bottomed out at the lower end of the Accumulation.
Hence, the price of the USDCAD is now ready to head towards the range's upper boundary at 1.21350. Before it can do so, however, the price would have to break out above the 50-day MA (in green) and the 100-day MA (in blue).

Triangle predicted dip to 30k-38k range in MARCH. What's next?Breakdown from ascending wedge, a bearish indicator, was flawlessly predicted in March. What's next? We are now in another triangle. This pattern is more of a tossup in terms of predicting breakout direction -- but since it's happened after a downward trend, it's also likely to break DOWN. Hate to break it to you the predictions of a dip back to 20k are realistic. That said, these are very easy and reliable patterns to follow. If we have a legitimate breakout to the good, we're headed back to the 50s. Come on, bulls -- do your thing!


Tesla Poised to Climb Towards $700.00The share price of Tesla seems poised to appreciate towards the psychologically significant resistance level at 700.00 over the med-term. The prominence of this level is derived from the fact that it is positioned remarkably close to the 23.6% Fibonacci retracement.
The latest upswing originated from the 38.2 per cent Fibonacci. The reinvigorated bullish commitment stems from the fact that this rebound also occurred from the 200-day MA (in orange). Not only that, but the price action also appears to be developing a Double Bottom pattern, which entails mounting bullish pressure.
However, market bulls should watch several key developments. First, the Stochastic RSI indicator indicates peaking buying pressure, which could potentially imply that the upswing may be interrupted soon. Moreover, the price action would also have difficulties in breaking out above the 50-day MA (in green) and the descending trend line (in red).

Dogecoin is Not Out of the Doghouse Just Yet Dogecoin is currently trading in a downtrend, and traders should not hope for an immediate rebound. The price is likely to fall to 0.2000 (major support) at least one more time before it starts consolidating.
Traders should only consider going long once there are clear indications that the price is ready to strengthen above this critical threshold. Those would involve consolidation of the kind represented on the chart - the establishment of higher lows.


Coinbase Levelling out set for rebound to $290It's a bit early to do a detiled analysis, yet there are a few signs that CoinBase is turning for the better.
We can see the converging triangle coming to a head.
Heiken Ashi Candles are signalling a turn for the better along with a stronger upward tangent, tightlyly held now with a marked reduction in Volume
shown on this chart.
Price should reach inflexion point by end of today, breaching the $270 mark and continuing toward $290 to $300 over the next 4 days as Volumes pick up in line with confidence of the rebound.

FED and BOJ's Policy Decisions to Jolt the USDJPY The Federal Reserve in the U.S. and the Bank of Japan have their April policy meetings taking place this week, which is likely to boost the underlying volatility currently observed on the USDJPY.
At present, the price action is contained within the boundaries of a Descending Wedge, which is a type of pattern that typically entails the likely continuation of bullish price action (after the price breaks out above the Wedge's upper boundary). It is also interesting to note that the price action is currently consolidating around the 38.2% Fibonacci retracement level.
The price action is likely to continue fluctuating between this pivotal support and the upper boundary of the Wedge in the near future before the eventual breakout takes place.

FLMBUSD 4H Rebound - LongThis was a private idea of mine from some days ago that I wasn't confident enough to post yet.
I looked at it today and the idea was quite close to what the current state of FLM is right now so here it is!
FLMBUSD currently consolidating after a push towards 1.25.
It is slowly declining towards 0.80. I'm feeling that it will rebound soon, reaching its previous ATH.
FLM is an interesting coin and can be seen as a solid investment long term.
It won't be the ultimate project in your portfolio, but can be an easy x2 on the long term. At the moment it is fairly undervalued and the project is
still developing a lot. Da Hongfei, the founder of NEO, is personally involved in the project and FLM is the main DeFi solution on the NEO blockchain.
Looking at similar projects we have:
ETH - UNISWAP (7% of market cap of ethereum)
BNB - PANCAKESWAP (4% of market cap of BNB)
NEO - FLM (2.8% of market cap of NEO)
QTUM - QISWAP
Let me know in the comments what you guys think! Am I right or wrong? Either is fine so I can re-evaluate my long position :)
