Strategies to Buy This Value Automobile StockFCAU has seen considerable improvement under its new management, and with the recent cleaning up of debt, they announced last month that they will be giving out dividends. FCAU has not paid a dividend since 2016, so this is incredible news for what I believe to be a very valuable stock to own in the next few years.
Despite positive earnings, FCAU has seen a tremendous drop. Historically, this is followed by a drop in sentiment and an eventual rebound. Though a "cup and handle" rebound attempt was seen, it was immediately followed by a descending triangle pattern, breaking out into new lows. The average RSI-26 on the 30min candles seems to be descending linearly to the 30 line, where it historically picks up again. This is suspected to take place between March 14th to March 16th 2019.
My suggestion is to pyramid in your buys once the latest low is tested and stop around a 5.5% low from the initial low after the earnings announcement. This gives you the following target buy points:
$14.34
$14.22
$14.13
$14.07
$14.01
$13.93
$13.80
There is, however, a possibility that the best time to buy will be sooner than later. This, I believe, is largely dependent upon the current overall market trends. The S&P and Nasdaq Composite Indexes have been shaky lately. If the overall market rises, we will see this stock recover much more quickly, since it's Beta is close to a 2. In which case, jump on anytime and ride that bull.
Rebound


BTC: Weird bullish wedge formingBTC is trying to postpone the pump as long as possible. Probably until all the people who are long fold, close their longs, go short. Then it starts pumping.
The high long short ratio probably kept BTC from rising sooner, I though that it would start climbing to 5k much sooner. But apparently it tries to really drag it
out as long as possible. However, it can fight the pump only for a limited amount of time. Re-visiting the logarithmic resistance line, is a must for bitcoin, it
really likes doing that stuff. Also weekly stoch RSI is pointing towards that, and the ultra low weekly RSI.
A short term rebound before the next leg down is needed!
If not, then I don't know bitcoin any more, honestly. If it just continues to decline down from here below 3k, this would be ultra weird.

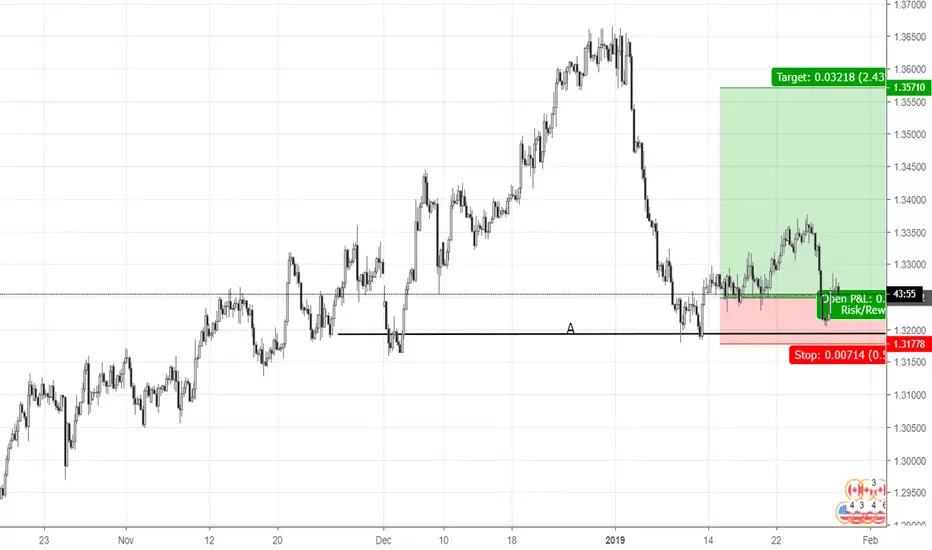
Rebound from the long term supportGot in as the rebound from the "A" support level.
1)Stop loss is under the recent lows and the "A" support level.
2)Profit target is around Dec consolidation after the up-move.

Rebound from the long term resistanceAttempt to catch the rebound from "A" resistance level.
1)Stop loss above the resistance.
2)Profit target is around Jan low.

Scalling in, rebound from the local resistanceAdding to the previous position in this pair; attempt to catch the rebound from the local resistance B.
1)Stop loss is above the local resistance B and the last up-swing.
2)Profit target is around Dec 18 lows.

Rebound on DGetting in the rebound from "A" level and the shooting star candle.
1)Stop loss above shooting star.
2)Profit target at Dec lows.

Rebound from the local price level, 2nd tryAfter being stopped out trying to reenter as the market seems like just made fake breakout.
1)Stop loss above the last upswing.
2)Profit target is at the recent downswing.

Rebound trade after the fake breakoutGetting in the rebound from the "A" price level.
1)Stop loss is above fake breakout.
2)Profit target is around January low.

Rebound from the recent resistanceGetting in the rebound from "A" resistance.
1)Stop loss is over last up-swing and the "A" resistance.
2)Profit target is around Dec 12 lows.

ALIBABA GROUP HOLDING (BABA): More Dips Before Reversal?Find Winning Trades In Seconds >> efcindicator.com (Special Discount)
The S1 support should hold probable dips and provide conditions for a rebound. MFI will be our guide to the ideal entry time.

Bullish Divergence for AAPL in TF 4HCan enter long if the price bullish and next target profit is at EMA50 in 4H

HPQ kicks off a short-term rebound hereMy quant model predicts
Profitability: it has a high probability(70%) to rebound at this level.
Worst Case: it could drop to $15.96
Money Management: Bet no more than 21% of capital
Suggested Strategy: long stock for 5 Days, wait and see

Attempt to catch the rebound from the upper band of the channel The range channel had been forming since Aug 2018. I attempted to short it as a rebound from the upper band ("A") of the channel. My stop loss was above the channel highs and my profit target was at the middle of the channel.
(posted post factum)

Trading Strategies Apple (NASDAQ:AAPL)Trading Strategies Apple (NASDAQ:AAPL)
Based on daily chart, the general outlook for short term AAPL is BEARISH.
1. This is because the price create lower low (L1-L4) and lower high (H1-H3) from first November 2018 until end of December 2018 .
The bearishness evedence can be supported as the price now is below 50-days EMA.
2. However notice that, there is bullish divergence between MACD histogram and the movement of the price plus crossover of stochastic below 80 (oversold area).
This is likelihood to technical rebound supported by Japanese Candlestick shows inverted hammer.
In addition, current price is located at the previous supports ; 22nd Sept 2017 and 9th Jan 2018.
This should has less sufficient selling pressure thus possible buying pressure increase that lead price rebound.
3. For short term trading strategies, trader can enter in LONG position when the price penetrate 10-days EMA and trendline T1.
If not, stand aside!
4. Target Profit for long position strategies is at $164.48.
The target is confluence with Fibonachi Retracement 23.6%. Suggestion stop loss is $154.21 with reward risk ratio 4:1.
Next target profit is $175.36 and suggested protective stop loss to protect profits from losses.
Any comments are most welcome!
Bukhari Razali
Technical Analyst
+6019-523 0131
www.tradingview.com
#TecnicalReportCMB
Disclaimer: Investments involve risks, including possible loss of principle and other losses. The author has positions in some of these instruments.The author shall not be responsible for any losses or lost profits resulting from investment decisions based on the use of the information contained herein.If investment and other professional advice are required, the services of a licensed professional person should be sought.

SPX crash and reboundIf SPX crashes to 100-Year-Bottom channel, it would probably rebound to the current channel.
Bullish case would be to rise up to the 10-year trend line.
Mild bear of another 15% drop would still result in SPX in current channel.

Bet on CP Support levelMy quant model predicts
Profitability: it has a high probability(66%) to rebound at this level.
Worst Case: it could drop to $166.88
Money Management: Bet no more than 33% of capital
Suggested Strategy: long stock for 5 Days, wait and see

Rebound from local supportGot in as a rebound from the support "A". My stop loss is under the support's lows, profit target is around recent market structure highs.


When to buy the dipSo, it seems that the bullmarket continuation scenario is getting more and more unlikely by the day. This scenario would have brought us to 100K sometime this year.
However, due to the continued weakness of bitcoin, a bearmarket seems much more likely :(
But how can you trade a bearmarket? Well, it seems that one has to wait for the right buying opportunity, when a dip occurs, which goes significantly below the weekly bollinger band.
Historically, in the 2014-2015 bearmarket, every time btc dumped strongly below the lower weekly bollinger band, a very strong bounce took place, about 50-100% bounce, every single time.
So, trading this market is pretty simple: wait till it dumps below weekly bband, buy, sell at the bounce, after 30-50% rebound, to be on the safe side.
Rinse, repeat. Wait for the next dump.
And then, in 2019, the low will be reached at some point, and one can start buying good old cheap coins at around 2K :)
Because the next bullrun WILL come, starting in 2020 with the halving.
The chances for the continuation of the bullmarket this year, are not zero however. They are small, but this scenario is also not completely off the table.

Long term supportEntry is based upon long-term support "A". Stop loss is under "A" low. Profit target is around the December 4 highs.

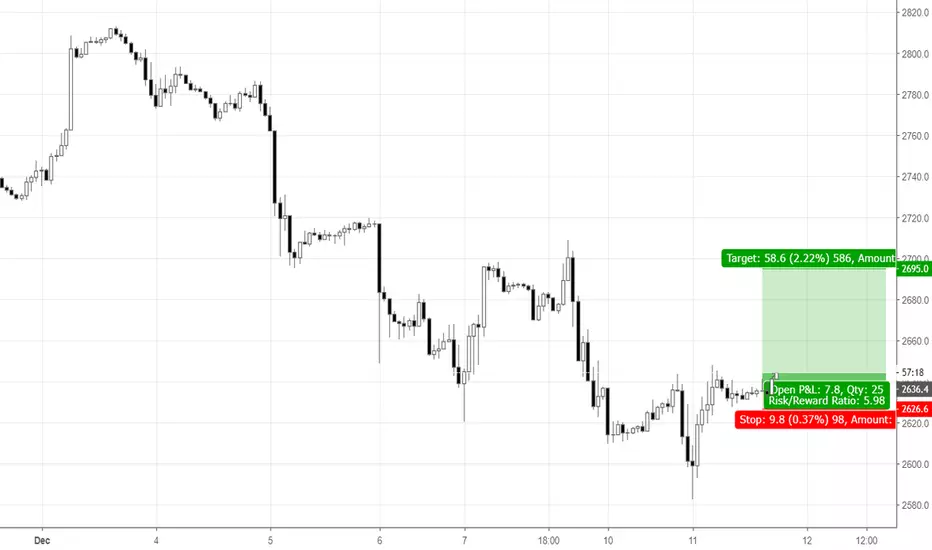
Reversal/rebound with the strong signal on DailyRebound from ~2630, with the long tail candle confirmation on Daily chart and local reversal pattern on H1-H15. Stop loss under local lows, Profit target is around December 7 highs.