19/05/2017 NASDAQ AnalysisPrice has rebounded for the second time in the level of support generating a pattern of double bottom.
Rebound


16/05/2017 USD/CHF AnalysisThe price has reached the support level again, starting to generate a possible lateral channel. Wait for a rebound or break from this level.


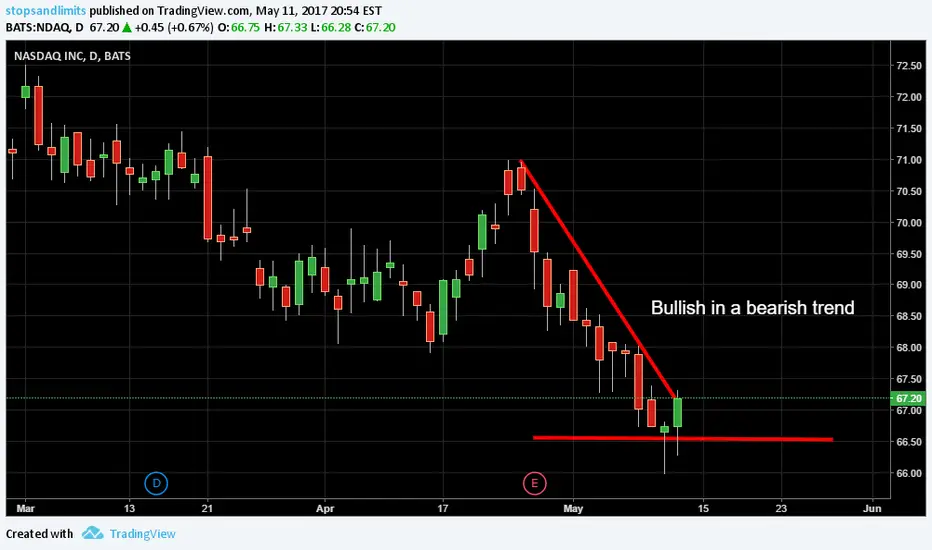
11/05/2017 NASDAQ AnalysisThere is an increase in price for two consecutive days, after a strong bearish trend. Possible reactivation of the bearish movement, but be pending a turn in the trend due to a rebound in a new level of support.
11/05/2017 S&P500 AnalysisPrice rebounds again in the resistance, after several days in which it tried to break it.

10/05/2017 USD/CHF AnalysisPrice has had strong bullish days, which reached a level of resistance, but a candle of indecision signals a possible bearish rebound in this level.

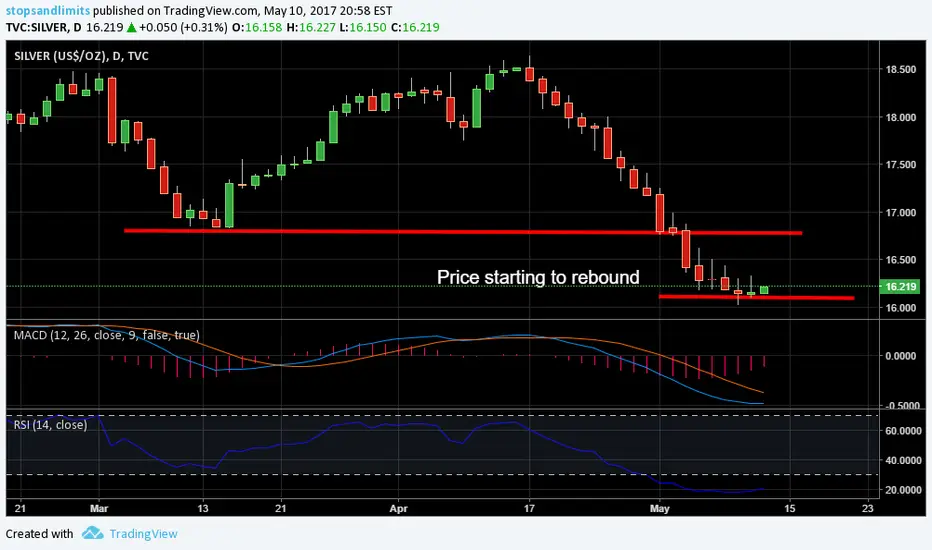
10/05/2017 SILVER AnalysisPrice remains lateral, but begins to show signs of rebound on the level marked.
8/05/2017 USD/CHF AnalysisPrice has rebounded in the marked support, you can expect a backward or lateral trend.

5/05/2017 S&P500 AnalysisPrice performs a new test of marked resistance. Watch out for a possible rebound or break.

4/05/2017 USDCHF AnalysisPrice has remained bearish, apparently starting to produce a possible rebound in the marked support level.

3/05/2017 GE analysisThere was a strong rebound of the price with a big bull candle that recovered a good part of the fall of the previous days, obtaining in this way that the price approaches again to the support that broke.

2/05/2017 USOIL analysisPrice has kept a downward trend, approaching levels that occurred at the end of March. Watch for a rebound, without ruling out a possible break of this level.

1/05/2017 USD/JPY AnalysisPrice reaches a level where there is an apparent local resistance, expect a possible rebound in this level, but you should be aware of a break.

USDCHF rebound suggests further choppy sideways trading The pair went through a mini roller-coaster Wed's session. Price dipped to 0.9930 in Europe b4 rebounding to session highs of 0.99 68 in NY but only to fall to 0.9929 after announcement of Trump's tax plan.
. Looking at the daily chart, despite dlr's resumption of MT fall fm 2016 6-year peak at 1.0344 after breaking Jan's low at 0.9862 to a 4-month bottom at 0.9814 in Mar, subsequent rise due to broad-based usd rally to as high as 1.0108 in Apr suggests said 3-legged decline has ended as this level was also accompanied by 'bullish convergences' on the daily oscillators. Having said that, dlr's decline to 0.9863

25/03/2017 S&P500 technical analysisThe price has increased rapidly these days, including gaps in that rise, after a clear double bottom at 2325. This has caused the price to approach a resistance that is close to 2400, which being a round number, psychologically influences as the maximum level. Waiting for a rebound in the resistance, may be most likely, but be very pending to break if the rapid rise continues.

USDJPY Short Setup off RetraceUJ seems to be rebounding from the top of bearish channel.
SL set at resistence above 109.8
first TP set at cross of centre line

$DASH - make or break$DASH on the daily chart is making a nice set-up for the possible rebound from the current lows:
- the price reached the edge of the bullish Ichimoku cloud (Lead 2);
- Lagging Span (aka Chikou) hits the Base Line (aka Kijun-sen)
They could provide the support for the price & thus a little rally for us :) hopefully
Let's keep an eye and watch for the entry signal on the shorter time frame charts

Support setup-AUDUSDPrice hitted daily support level. We can expect some rebound in this pair till bearish hourly trend. Then, if price breaks it, we can project it till 61,8 of fibonacci retracement.

Has the Dow Recovered?To me this is pretty simple, the Dow was provided with support by the 50 Moving Average and appreciating, but the Coppock curve is still negative so I would wait till the 20,700 make to buy. Also the ADX Green Line has finally crossed over representing a new trend change. So I would buy until the Trendline resistance.

Possible euro reboundEuro is testing levels, which in the past have concentrated amounts. The volume is not very large, and that is alarming. You can consider buying, but with a small stop loss


Long Options VRX Strrike at $15 I am buying a basic price action trade to cover the move from 15 to 17.60 i give it 2 and a half weeks .. so exp. week 1 feb17
