Nasdaq Bank Index 2025 Edition — Let's Make Sh#t Great Again.President Donald Trump's aggressive tariff policies, we at @PandorraResearch Team characterize as a term "Tariff Bazooka", have significantly destabilized the Nasdaq Bank Index NASDAQ:BANK , reflecting broader financial sector vulnerabilities and investor anxiety.
These tariffs, including a 25% levy on imports from Canada and Mexico, a 20% duty on Chinese goods, and proposed reciprocal tariffs, — have triggered cascading multi effects on banking stocks through several paths.
Market Volatility and Investor Flight
The Nasdaq Bank Index, which tracks major U.S. financial institutions, has been disproportionately impacted by tariff-driven uncertainty:
Sharp Equity Declines. Since Trump announced reciprocal tariffs in February 2025, the Nasdaq Composite NASDAQ:IXIC dropped over 10% from its December 2024 peak, erasing $1 trillion in tech-sector value. Banking stocks, sensitive to macroeconomic shifts, mirrored this downturn as investors fled equities for safer assets.
Risk-Off Sentiment. Bonds rallied as tariffs sparked fears of stagflation—a combination of stagnant growth and rising inflation—prompting a 30-basis-point drop in 10-year Treasury yields. This flight to safety squeezed bank profitability, as narrower yield curves reduce net interest margins.
Economic Contagion Mechanisms
Interest Rate Pressures.
Tariffs have raised input costs for businesses, contributing to inflationary pressures. The Federal Reserve now faces a dilemma: tolerate higher inflation or hike rates to curb it. Either scenario harms banks. Elevated rates could suppress loan demand and increase default risks, while delayed rate cuts prolong financial tightening.
Trade Retaliation and Sectoral Risks.
Canada, Mexico, and China have retaliated with tariffs on $155 billion (Canada) and unspecified billions (China, Mexico) of U.S. goods. For banks, this raises exposure to sectors like agriculture, manufacturing, and automotive - industries heavily reliant on cross-border trade. Loan defaults could surge if protected industries fail to offset higher costs.
Global Financial System Strain.
Trump’s tariffs risk fragmenting the rules-based trading system, undermining the stability that banks depend on for international transactions. The EU and other regions may retaliate by restricting U.S. financial services, directly impacting revenue streams for Wall Street firms.
Sector-Specific Impacts
Tech-Finance Nexus. Many Nasdaq-listed banks have significant exposure to tech firms, which face disrupted supply chains due to tariffs on Chinese components. This dual pressure — higher operational costs for clients and reduced tech-sector valuations — weakens banks’ asset quality.
Consumer Credit Risks. Tariffs on everyday goods (e.g., 25% on Mexican produce, 10% on Canadian energy) could elevate household expenses, straining consumer creditworthiness and increasing delinquency rates for retail banks.
Projected Outcomes
Economists estimate Trump’s tariffs could reduce U.S. GDP growth by 1.5 percentage points in 2025, with a stagflationary shock amplifying equity sell-offs. For the Nasdaq Bank Index, this implies prolonged volatility, compressed earnings, and potential credit rating downgrades as macroeconomic headwinds intensify.
Technical challenge
The main technical graph of Nasdaq Bank Index NASDAQ:BANK indicates on further Bearish trend in development, since major supports (nearly 5-month flat bottom and 52-weeks SMA) have been recently broken.
Conclusion
In conclusion, Trump’s tariff strategy has acted as a destabilizing force for financial markets, with the Nasdaq Bank Index serving as a barometer for sector-wide risks. By exacerbating economic uncertainty, inflation, and trade fragmentation, these policies have eroded investor confidence and heightened systemic vulnerabilities in the banking sector.
--
Best 'sh#t hits the fan' wishes,
@PandorraResearch Team 😎
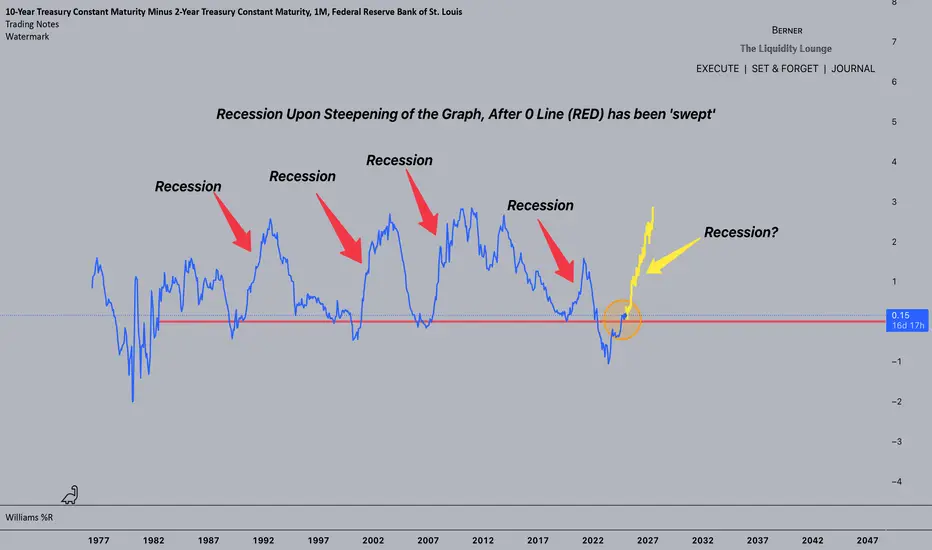
Reccesion

Global Recession A recession is already coded in the algo, time will prove this correct.
I'm not a 'bearmaxi' or 'doomposter' i'm a realist. If you struggle to believe my theories, come back to the chart in 1-2 years and ponder how you missed it.
Stay Safe.
- Berner
2020s recession I just feel like this will happen.️
Gamestop may be a part of the reason why it can happen this soon.
Best time to close the position would likely be a "reverse" golden cross on on the weekly.

$DXY -Ballads of the Dollar *W (11 Consecutive Green Weeks) Its time for a Dollar Story !
(previous lin echart idea 100-105 Range; before & after to the current spot)
The Dollar Index ( TVC:DXY ) has managed to print 11 Consecutive Green Weekly Candlesticks,
rallying up as much as 8 % from its July/2023 99.580 Low.
A low violating all Technical aspects, which got us into a Short Idea but not
for long before changing bias
(idea's live chart)
TVC:DXY tried to close in Green its 12 Consecutive Candlestick Print, but failed to do so.
However,
during this up-rally time of Dirty Mighty TVC:DXY for the past 11 Weeks,
heavy negatively correlated assets like $EUR/USD and other major FX pair got
slapped on the face mercilessly,
as well so did the US Major Financial Markets and other Indexes and Equities,
but when comparing them with the Fiat Currencies market,
their blood shed was less.
Is about time for The Dollar Index ( TVC:DXY ) to cool down for a while and correct ?
Fundamentally no,
as fear and troubles looms for a US Recession being just around the corner.
Technically (TA) speaking yes,
it is time for a brief correction,
would be totally fine for someone looking in to longing the Financial Markets or
exchanging their Fiat Dollars for other Major Fiat Currencies.
We can see TVC:DXY on line chart having broken the Range's Ceiling of 100-105,
as well retesting it (so far).
Holding it as Support or finding itself below again facing it as Resistance
shall be proven on upcoming week(s)

Decoding "THE GREAT DEPRESSION" !!! - #DJIThe great depression VS today's market structure!
- trying to find synergies between both timeline's
The Stock Market Boom and Crash of 1926-1933: An Applied Time Series Investigation
I found this interesting how it aligns with today's market sentiment..
chgate.net/publication/314247517_The_Stock_Market_Boom_and_Crash_of_1926-1933_An_Applied_Time_Series_Investigation]https://www.researchgate.net/publication/314247517_The_Stock_Market_Boom_and_Crash_of_1926-1933_An_Applied_Time_Series_Investigation
Companys are in the mist of adopting innovative technology, from blockchain technology to artificial intelligence.
Hyper inflation begun in 1924 lasting until 1929 until eventually the DJI collapsed 89%.
The catalyst to inflation - Hyper inflation. over expanding the currency supply.
here's an article of the Dawes plan which would of contributed to hyper inflation.
www.bbc.co.uk
Todays market structure and sentiment.. DJI
This show's the DJI coming to a similar % rally we saw during the great depression...
Also signalling a top target for maximum Fibonacci levels, combined with bull flag TP target price..
Pretty scary chart to say the least!!..
But highlighting potential scenario's..
Still a good chance we see a shorter correction before continuing into a hyper inflation period.
*Fiat currency - has lost a significant amount of value, from - covid stimulus/aid too Russia/Ukraine now Israel/Hamas. Central banks over expanding the currency supply.
The chart's and timeline's match... but The great depression happened in much shorter succession.
history often rhymes!
- my thesis the great depression is delayed - hyper inflation is yet to come... with that risk on asset's will rise!
WHY?
The debt ceiling was raised to 35 Trillion dollars until 2025 which insinuates reserve liquidity to recover failing market's - banks and possible real estate with downward pressure on individual companies and business's.
countries can't withstand high interest rate's due their current Debt .. currently economy's are expected to retract.
Sentiment
The US changed the definition of a recession so many are still un- aware that were currently in a recession.
talks of just missing one! - which I find pretty amusing!
Central banks are back tracking on high interest rates for longer, M2 money supply is contracting to the lowest level since 1960.
Now expected 6 rate cuts during 2024!
were currently in a speculation rally based off liquidity returning and the fast adoption of technology which is currently propping up the DJI.
Likely we see a 30-50% correction for the DJI, But for the reason's above we could see a shorter correction. which would align with the great depression!
Let me know your thought's in the comments below.

RELATIVE HOUSE PRICE INDEXMeasures how expensive or cheap housing is relative to wages.
-Base 100 in 1975
-Volatility clean
-In USD

EUR/USD - Resistances to Observe- With Europe entering in to Recession as a cause of
two consecutive negative quarters,
a positive Price Action is a merely a relief rally that will be short lived..
Golden Zone is most definetely reachable taking into consideration
the negative Macro-Economics events for Europe .
Patience is a virtue .
TRADE SAFE
*** NOTE that this is not Financial Advice !
Please do your own research and consult your Financial Advisor
before partaking in any trading activity based solely on this idea

CONSOLIDATION NEARING ITS END!The SP500 is in long consolidation and it looks like it is near to its end.
I am considering two scenarios:
1. After debt ceiling deal – when they increase debt limit – the price will break up as a bull trap and will bounce from the next resistance.
It will fuel the price to push to the targets – near pandemic bottoms.
2. The price, after the deal, will do correction of last decline and will continue to drop till meet the targets.

BTC TO 100k or 3k “fearful when others are greedy, and greedy when others are fearful.
Warren Buffet;
what do you think
comment bellow

recession risk indicator at thresholdthis is the FED measure of recession risk, watch this peaking then buy risk assets with both hands
this indicator doesnt lead by much, so if it flashes usually stocks crash immediatly

Gold vs RecessionGold is a chemical element with the symbol Au (from Latin: aurum) and atomic number 79. This makes it one of the higher atomic number elements that occur naturally. It is a bright, slightly orange-yellow, dense, soft, malleable, and ductile metal in a pure form. Chemically, gold is a transition metal and a group 11 element. It is one of the least reactive chemical elements and is solid under standard conditions. Gold often occurs in free elemental (native state), as nuggets or grains, in rocks, veins, and alluvial deposits. It occurs in a solid solution series with the native element silver (as electrum), naturally alloyed with other metals like copper and palladium, and mineral inclusions such as within pyrite. Less commonly, it occurs in minerals as gold compounds, often with tellurium (gold tellurides).
Gold is resistant to most acids, though it does dissolve in aqua regia (a mixture of nitric acid and hydrochloric acid), forming a soluble tetrachloroaurate anion. Gold is insoluble in nitric acid alone, which dissolves silver and base metals, a property long used to refine gold and confirm the presence of gold in metallic substances, giving rise to the term 'acid test'. Gold dissolves in alkaline solutions of cyanide, which are used in mining and electroplating. Gold also dissolves in mercury, forming amalgam alloys, and as the gold acts simply as a solute, this is not a chemical reaction.
A relatively rare element, gold is a precious metal that has been used for coinage, jewelry, and other arts throughout recorded history. In the past, a gold standard was often implemented as a monetary policy. Gold coins ceased to be minted as a circulating currency in the 1930s, and the world gold standard was abandoned for a fiat currency system after the Nixon shock measures of 1971.
In 2020, the world's largest gold producer was China, followed by Russia and Australia. A total of around 201,296 tonnes of gold exists above ground, as of 2020. This is equal to a cube with each side measuring roughly 21.7 meters (71 ft). The world consumption of new gold produced is about 50% in jewelry, 40% in investments and 10% in industry. Gold's high malleability, ductility, resistance to corrosion and most other chemical reactions, and conductivity of electricity have led to its continued use in corrosion-resistant electrical connectors in all types of computerized devices (its chief industrial use). Gold is also used in infrared shielding, production of colored glass, gold leafing, and tooth restoration. Certain gold salts are still used as anti-inflammatories in medicine.

DGSTACC: MACRO ANALYSIS OF QQQ / PENNANT FORMATIONIn the chart above I have provided a simple analysis on what can be considered for when it comes to the overall market.
1. Pennant Formation is provided by taking higher lows and lower highs with a point of convergence.
2. If followed through Pennant path can force price action to previously seen pre-covid times.
3. This would in fact validate a completion of GOLDMAN SACHS 340 market bottom prediction for SPY if QQQ is to fall to 240.
Note: This Macro chart will be used for reference and complete a more micro analysis of QQQ.

$NQ - What an interesting area!$NQ - What an interesting area!
We are at key support, lets see if these levels hold - if they don't as recession fears grow...I'd expect it to go towards the next support.
Enjoy,
Trade Journal

BTC short term potentialBTC has collapsed after FTX/Alameda scandal.
If some other major exchanges prove to be illiquid we can expect an easy 13K or even 9-10K.
Happy hunting

$GBP - How low can we go?$GBP - How low can we go?
Tacking back to yrs of data, perhaps we go ahead to George Soros area of chart and going back to 84-87 areas of price action. Interesting times, I think 1.10 could be achievable as we are in recession, fundamentally very weak outlook for gbp and you got dollar king rising further as hikes remain on the table till end of yr for US.
Interesting times, for longer term this brings great opportunities of investing.
TJ

Update DAX; Tangible effects of romance.The DAX is moving according to my previous analysis for now.
After touching the cloud on W1 and closing under the KIJUN in June, it is slowly, but steadily moving in a downward direction.
That week, the price tested the KIJUN W1 again. In addition, on MN1 it is also bouncing off the KIJUN.
For happiness it needs three arguments:
price closing under the KIJUN MN1;
price closing under the TENKAN W1;
price closing under the D1 cloud.
Friday's speech by Jerome Powell could get in the way. I have it in my head that there is still time and the Fed may still want to pull the markets out before the end of the year.
But, even if that happens, I will only move my downward stance forward. Q4 2022 and Q1 2023 should bring negative data for the market - unemployment and persistent inflation.
Germany has serious problems:
rising inflation;
rising ECB interest rates;
the search for alternatives to energy from Russia.
If bad unemployment data come on top of this, the DAX may not hold very high.
That aside; I already have my first position at BE (price: 13877).
If I hear a more 'hawkish' attitude from the Fed on Friday, I'll be looking for a top-up.

GOLD - long term AT
The situation may take a strange turn, we need to follow the news.... The first inflammatory news is behind us, which caused this decline. The next one may just be a chain reaction....
The defense of this triangle formation may also cause a spring-test and a slow upward move in 2023-2024

S&P500 SHORT-TERM RALLY INCOMING !We are now expecting a short term rally to coming back into the $4,200 region to clear all trapped liquidity , Then we are expecting the next leg down to begin to target the pre pandemic lows for the long term swing lows. As we know there was a large amount of cheap money injected into the markets and as the principle dictates what the market gives easily it likes to take back + interest. On the bright side this would likley be the Reccesion bottom before we see the next economic expansion to take place and the money printers to turn on again as history indicates for the next bull market to begin where these opportunities will not present themselves for the next +30 years

US500/SPX enters into a bear market The last time this happened was in 2018 but the market some how management to rally which resulted in a false breakout.
In 2020 the market came back to this level and spiked around this area before turning into an almost 2 year rally.
2007 was a different story as market broke structure and the result was a sell of that lasted one year.
What will happen in 2022? Will the bulls take control and result in the SPX hitting another all time high.
Or will we see similar events of what happened in 2007 which resulted in a huge sell off that one year.

Why the U.S. dollar is strengtheningYellow= Support or Resistance
Green= Positive trendlines
Blue= Strong and trend effecting S/R
The analysis concern USD bound to SEK, however its a great general directional indication to USD weighing against all other.
The Analysis is about the current positive trend. Due to its already developed for some time its not in its beginning, therefore its not an obvious buy, so im neutral and HOLD at the moment, passing the orange line would say SELL, enter short, EXIT LONG. Otherwise we are currently at green trendline bottom and if passing many yellow lines (current resistances) we aim next to rebounded up until upper green trendline resistance.
Like & Share if this was worth anything, only then ill hare more ideas.

Consequences of the love affair with Russian raw materials.
Dependence on Russian raw materials; supply chain problems; the New Silk Road likely stalled or postponed; a return to a closer economic alliance with the U.S.; the vision of the ECB raising interest rates; the fastest rising inflation in 40 years; these are a few of the many reasons that could lead to an economic crisis, stagflation, and perhaps even a recession in Germany.
From a technical point of view, on the weekly interval, the price has broken through the cloud, giving a sign for a decline.
On D1, I think that the situation is not yet clear - although the price is under the cloud, which is enough reason to short - because there could be another attack on the cloud, or even an fake breakout.
If the price does not stop near 14000, the next area will be: 14370-14600 - KIJUN LINE from W1. And this is where the KUMO BREAKOUT on the D1 interval may occur.
If the price rebounds from the levels and accepts the continuation of declines, then I will take a position.
Targets are the levels set by the N-wave seen above.
Ultimately, the price, in my opinion, will stop at the last target, with the possibility of extension to the pandemic bottom and the peaks of 2000-2011 - price: 8500-7500.

SP500; How deep?
I think that the answer to the question: "is the SP500 in a bearish sentiment?" can be given up. Instead, I will try to answer how deep the SP500 can fall and what else can be expected.
On the weekly interval , we can already see the confirmation of declines – cloud breakout. Tenkan line on D1 and W1 is quite far from the price, so in the near future we should expect the correction of last decreases; tenkan and price, at least on D1, should meet at that time.
The target of the dips, for me, is determined by the range of the N wave, which can be seen on the W1 interval and below.
Price can stop at any range – there doesn't have to be a reversal; the stop can only be to form a correction.
I believe the SP500 will fall to the last range – around 3400, where tenkan from the 1-year interval is also located – then a larger correction will form to set new lower ranges. Thus, the entire bear market will have two N waves and will eventually end between the 2700 and 2000 price.
Printing money on an unprecedented scale; inflation ; supply chain problems; war in Ukraine; rising interest rates; rising unemployment (SOON); these could all be reasons for a recession.

Will GOLD behave differently this time?
Anyone, even those who have never invested, will tell you that gold is a safe haven. Especially when the market is pouring blood.
Unfortunately, for more than two months now, gold has been falling, despite the fact that the stock market and global indices are showing bearish sentiment. This is mainly due to the change in monetary policy in the U.S. – the Fed has started raising interest rates.
How long can this last?
Personally, I think gold is slowly approaching the end of its declines, because the data are not so favorable to the dollar after the first rate hikes.
Inflation is advancing; indices and large companies are trading lower and lower; more and more talk of recession; less and less confidence in what Fed members are saying.
And even if interest rates continue to rise, gold, in my opinion, will at worst be in a long-term consolidation, and at best the price will aim towards $3,000/oz.
Technically, the price stopped at the quarterly tenkan, monthly kijun and additionally the weekly cloud.
The first resistence are the D1 kijun – price: 1895 – followed by the W1 kijun – price: 1915.
If the price starts to seriously bounce from the above levels, the long-term consolidation scenario may start to materialize. Definite breakthrough of these resistances, is a clear signal for growths.
In case of long-term increases, the stopping levels are determined by the N waves seen above.
