Apple - Daily Weekly Cup And handle/ Rounded bottom breakoutReasons to go long:
Cup and handle breakout
Daily supply zone is broken and retested.
No major resistance in the up side
Will jump very quickly to the target
Also Nasdaq has absorbed its major supply zone in daily time frame
Recession

🟨 RECESSION? - TIGHTER CREDIT CONDITIONSFED CHAIRMAN POWELL'S STATEMENT 🎙️
Chairman Powell remains flexible regarding future rate hikes, emphasizing that decisions will be taken on a meeting-by-meeting basis. Notably, the removal of the word "anticipates" indicates a decrease in urgency for additional rate increases. Furthermore, the absence of the phrase "sufficiently restrictive" suggests that current policy has reached the desired level.
LENDING AND CREDIT CONDITIONS 💳
The Federal Reserve is closely monitoring lending and credit conditions as tighter credit may replace some of the rate hikes that could have been necessary. The current approach can be described as a "hope and pray" policy, where the Fed relies on falling inflation and tighter credit conditions to achieve a sufficiently restrictive stance, while hoping no other issues arise.
POTENTIAL RECESSION ON THE HORIZON? 📉
Tighter credit conditions might lead to a recession. However, it is essential to determine how much of this possibility has already been factored into the market.

Dollar General (DG) a recession stock is Trending UpDG had a swing low in mid-March. While it has retraced well, it is still 15% below the YTD high
On the 2H chart, the retracement uptrend is accompanied by a persistent volume of about 2X
that of March and before. I am supposing that with an early or light recession underway, value
sensitive consumers are delivering DG more revenue from its retail operations and will continue
to do so. The zero-lag MACD is showing a buy signal; I will take a long position and watch
for signs of overextension or loss of directional strength as an exit in due time.

BIGGEST ECONOMIC CONTRACTION OF A LIFETIMEThe comparisons to the beginning of dot com are uncanny.
I compared countless indicators and the current price action is identical to the dot com beginning.
Additionally, the duration of the yield curve inversion is identical and the % of the drop is identical, almost to the decimal.
The current contraction took 5x as long to reach this point as compared with the dot com.
The dot com contraction took 2.3 years to hit bottom from the identified mark.
Scaling the time, this correction could take 10 years (5 x 2) to reach bottom.
We've enjoyed 15 years of a bull market (with some bumps along the road).
Now, we are facing the most inverted yield curve in 40 + years.
Time for the market to pay the piper.
I fear this will be a recession we will share with our children in 20 years
We are only at the start of this.

FAZ Bear Leveraged Financial Economy ETF LongAs the fed raises rates to try to throttled down inflation, the economy and the financial sector
suffer. FAZ got its catalyst today in the federal news. It is a bearish fund that will go up
while the FAS ETF will go down.
On the 2-hour chart, the price can be seen rising to crossover the VWAP anchored a month back.
It is nearly crossing over the POC line of the intermediate-term volume profile.
These are both bullish moves confirmed by a dramatic increase in trading volumes perhaps
4-5X of the moving average volume.
The overall picture is a long trade setup either with stock or strategic but more risky
call options which could 10X.

The unemployment rate is very likely to riseJob openings are a leading indicator of the unemployment rate. Lower job openings lead to a unemployment rate higher.

The Deflationary SpiralAll credit booms brought about by Central Bank-induced artificially low interest rates and loose lending standards end in busts. In the recessionary phase that follows the boom, credit becomes much harder to attain and many over-leveraged businesses end up going bankrupt. The recessionary phase reveals the malinvestments and unsound business decisions that were made during the economic boom. Businesses & Consumers deleverage their balance sheets either through paying down debt or through bankruptcy. As loan demand falls & credit conditions tighten, debt issuance falls, which reduces the supply of money into the economy because the vast majority of currency that enters the economy is loaned into existence. When credit growths slows and begins contracting alongside a falling money supply, inventory piles up and profits & margins fall while consumer spending falls. Businesses are then forced to sell at discounted rates to liquidate inventory in anticipation of weak future demand, which further reduces profits & margins and leads to increased unemployment and weaker levels of consumption. The “Deflationary Spiral” subsides and an economic recovery can take place once balance sheets are back to healthy levels which can support debt accumulation, capital investment recovers, and once large amounts of the “bad” debts taken on during the economic boom have been deleveraged.
US M2 Money Supply is currently down -4.2% YoY using March 2023 data, the largest monetary contraction in the USA since the Great Depression. Using data going back to 1870, every time the money supply contracted by over 1% YoY the stock market had a large correction and the economy fell into a severe & lengthy contraction with unemployment reaching at least 7%. A banking panic always accompanied those contractions as well. Commercial bank deposits are currently down around -5% YoY, the most since the Great Depression. Total commercial bank deposits didn’t even contract during the early 1990s Savings & Loan Crisis. With money supply shrinking and the majority of banks unable to pay competitive rates on deposits, deposits will continue falling and more bank failures will occur. The large amounts of unrealized losses on bank balance sheets represent another impediment to loan growth and banks have continued to raise reserves for multiple quarters in response to rising default rates.
Fed research from the Fed Bank of Saint Louis show bank lending conditions (measured by percentage of banks tightening lending conditions) are comparable to early 2008 & late 2000. Bank lending conditions are a leading indicator for unemployment. The unemployment rate currently is still below 4%, but with the Conference Board’s Leading Economic Indicators index currently at -7.2% and the bond yield curve still inverted, many reliable economic datapoints show that the economy is closer to the beginning of this business cycle downturn and debt deleveraging than the end. Yield curve inversions & Conference Board LEI’s have been some of the best leading indicators for a recession since the 1970s. Since 1968, any Conference Board LEI contraction of more than -2% YoY has never yielded a false positive in regards to a coming recession. The Credit Managers’ Index newly released data for April showed that the index for rejection of new credit applications (within the service sector) was 45.9, its lowest level since March 2009.
The US Consumer is beginning to run dry on savings. The majority of Americans are living paycheck to paycheck and consumer credit growth (which had been expanding rapidly in 2022) has slowed markedly. Total consumer credit growth has fallen about 50% YoY (using the 3 month average of data from December - February). After falling below 3.2% in the summer of 2022, the US savings rate is still low by historic standards, currently 5.1%. Announced job cuts for the month of March were 89.7K, higher than the first 3 months of the 2008 recession. US large corporate bankruptcy filings (Bankruptcies of companies with over $50M in liabilities) from Jan-April totaled 70, seven more than during the same length of time in 2008. Student loan debt payments are set to resume again this summer, which will further reduce consumer spending. US Consumer sentiment levels measured by University of Michigan hit the lowest levels ever (going back to 1952) in the summer of 2022, and they have been fluctuating around 2H 2008 & 1H 2009 levels ever since. Delinquency rates on things like automobiles, credit cards, and commercial real estate loans are soaring. Cox Automotive found 1.89% of auto loans in January were "severely delinquent" and at least 60 days behind payment, the highest rate since the data series began in 2006. In March, the percentage of subprime auto borrowers who were at least 60 days late on their bills was 5.3%, up from a seven-year low of 2.58% in May 2021 and higher than in 2009, the peak of the financial crisis, according to data from Fitch Ratings.
Retail sales are an economic metric that track consumer demand for finished goods. US real retail sales down -2.1% and EU real retail sales are -9.9%. German real retail sales for the month of march just came in at -15.8% YoY! According to Bloomberg, Global PC shipments are down close to 30% YoY & Apple computer shipments are down about 40% YoY. In the past 50 years, US Gross fixed capital formation has only gone negative in the US before and during recessions. It is now negative and there has never been a false positive. Data from the Mortgage bankers association showed a -39% YoY decline in Mortgage purchase applications, a decline to its lowest levels in over 26 years. US Building Permits are down -24% YoY. Housing Starts YoY are down -17% YoY. Existing Home Sales are down -22%. Every national housing downturn in the past 45 years has taken at least 4 years from peak to trough prices, indicating that the current housing downturn is likely to continue for at least 2-3 years.
Every FED Regional bank report on manufacturing (using a 3 month average of the data) is in a contraction. The April Philadelphia FED Manufacturing index came in at -31.3. Since 1969, Every reading under -30 was either in a recession or a few months away from one. April Richmond FED Service Sector Index registered a -23, the same number as in Nov 2008 & Feb 2009 & worse than Jan 2009 which was -20 (August and September 2008 were -10 for reference). US manufacturing production is down -.5% YoY. March 2023 ISM PMI data was also very insightful. USA ISM Manufacturing PMI (March) was 46.3, its lowest level since June 2009 (excl. H1 2020). For reference, in the 08 recession, it wasn’t until October 2008 that the ISM manufacturing PMI fell under 46.3, over 9 months into that recession. USA ISM Manufacturing New Orders (March) was 44.3, its lowest level since March 2009 (excl. January 2023 & H1 2020), USA ISM Non-Manufacturing PMI (March) came in at 51.2, its lowest level since Jan. 2010 (excl. H1 2020).
The US Stock market is trading at one of the highest Shiller PE ratios & stock market capitalization to GDP ratios in history. Present day stock market valuations are rivaled only by the Roaring 20s Bubble (1929), The Nifty-Fifty Bubble (late 1960s/early 1970s) & the 1999/2000 Dot-com Bubble. All 3 of those examples were followed by the most negative 10 year real returns in USA stock market history going back to 1913. Over 40% of businesses in the Russell2000 are unprofitable and over 1/5 of the S&P500 are zombie companies. Clearly, the stock markets as of April 2023 are still in bubble levels of overvaluation.
Looking at the data in aggregate, I believe that a recession is currently occurring. Assuming earnings fall by about 30% peak to trough, using a conservative average from the past 4 US recessions, I assume S&P annualized earnings will fall to around 155. Using a conservative valuation multiple of 14, that gives a target price of about 2,200 for the S&P500 that is likely to be hit in Q4 2023 or 2024.
Thank you for reading,
Alexander Charles Lambert

DXY: The Nail in the Coffin? Quarterly ChartThe US Dollar is holding 1997-2000 prior resistance, as support. We have a breakout of a downward slope, retest of the trend line, and now retest of the most recent double top (2017, 2020). We all are watching Gold test the 2000 area, but what I don't see often is a technical pattern analysis of the US Dollar. As the dollar rapidly deflates, we will transition into a Stage 1 market cycle, Bond prices will have to increase to offset deflation, while interest rates remain high. I am not a fundamental trader, but this exact same TA setup is the reason I took AMC from the breakout to $50. Patterns repeat themselves, that's why they are called patterns. They may only work because people think they work, but you can't bet against them. DXY holding 100 area through next FOMC meeting will be a sign to me that recession declaration is imminent.

Amazon - go longSince there is a good closing above the bollinger band in the weekly and daily as well and the above supply area is tested already.
There is a good change for the break out.

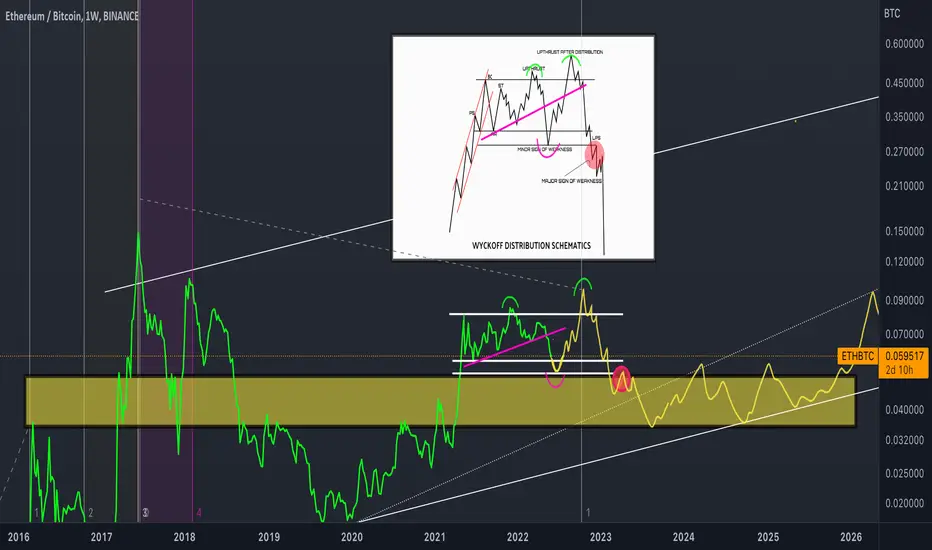
[UPDATE ETH/BTC] What if?Many think we are going straight down but what if we see this kind of fake down fake up distribution before?
Market AnalysisUnemployment claims are lower than expected (down)
GDP is only 1.1% (the dollar will rise slightly)
Personal expenditures are fronted by 1%, soaring to 3.7% (bad)
Core PCE increased from 4.4% to 4.9% (bearish)
Analysis:
The U.S. economy is worse than expected and has clearly entered a recession. However, inflation and personal consumption are set to soar, proving that QT isn't enough. After this data, big possibility for FED to raise more interest rate. The stock market and crypto will at least dump for another 10% or more.
Personal market analysis, for reference only

Inverted Yield Curve Starts in 2023 - Explained When the yield of the 3-month bond is higher than the 30-year bond yield, this is known as an inverted yield curve. It is a rare and unusual occurrence and we are seeing this today. This signals a potential economic recession in the future.
An inverted yield curve suggests that investors have a pessimistic outlook for the future of the economy. They are willing to accept lower yields on long-term bonds because they anticipate a slowdown in economic growth. In contrast, they demand higher yields on short-term bonds because they expect the central bank to raise interest rates in response to inflationary pressures.
An inverted yield curve can lead to a decrease in borrowing and lending activity, as it can make it more expensive for businesses and consumers to borrow money. This can result in a reduction in economic growth and can eventually lead to a recession.
Some reference for traders:
Micro Treasury Yields & Its Minimum Fluctuation
Micro 2-Year Yield Futures
Ticker: 2YY
0.001 Index points (1/10th basis point per annum) = $1.00
Micro 5-Year Yield Futures
Ticker: 5YY
0.001 Index points (1/10th basis point per annum) = $1.00
Micro 10-Year Yield Futures
Ticker: 10Y
0.001 Index points (1/10th basis point per annum) = $1.00
Micro 30-Year Yield Futures
Ticker: 30Y
0.001 Index points (1/10th basis point per annum) = $1.00
Disclaimer:
• What presented here is not a recommendation, please consult your licensed broker.
• Our mission is to create lateral thinking skills for every investor and trader, knowing when to take a calculated risk with market uncertainty and a bolder risk when opportunity arises.
CME Real-time Market Data help identify trading set-ups in real-time and express my market views. If you have futures in your trading portfolio, you can check out on CME Group data plans available that suit your trading needs www.tradingview.com

True bottom for EthereumSame for bitcoin .. if you still have money in profits
GET OUT!
Do not hold it ; secure your profits that you had made and buy again until we reach the true bottom.
The Feds has confirmed that the mild recession is coming in the end of 2023; do your thing and be prepared.
The markets will keep crashing until the true bottom is in; it will take 2 full years for the markets to recover.
Now for Ethereum the resistance is strong and felt the impact of the economy and the news from the Feds, 2000-2200 is the strong resistance of the zone and now the bear market is back from the long water break and take over.
WHEN TO BUY: buy Ethereum until it hits 400-500 area that price is the real bottom for Ethereum.. once the bottom is in go all in.. and the target price you all know HKEX:10 ,000 is the target in 2024 until 2025.
Trade safe y’all and please survive the recession y’all know what to do

Market Analysis: The Coming RecessionIn this post, I will present a market analysis with a focus on recession metrics and indicators. Right now, many of them are sending a recession warning.
Home Prices -
U.S. home prices are surging higher at the fastest quarterly rate of change on record. (See chart below)
This extreme rate of change in home prices is occurring as U.S. 30-year fixed mortgage rates also explode higher at nearly the fastest quarterly rate of change on record. (See chart below)
Additionally, we see in the chart below that 30-year fixed mortgage rates have potentially broken out into a new uptrend on the longer timeframes. The best way to detect trend reversals is by using the Ichimoku Cloud. When the price closes above or below the cloud (the shaded area) it is considered to have "pierced" the cloud. Once the cloud is pierced to the upside, resistance becomes support. In this case, assuming the piercing sustains, we can see a sustained period of higher interest rates on 30-year fixed mortgages.
Exploding home prices and exploding mortgage rates occurring simultaneously is unsustainable. Examine the yearly chart of U.S. home prices below and notice the similarities between 2005 and 2022. Notice that the Stochastic RSI is extended to the upside, and that home price extends above the upper Bollinger Band. Looking at this chart one could reasonably conclude that in the coming years home prices are likely to revert to the mean (orange line), as they did during the Great Recession.
Many analysts try to contradict what this chart is suggesting by claiming that we are in much better shape now than during the sub-prime mortgage crisis prior to the Great Recession. But are we really? With spiraling inflation, every mortgage holder suddenly becomes relatively more sub-prime. We also did not see mortgage rates explode then as quickly as they are now.
Unemployment -
Analysts point out that the current low unemployment is a reason to believe a recession can be averted. But under the surface, that's beginning to change in a hurry. Below is a chart of most leading unemployment data published by the Federal Reserve: Seasonally Adjusted Initial Claims (Weekly).
In this chart, we see that in about a period of the past 4 months, the amount of new unemployment claims has risen by around 100,000 or about a 50% increase. Compare this to the chart from the 2007-2008, when the U.S. economy was beginning to enter a recession (the shaded area represents where the recession began):
In the period leading up to the Great Recession, we saw a rise of about 50,000 new unemployment claims or about a 15% increase over a similar 4-month period. Therefore, the rate of increase of initial unemployment claims (both in real numbers as a percentage) is higher now than when we entered the Great Recession.
Perhaps more worrisome is the difference in how accommodative the Federal Reserve was in response to rising unemployment. Here is how the Fed Funds Rate changed as unemployment began to rise in late 2007 into 2008:
As unemployment was rising, the Federal Reserve began to cut interest rates. Compare this to the current situation in the below chart which shows the Federal Reserve raising interest while unemployment is rising. This change in context is reflective of both the fact that the Federal Reserve is behind the curve with containing inflation and the fact that the Federal Reserve is prioritizing the current problem (inflation) at the expense of the future problem (unemployment).
We are experiencing a macroeconomic situation whereby rapidly rising initial unemployment claims are being paired with rapidly rising interest rates. This combination is unlikely to end with any other outcome than a recession.
For more details on unemployment data see here: www.dol.gov
To interact with the initial unemployment claims data on a weekly basis you can go here: fred.stlouisfed.org
Yield Curve Inversion -
The 10-year minus the 2-year Treasury yield is used to detect an impending recession. When the 2-year yield rises above the 10-year yield that creates a yield curve inversion, which can often indicate that a recession is coming. Right now the yield curve inversion is very steep. In fact, just recently, the yield curve inversion actually steepened to a level that was even worse than what we saw before the Great Recession.
Perhaps most alarming are the rates of change in interest rates. Look at the 10-year yield Rate of Change on a 3-month basis:
Here's the 2-year yield rate of change:
The federal reserve uses the 10-year minus the 3-month as a more reliable indicator for detecting an impending recession than the 10-year minus the 2-year. However, the rate of change for the 10-year yield has been so parabolic to the upside that the 3-month yield has been struggling to invert relative to it. However, that may soon change. Here's the 10-year minus the 3-month yield chart:
Volatility -
As you know, volatility is measured by the VIX. The yearly Stochastic RSI for the VIX is trending upward, signally the potential for greater volatility now and throughout the years ahead.
This part is a little confusing, but try to follow if you can: Volatility of volatility is measured by the VVIX and is considered a leading indicator of the VIX. Currently, the VVIX is so suppressed to downside that the K value of the Stochastic RSI oscilator has reached zero for only the second time ever. (The first and only other time this has happened was in 2008). While this may be more coincidental than predictive, it nonetheless suggests that volatility of volatility has nowhere to go but up. See below.
Margin -
Margin has already unwinded both in real numbers and as a percentage by a magnitude that is consistent with, and usually only occurs during, a recession. See chart below.
Credit to Yardeni Research, Inc. You can view their full report here: www.yardeni.com
Stock Market -
Several bellwethers in the stock market are showing that, while we may have a robust rebound from extremely oversold levels in the short term, the longer timeframes look quite bearish, especially for the interest rate-sensitive tech and growth sectors.
For more details, here is my analysis on the QQQ/SPY relative performance:
Tech and growth are not alone in the bearish context. Indeed, the bull run from the end of the Great Recession to the current period has been characterized by increasing prices but decreasing volume. This is generally bearish, and may reflect that quantitative easing was a large cause of the bull run. Now, quantitative easing is ending in the face of spiraling inflation.
Other Metrics -
There are many other metrics that are used to detect recessions (e.g. GDP, PMI, M2V). Some may even look toward shifts in demographic trends, rising geopolitical tensions, declining globalization and climate change as recessionary factors. While I cannot discuss every possible metric, one last metric worth considering is the corporate bond market.
In 2020, during the COVID-19 shutdown, in order to stabilize markets, the Federal Reserve rushed in to save corporate bonds from crashing fearing that high borrowing costs for corporations could cause liquidity issues. Corporate liquidity issues can cause a whole host of issues from bankruptcies to layoffs. Currently, however, corporate bond prices have fallen to nearly that of the COVID low when the Federal Reserve rushed in to buy, yet the Federal Reserve is only just beginning quantitative tightening and just now beginning to roll bonds off its balance sheet.
Finally, I will leave you with this note: The time-tested winning strategy is to continue contributing as much as possible to your retirement fund. If the stock market crashes, do not stop or lower your contributions or try to pull money out because you think the world will end. Rather, continue to contribute as much as you can afford no matter what to a retirement mutual fund with diversified holdings. Contributions during market downturns will buy you more shares of your retirement mutual fund relative to the number of shares your contributions bought prior to the market crash. When price rebounds (and it will) you would have been glad to stick to this investment strategy.

DXY AOIS FOR MAJOR CROSS CORRELATION SHORTS AND LONG SETUPSI am personally favouring a long term collapse on DXY.
Seeing both buy side and sell side LQ formed writ large between PWH/PWL
Monday I will monitor Asia high or low being formed. Hopefully a setup of a retest presents itself in order to reciprocate the idea onto a major cross pair (GU) and potentially go long at some point, whether it be later today, tomorrow, or mid week once LOTW is formed.
Will update this publication throughout the week.

The Fed Just Broke SomethingThe chart above shows the CBOE Equity Put Call Ratio (CPCS) .
Last week the put-call ratio broke its all-time record high, surpassing the levels seen during the Global Financial Crisis and the March 2020 market crash by almost twice as much. In this post, I will explain my thoughts about what's going on. I welcome others to also give their thoughts in the comments below.
Let's begin with the basics of the put-call ratio. The put-call ratio is simply a measure of the relative amount of trading in put options versus call options. Typically the put-call ratio rises during periods of extreme fear in the market, when volatility is also high. Historically, the put-call ratio has been used as a contrarian indicator, meaning that when it is very high it signals that too many market participants are bearish and when it is very low it signals that too many market participants are bullish. Typically anything above 1 is considered too bearish. A put-call ratio above 1 has historically marked significant stock market bottoms.
However, something very strange has been happening recently. The put-call ratio has been exploding to such extreme levels that some people are now saying the indicator is broken. Last week, the put-call ratio reached an insanely high level (2.4). Yet, on the day this record spike happened, the VIX was in the low 20s, which is only modestly elevated, (see the chart below).
As the chart above shows, a VIX in the low 20s is only slightly above normal.
The put-call ratio was so extreme last week that one would have expected the VIX to be off-the-charts. In the chart below, I've calculated the general area (marked by a flag) of where we would have expected the VIX to be if the put-call ratio accurately corresponded to such an extreme put-call ratio.
Some market analysts and many people on social media are attributing the unprecedented spike to 0DTE , or Zero Days To Expiration, options trading. Zero Days To Expiration refers to options that are traded on the same day (or within 24 hours) that they expire. This speculative form of trading has proliferated over the past year. Those who cite 0DTE as the reason for a malfunctioning put-call ratio argue that its utility as a contrarian indicator has become confounded at best, or noisy and meaningless at worst.
The below chart shows the proliferation of Zero Days To Expiration options trading.
When compared alongside the put-call ratio, we can visually garner a potentially high correlation.
Some market analysts have stated that the proliferation of 0DTE options trading has become so disruptive that not only has it broken the role that the put-call ratio plays as a contrarian indicator, but it has broken the essential role that the VIX plays in measuring volatility. The VIX, which is calculated based on only S&P 500 options expiring 23 to 37 days into the future, may not be properly capturing the true panicked nature of market participants who are mostly trading options with much less time until expiration.
Yet, questions remain, even when considering the rising prevalence of 0DTE options trading. Specifically, why is 0DTE causing puts trading, in particular, to increase so dramatically?
The answer is likely that 0DTE option trading is not the only cause of the exploding put-call ratio. Some informed market participants have argued that the Fed's extreme monetary tightening is largely to blame, though their reasoning is not as obvious as it may seem. Although it's likely true that the Fed's tightening is likely driving up fear and causing market participants to load up on puts. The more informed explanation involves an arbitrage strategy that seeks to take advantage of those who are loading up on puts.
An academic paper entitled, Put Option Exercise and Short Stock Interest Arbitrage , explains this strategy. The strategy takes advantage of those holding deep in-the-money puts with no time value remaining and which ought to be exercised such that the cash can earn interest.
Above is a screenshot of the academic paper, which I cannot distribute because of copyright restrictions. I can only show the abstract which is publicly available.
For educational purposes, I will cite a small excerpt from the article to explain exactly how the strategy works:
The game involves capturing short open interest. The game, dubbed “short stock interest arbitrage,” involves simultaneously buying and selling a large (relative to existing open interest), but equal, number of deep ITM puts and then immediately exercising the long puts. Since exercises are randomly assigned to open short positions, the arbitragers systematically capture the dominant share of the total short open interest and thereby earn the dominant share of the forfeit interest.
Now that the Federal Reserve has dramatically hiked interest rates, this strategy is much more lucrative than in the past since the interest that can be earned by arbitragers is much higher. Furthermore, the stock market's decline in 2022 caused more puts to become in the money thereby expanding the volume of puts traded by arbitrageurs. Since this strategy is non-directional, meaning the strategy involves simultaneously buying and selling an equal number of puts, its net effect is theoretically zero. Thus, this strategy's proliferation may be causing the put-call ratio to malfunction.
Despite these reasons, other market participants have speculated that the extremely high put-call ratio is due to large institutions and other informed market players loading up on large hedges because they believe a major market crash is coming. While this is largely speculative, there is some evidence that informed institutions are becoming increasingly concerned about a liquidity crisis due to the Federal Reserve's tightening. Last month, the Bank for International Settlements (BIS) recently issued an unusual warning about the potential for a liquidity crisis in the global FX swaps and forwards market.
Link to the BIS article: www.bis.org
The BIS, which is often thought of as the central bank for central banks, explained that dollar payment obligations in the FX swaps and forwards market are generally not recorded on balance sheets and that the risks associated with these debts could be understated by tens of trillions of dollars. In effect, the Federal Reserve's rapid rate hikes have caused the U.S. dollar to rapidly become more valuable relative to other currencies, creating risks in the FX swaps and forwards market that were not fully anticipated.
In some regards, the actual causes of the breakdown of the put-call ratio are not as relevant as the mere fact that it has broken down. According to Exter's Pyramid (shown below), during periods of extreme instability of asset classes lower down on the inverted pyramid, everything higher up becomes some degree more unstable. The meteoric rise in Treasury yields has made everything above shakier, especially derivatives. Rapidly rising Treasury yields are destabilizing the highly-leveraged derivatives market in unanticipated ways.
Now that U.S. Treasurys suddenly yield much more, this means that capital will tend to flow lower down the pyramid into them. Leaving riskier assets higher up vulnerable to collapse.
Despite all of this, some market participants continue to believe that the put-call ratio is still a reliable contrarian indicator. These market participants argue that whenever fear is high, people always say "this time is different" when in fact it is not. They believe that not only is the put-call ratio indicator still working but it is indicating a high chance for a major short squeeze.
Only time will tell what will become of the current situation. Yet, one thing is for certain. Despite the highest put-call ratio on record last week, the rules of good trading and good investing remain the same. No matter the fear, volatility or crisis that may transpire, if one adheres to these principles, one will be successful.
Sources
Barraclough, Kathryn and Whaley, Robert E., Put Option Exercise and Short Stock Interest Arbitrage (May 17, 2013). Journal of Investment Management (JOIM), First Quarter 2013, Available at SSRN: ssrn.com

AAPL: S&P500 RELATIONSHIP / PIVOT / TECHNICALS IN FAVOR OF BEARSDESCRIPTION: In the chart above I have included a macro analysis of AAPL & its congruent relationship with the S&P 500 INDEX. AAPL is to be consider one of the major players when it comes to overall US MARKET PERFORMANCE & is the reason why understanding AAPL's price action momentum is so vital.
POINTS:
1. AAPL channel deviation where liquidity usually occurs between SUPPLY & DEMAND = 12.50 POINTS
2. Macro Trend: Downtrend Channel; Micro Trend: Uptrend channel with Bearish Ascending Triangle Formation
3. Macro Trend continues to make lower highs & lower lows after peak from January 2022.
TECHNICALS:
RSI LEVELS on the DAILY time frame have been squeezing into overbought territory for the past 4 months.
MACD LEVEL is in common overbought territory where rejection & downturn is indicative.
BULLISH POINT OF CONTROL: 167.50 POINT must be broken to the upside in order to invalidate BEARISH SETUP.
BEARISH POINT OF CONTROL: 155.00 POINT must be broken in order to further validate BEARISH SETUP.
FULL CHART LINK: www.tradingview.com
NASDAQ:AAPL

True bottom for bitcoin The 27K zone has been broken , should expect a short buy before the bigger drops occurs; the Feds said that the recession is going to be mild but most said would be severe during the recovery in mid or late 2024.
Fundamental Recession begins 2 months before end of 2023; should looking forward recovery during 2024
China and Russia are preparing for War against the United States wonder when World War 3 will begin.
Bitcoin halving starts in April of 2024
Bitcoin true bottom is 12K-8500 area; experts said 5000-8500.
Trade safe y’all and don’t hold it way to long, 15K-27K isn’t going to hold much longer.

What if....
what if we have a yield curve that hasn't been inverted this much in 40 years
what if we've enjoyed 15 straight years of bull markets
what if this is just the start of the correction
what if I told you that I've tested 50 indicators and identified that this correction (on a weekly scale) thus far has matched identically to the START of the dot com bubble (on a daily scale)- March 2000 to June 2000
what if I told you that if you scale the duration of start of the dot com crash to this correction, this correction would be 5.9 X the duration of the dot com bubble and this correction will end it 4.5 years.
I'd encourage you to examine the start of the dot com bubble from March 2000 to June 2000 (daily scale) and compare to the current weekly Nasdaq technicals and see for yourself.
I hope this isn't the case, but what if...
Good Luck

VIX: VIX is at historic lows. won't go lower in this crisisVIX: VIX is at historic lows. won't go lower in this crisis. Will reach above 100s.

Weekly: Overview of total market.Weekly: Overview of total market.
All info is write in the chart. there is a lot of fundamental info and bubble alert in bonds yield and numbers increasing in unemployment.
Bonds inflows+++
Index options: bullish. Index cash: Big outflows.
Dollar inflows+++

Daily and Weekly Rejection. 200 Billion Calls and market flat.Daily and Weekly Rejection. 200 Billion Calls of worth and market flat.
The US bought 200 billion worth of options is 200 billion of stocks to sell to get the market flat.
Lower highs and weekly and daily rejections on Friday. see the market getting its recession on Monday,
Delta in options across the board was at yearly highs. DAX rallied with EU meeting. But didn't make a new high.
Created a lower high and volume didn't make a new high on Friday. Many facts to see the market as topped out.
Options data with market analysis. See the market crash by about 50-70%. Because of the deflation cycle coming, we need.
The dollar needs to come back up and inflation needs to hit negative numbers to have expansion room for the future.
Best Regards
Robin,

ES: Recession/Depression 2023ES: Recession/Depression 2023
ES: Recession/Depression 2023
ES: Recession/Depression 2023
ES: Recession/Depression 2023
ES: Recession/Depression 2023
ES: Recession/Depression 2023
ES: Recession/Depression 2023
ES: Recession/Depression 2023
ES: Recession/Depression 2023
ES: Recession/Depression 2023
ES: Recession/Depression 2023
ES: Recession/Depression 2023
ES: Recession/Depression 2023
ES: Recession/Depression 2023
ES: Recession/Depression 2023
ES: Recession/Depression 2023
THE END IS NEAR.
