Is a crash approaching?Hi, I had opened a short on the SP500 last night, all economic factors are pointing towards a recession whether it is interest rates, housing market, inflation or political leaders. This week the US 2 year treasury reached 5%, a level not seen since just before the financial crash. Waking up to the news of Silcon valley bank plummeting due to them announcing a share sale to help hold up their finances. This saw shares across the whole market drop, spooking investors. Shares in the four largest banks dropped more than $50 billion. I believe this could be the catalyst to start the next financial crash, I had already made some predictions on this a few months ago in September 22.
SVB is also a big lender to the tech industry which has built up as the foundations of the current economy.
Maybe I'm wrong - let me know your thoughts!
Recession

US30 Short SignalNice time to go short after resistance test... looking for 1:2.5 risk reward .... put break even after initial risk or a little bit more....

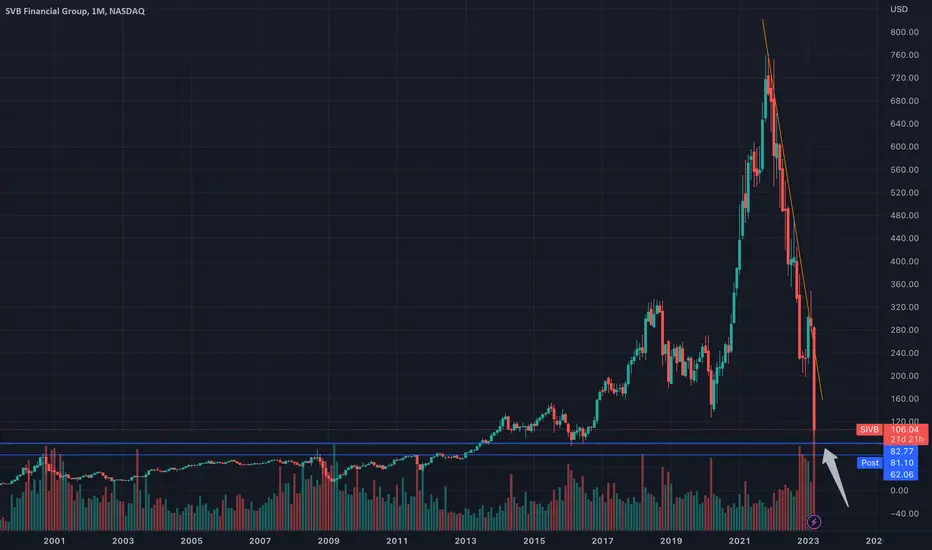
Any chance for a $SIVB Revival?No surprise we saw a huge knife down that met with hard resistance at ~$82.77. This price point acted as a huge support back in 2016. Despite the NFP numbers, there should be a relief bounce for the stock, but any follow-through to break that resistance during the trading day could introduce a retest of the monthly high in 2000. You can be certain that Silicon Valley Bank is at risk of losing capital to the many companies that will be looking to withdraw (keep in mind that the struggling tech market means fewer deposits in SVB). I have no specific positions on $SIVB and see a very long road to recovery here. Their 2.3B firesale in new shares would cause extreme dilution to the stock, which was needed from their horrible positioning just before interest rates increased with their $21 billion bond portfolio having a yield of 1.79% and a duration of 3.6 years compared to the 3-year treasury yield of 4.71%.
What happened today is a harbinger of what's to come for the entire market.
$DXY overtakes $BTCOne of the most important barometers for global currencies is the Dollar Index (DXY), which measures the value of the US Dollar versus a basket of global currencies.
What is the relationship between DXY and BTC?
What Does it Signify? It is a known fact that the crypto price movements are deeply correlated with the DXY Index since its inception. While the DXY index gets stranger, Bitcoin, Ethereum, and many other assets tend to fall. Besides, if the cryptos manifest their strength, then the dollar's strength tends to fall.

SilverHi
we have 2 key point
first >>>> inflation and intrest rate : if inflation cant hit 2 % we can say silver drop to 17 looklike another commodity
2nd >>> recession >>> Consequences of excessive interest rate increases >>> This MOD can pump Gold but Silver dont have safe haven character >>> if this point true XAUXAG can pump
ANYWAY SILVER CAN HIT 50$ to 10$
be careful

How FED softlanding would look like?FED wins - 2013 like softlanding:
- current range holds
- double bottom pattern takes us out with a new rally
- only viable with inflation under control
- emaflow range projections act as support areas if we break the first the next levels come in to play
- if it validates - we should be recovering arround march next year - took arround a year to visit ath
confirmation is second buy signal with current range holding

Nasdaq for history loversIf history repeats itself...
1. Upcoming +50% 3month rally more or less
2. Recession is officially here and -20% from previous lows
3. Rally again hard to >+100%
4. Double bottom
5. New bull market begins
Look First / Then Leap

European Gas March 2023: Bullish and Bearish FactorsThe idea has two parts: fundamental and technical analysis . The latter is based on the weekly chart.
On the fundamental side , several essential and minor factors affect and could affect March 2023 price change. Let's divide them into three groups.
Bullish :
Russian shutdown of gas supply to Europe
Russia has cut its European flows for the last months so that a total shutdown would be possible. Russian gas remains crucial for the European economy despite the American armada of LNG ships.
Freeport LNG plant Restart Shift
The company plans to restore the plant in January 2023. A possible postponement would support TTF prices in the winter season.
Limitations of US Gas Exports
Last winter, some US Senate members suggested limiting or prohibiting US LNG export. They estimated that the change would increase US gas supply for the internal US market, especially for New England, which is dependent on the import of gas from the gas-production states getting gas via pipelines and LNG. They said the prohibition would reduce high gas prices for customers and industry. In July, LNG winter 2023 prices for New England touched a record high of $40/MMBtu, while Henry Hub traded at about $8.6/MMBtu. I suppose that senators would return to the idea, especially since the US elections are in November. Although the risk is low, its realization could dramatically affect the TTF price assessment. Analysts and think tanks have considered possible Russian gas cuts but haven't accessed a potential US gas supply reduction.
French Nuclear Plants Outages
Since the end of 2021, the French nuclear industry has been weak with planned and unplanned maintenance. As a result, nuclear output has lost more than 40% YoY of its output. While serious issues are unlikely to arise, new minor obstacles could buoy TTF prices.
Dry Summer
The continuation of the European 2022 dry summer led to abbreviated hydropower production. On the back of hydropower reduction, natural gas-power generation increases its output and gas consumption, driving subdued gas injection into storage facilities. Subdued gas injection in summer means less gas for winter, creating a possible gas deficit.
Bearish:
Slowing European Economy and Demand Destruction
High inflation induced by the monetary policy of 2020-2021 provokes a decline in real incomes and makes some industrial production unprofitable or near break-even. These debilitate aggregate demand, particularly industrial output of fertilizers, ceramics, and other chemicals. Industries that are heavily reliant on gas are cutting their gas consumption today. Lasting historically high gas prices would promote a decrease in gas utilization. The demand destruction could happen among all consumers: power, industrial and individual. A new recession is near. ECB monetary policy with a growing rate also adds problems to the economy. The rate is still tiny, but debt bubbles are sensitive to interest rate change. The bust of bubbles would drop economic growth and curtail gas demand pushing TTF prices down.
Slowing world economy
The world economy suffers from high prices losing economic growth momentum. A move into a recession would trigger a decline in gas consumption lowering LNG gas prices and letting LNG producers increase LNG sendout to Europe.
Voluntary Demand Reductions of 15% and Gas Rationing
Energy ministers of Europe adopted plans to voluntarily cut gas demand by 15% from August until March 31, 2022. In case of emergency, like near zero Russian flows, the voluntary reduction changes to mandatory. i.e., gas rationing. The actions could divert rising prices.
Covid Lockdowns in Europe
Europe has prepared different measures to withstand possible gas issues in winter. Besides voluntary reduction or rationing Europe could return to the lockdowns of 2020, when gas consumption dramatically went down because industrial production of goods collapsed. Since June 2022, the media has published news about a new variant of Covid. Countries could impose Covid-related limitations this fall. Unstable gas consumption and gas shortage would drive for a Covid or climate lockdown. A good measure to cut gas demand and destroy the economy.
Covid Lockdowns in China
Despite possible lockdowns of 2022-2023 in Europe, lockdowns in China happened in the last months and could be imposed again. An effect of prohibitions has hit the Chinese economy and cut gas consumption resulting in freeing up the supply for other consumers, i.e., Europe. New Chinese lockdowns would mean more gas for Europe.
Joker :
The joker that could be a bullish or bearish driver is the weather. They can't predict winter weather today. Lasting temperatures above season norms in winter could be a lifesaver for Europe, dropping gas consumption and its prices. Cold spells and lingering temperatures under the winter season average would lift prices significantly. Near-average temperatures would put the significance of the factor on hold. While in summer, it is vice versa. Temperatures above the norms slow gas storage injection and slightly increase a lack of gas risk in the winter season.
On the technical side , there are no resistance levels cause the contract is traded near its record high. Only psychological levels like €200/MWh , €300/MWh , and higher. On the bulls' side, there are many support levels. For those practicing buy a bounce trading , essential levels are €125/MWh , €100/MWh , and €86/MWh . The last one developed in the December 2021-April 2022 period. I estimate that Gazprom made a significant contribution to its existence. Gazprom's export price to Europe, which was pegged to a fusion of lagged prices of fossil fuels, including TTF, was near to €86/MWh . So when the market price rose significantly above the level, market participants cut their demand because Gazprom sold cheaper. When the price tried to break through €86/MWh and went down, Gazprom trimmed its flows to Europe. All in all, this helped the company to control its revenues on the same level. Since then, it has not been the case because Gazprom has changed its approach.
Finally, I am afraid to forecast the price on the expiration date. I suppose the price would remain volatile, and we could see spikes above €200/MWh in the winter season.
Thank you for your reading, and have profitable trading! Comment your thoughts!

Fundamental and Technical Analysis | FebuaryTable of Content:
1. Eurozone Inflation Data
2. US Economics Growth
3. NVDA
4. Commodities
5. Technical Analysis
1. Eurozone Inflation Data
The Eurozone's inflation for the month of January has exceeded the previously estimated figures, as reported by MarketWatch on February 23. It has been emphasized by policymakers that the economy is undergoing a disinflation process, and a soft landing has been achieved. However, the recent surge in inflation within the European Union implies a substantial escalation in interest rates.
2. US Economic Growth
The US economy experienced a less robust economic expansion than previously estimated in the fourth quarter, as evidenced by a downward revision in consumer spending. This adjustment has resulted in weaker economic growth (Bloomberg).
The total amount of outstanding credit card debt in the United States has reached $986 billion, with an average interest rate of 20%. This marks the highest level of credit card debt since the 1980s and translates into an interest payment of $200 billion per year. These figures do not include other forms of debt such as mortgages, student loans, and car loans, which are likely to exacerbate the situation. At the same time, the US government is paying over $200 billion in interest payments
The Personal Consumption Expenditures Price Index has risen from 5.3% to 5.4%, however, this data alone is insufficient to support the notion of disinflation. The Gross Domestic Product (GDP) has been revised downwards from 2.9% to 2.7% (a decrease of 0.2%) from the preceding quarter. According to Bloomberg, the US economy experienced a weaker expansion than originally projected.
Revised fourth-quarter inflation figures have been adjusted upward.
Additionally, JP Morgan's Jamie Dimon stated that "The Federal Reserve has lost a little bit of control of inflation". He has been warning about the economy for a while and I believe that he knows something is cracking as we speak.
3. NVDA
The stock price of $NVDA experienced double-digit growth. The stock price has risen by 100% since the beginning of the year. Revenues and profits have both decreased by 21% and 52% respectively on a year-over-year basis, and every segment of the business has exhibited a decline over the same period. The CEO placed significant emphasis on the importance of Artificial Intelligence, yet he sold stocks worth over $100 million prior to the market's significant downturn and may presently be engaged in additional sales.
4. Commodities
The statement suggests an anticipated appreciation in the value of the US dollar, which is reflected in the downward movements of gold, silver, platinum, copper, and various grains such as corn, rice, and soybean. Conversely, energy commodities are experiencing an upward trend, with natural gas exhibiting a significant increase.
5. Technical Analysis
The 21-day weighted ratio of equity-only put-to-call options is suggestive of a preponderance of puts in the market and indicates a significant degree of buying pressure. This metric has demonstrated a high degree of efficacy in identifying market highs and lows by suggesting a move in the opposite direction to the put/call ratio. Notably, during the present bear market, the ratio has achieved a 100% success rate. Furthermore, the current volume of call options is the highest on record, and retail investors are contributing $1.1 billion daily to the market.
-Momentum indicators: RSI and MACD moving downwards and volume remain below average (bearish)
As previously stated, " I will take the opportunity of a rise in equity markets to short BTC at higher levels". I have now filled all my short position on BTC in a confident manner. Below is my BTC outlook
Conclusion:
The recent market rally, spurred by technical indicators, high-quantity puts, and government emphasis on disinflation, has led to a surge in retail investment. As a result, prices for some assets have skyrocketed, and the quantity of long positions in the market has reached alarming levels. This suggests an overabundance of buying and a lack of liquidity that could cause the market to dip and potentially result in retail closures, as inflation has proven to be more persistent than anticipated by governments. I remain committed to my long-term investment plan, I am acknowledging the growing fissures in some economies that could lead to a catastrophic downturn. It is essential to remain vigilant and prepare for potential market turbulence in the future.
As previously mentioned, my portfolio consists of short-term bonds, USD, SPX shorts, BTC Shorts, small quantity gold, and just acquired Natural gas contracts.
For personal records but feel free to discuss or argue.
Value, Growth or neither?Looking at equity markets as a conflict between Value stocks and Growth stocks has become a reflex for many market commentators. ‘Growth is beating Value’ (or the other way around) is always a good headline. Value stocks are defined as basically cheap stocks and it is, therefore, possible in any index, to point to the Value side of that index. Growth stocks are defined as stocks with above-average growth prospects. So again, it is possible to look at an index and point to the growthiest stocks. The main index providers have done exactly that by splitting their main indices in two down the middle, a Growth and a Value version, as early as the 1980s.
Using Value and Growth to explain the last ten years
While simplistic and playing into human’s love of false dichotomies, it is true that this narrative explained the last ten years of equity performance pretty well. From the overwhelming domination of Growth stocks, in a negative interest rate environment where investment was cheap, to the start of a Value revival last year, on the back of the most aggressive tightening cycle in decades.
What about the other factors? Didn’t Quality perform better over that period?
However, most things in our world can’t be reduced to a simple choice. Academics have demonstrated over the last five decades that multiple other factors can be used to slice and dice the markets to create outperforming portfolios. In the 90s, Fama and French introduced their 3-factors model using Value but also Size and Momentum to explain market returns. More recently, they added Profitability (often called Quality) and Investment in a new 5-factors model.
Looking at the performance of the seven leading factors over the last ten years, we note that while Growth beat the market by 1.6% per annum and Value underperformed by 1.9% per annum, the strongest factor was, in fact, Quality with an outperformance of 2.3% per annum1.
Is Quality Value or Growth, then?
Using Quality as a third lens, we observe that companies in the Value index are, on average, less profitable than those in the benchmark, and that those in the Growth index are, on average, more so. 23% of the S&P 500 Value exhibit less than 10% in return on equity (ROE) versus less than 5% for the S&P 500 Growth. And 25% of the S&P 500 Growth has more than 50% in ROE versus less than 5% for the Value index.
However, what is fascinating is that in the Value index, there are still some very profitable companies and in the Growth index, there are still some unprofitable companies. In other words, the Value/Growth dichotomy is very different from the High Quality/Low Quality one. The market could therefore be split not into two indices (Value and Growth) but into four:
High-Quality Value
High-Quality Growth
Low-Quality Value
Low-Quality Growth
Historically, High-Quality Value has outperformed High-Quality Growth
Using academic data, it is possible to splice US equity markets since the 60s into groups by fundamental data. In Figure 3, we focus every year on the 20% of the universe with the highest operating profitability (that is, High Quality in Figure 3). That group is then split into five further quintiles depending on their valuations (using price to book (P/B) as a metric) from the cheapest to the most expensive.
We observe that picking profitable companies with high P/B would have outperformed the market since the 60s but would have underperformed profitable companies in general. On the contrary, picking cheaper High-Quality companies would have outperformed both the market and the overall High-Quality grouping. In other words, Quality Value has outperformed Quality Growth over the last 60 years in US equity markets. Looking at other geographies, such as Europe, we find similar results.
At WisdomTree, we believe that a well-constructed Quality strategy can be the cornerstone of an equity portfolio.High-Quality companies exhibit an ‘all-weather’ behaviour that offers a balance between building wealth over the long term whilst protecting the portfolio during economic downturns. However, in 2022, secondary tilts were incredibly important. Value stocks benefitted from central banks’ hawkishness, leaning on their low implied duration to deliver outstanding performance in a particularly hard year for equities. Among Quality-focused strategies, the one with Value tilt delivered outperformance on average, and the one with Growth tilt tended to underperform.
Looking forward to 2023, recession risk continues to hang over the market like the sword of Damocles. While inflation has shown signs of easing, we expect central banks to remain hawkish around the globe as inflation is still very meaningfully above targets. The recent coordinated communication plan by Federal Reserve Federal Open Market Committee members is a further example of this continued hawkishness. With markets facing many of the same issues in 2023 that they faced in the second half of 2022, it looks like resilient investments that tilt to Quality and Value that have done particularly well in 2022 could continue to benefit.
Sources
1 Source: WisdomTree, Bloomberg. From 31 January 2013 to 31 January 2023. Growth is proxied by the MSCI World Growth net TR Index. Value is proxied by the MSCI World Value net TR Index. Quality is proxied by MSCI World Quality net TR Index. The remaining 4 factors (Min Vol, High Dividend Small Cap and Momentum) are also proxied by indices in the MSCI families.

NN: Biggest daily H&S ever and €250 million new share buyback.After posting a more than 14% drop in 2022 operating profit (1.74bn), missing market estimates of 1.84 bn, and even though its operating capital generation (OCG) jumped 8% to 1.71 billion euros last year mainly thanks to higher interest rates and a strong business performance of the Netherlands Life and Insurance Europe segments; the company is shaping the biggest H&S pattern I have ever witnessed in a stock.
Besides, NN also announced a new share buyback programme of 250 million euros. Will they implode due to share buybacks that will materialise into negative returns in the near future?
At this pace, all those companies doing share buybacks will be the most damnified of the market due to an increased own capital at the wrong time. And it is a pity because this company has really attractive fundamentals, but after the operating profit miss in 2022 and the imminent recession all media is talking about, it is currently very risky to invest in it. But I will keep it in the radar as 35.6€ is the first support while 45€ is the first resistance.

SPX500 2023 FORECASTlisten up bros. Seeing is believing and you better believe the forecast you've been searching for all year has come to your doorstep begging you to take advantage of it. Dates and PT are close estimates. There will be NO forecast more accurate, so don't bother comparing. No thanks needed

25 year monthly study of ESAnnotations included on the chart:
This chart is essentially demonstrating just how far the market is capable of pulling back. The chart includes key levels and the years of notable highs / lows as well as + / - rejection boxes showing where price pivots as well as how perfectly, years later, price is capable of traveling far distances to perfectly tap back into an old rejection block. Most notably the 2020 pullback that perfectly filled the small rejection block created when price was finally able to make a break above in 2016.

Alt Coins in need of liquidity Let's skip the whole macro and interests rates stories.
The last crypto pump was pure market manipulation in order to floor the "whales" entry price.
It was a pretty big short squeeze caused by released of sell positions as seen on the derivative open interest.
Without explaining all the concept of liquidity, the market is in need of more cash.
The whole short squeeze leg left hanging a whole lot of orders, in what is called : gap.
Based on the common sell off pattern. I already took a short positions and I am waiting for a upside retracement to take another entry.
The imbalance or gaps can act as a S/R and these zones will acts as my T.P
Remember this : Market moves from liquidity to liquidity.
PSA.
Knowing how crypto moves in harmony between coins, I simply choose the charts that feelt more comfortable.

S&P 500 Are we about to drop it like it's hot?Tracking our wave count for the S&P 500 we could be about to drop hard this week, with CPI reports due out on Tuesday and the Fed due to deliver another hawkish statement on Wednesday we could be entering into the wave 3 of C which will be a very sharp move and will demolish a lot of wealth in a very short space of time. We will move away from the narrative of inflation peaking and into a new narrative of inflation not dissapating as quickly as hoped. In turn the Fed will have to keep interest rates higher for longer than anticipated (which they have signalled in the past few meetings). This is likely to scare investors out of stocks and into cash, namely the dollar. The 'bullish' move up that topped on the 1st of December was just a counter trend rally (completing wave 2 of C) and was designed as such to convice traders/investors that the bottom is in and we are heading to new highs, drawing in the bulls only to swing rapidly to lows not seen since the covid crash. We feel a conservative target for this wave 3 of C would be circa 3200, a very nice 750 points of profit from current prices.

AUD/JPY BUY VIDEO ANALYSIS 300 PIPSFrom the previous breakdown we price now respecting the fib and counter trendline and we could see this week a massive move to upside
Follow me for breakdown like this

A Recession vs a Bearish Correction The bitter memory from 2008 still persists in our minds, or at least in the minds of those who witnessed first hand what a Great Recession is. In 2008 many variables were set and many gears were in motion. Long story short, even though the media has attempted to call a recession, or to spread the fear of the bear among the people, which technically yes, it is a bear market by definition, it is not a recession, just yet.
We’re in a hiking rate environment, and still the major indexes have managed to find support on the long term moving averages. Comparing the levels and the moving average crosses today and in 2008, the main difference we find is the levels did cross down and the trend was officially bear. Afterwards a capitulation took place and the macroeconomic variables changed to provide the environment for a rebound and a reversal which gave birth to this secular bull market.
We’re not at the capitulation level, the volume has been steady and we’re on the bullish side of the trend. What did we just witness? A bear leg, basically a painful correction. The indexes are turning to the upside, the market took profits and the VIX scratched above the 20 level. We’ll probably see more selling because we’re in the take profit part of the short term cycle. We’ll see how deep the market is willing to dive, but the positive momentum divergence and the back to the green of the indicators show the intent to go for a bullish leg.
The target area is at the 4500-4600 level.

Crypto Market Cap - The Cycle TrendBeing on the same channel, hypothetically, the Crypto Market Cap might lose more than 50% with the ongoing recession in the next 2 quarters to have 400-700 Billion in the market cap before the market starts flourishing again in mid-late 2023 ahead of the new cycle of 2024.

Disney pops on earningsDisney had a nice rally. Its the rally we have been waiting for.
Finally hitting and fulfilling our upside target we are now accumulating a swing short on Disney.
The level was hit in the post market session and has pulled off the highs nicely.
We telegraphed this trade to our subscribers and were already in the money.

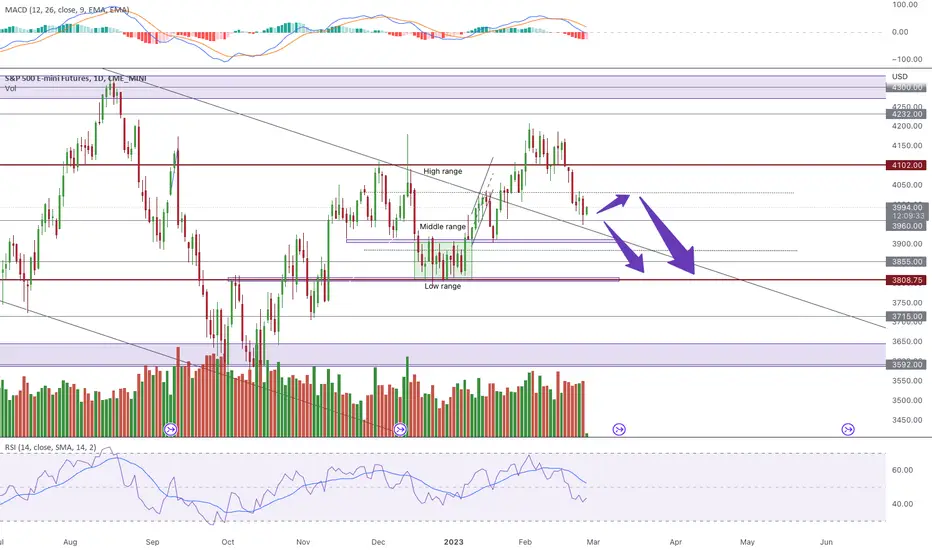
SPY Uncertainty High as Trends CollidePrimary Chart: S&P 500 (SPX) as represented by SPDR S&P 500 ETF (SPY)
1. SPX and Recession
A recession is exceedingly likely in the near future. It could officially begin next month or in 4 months. But does that mean bears should be rewarded by a straight-line decline to new lows? Sadly not.
Unfortunately for market participants, the S&P 500 S&P 500 ( SP:SPX / AMEX:SPY ) has confounded bulls and bears alike in recent months. Since June 2022 lows, SPX has traded substantially within the 3800-4000 range (380-400 SPY).
After last year's lows on October 13, 2022, SPX rallied hard into mid-December 2022, only to be rejected at its down TL from its all-time highs. Down trendlines are one way of gauging a trend, especially the more times that price touches the trendline and reverses, showing it is a valid and effective dynamic boundary for market prices.
When price was rejected from the mid-December 2022 highs (on December 13, the date of that month's FOMC presser), it fell rapidly into the 3800 SPX / 380 SPY range. Then it spent over two weeks within that range doing price discovery before breaking out and retesting the downward trendline (from all-time highs) this week. Many bulls called for 4100 SPX / 410 SPY saying the lows are in. Bears furiously covered shorts. Then bears were rewarded late this week as bad macro data started to be respected by the markets.
But will bears continue to be rewarded? Just because a recession looms does not mean prices must go straight to new lows. Yes, they might, and they could very well do so, especially with the Fed not backing off much at all. But price could also find a reason to squeeze shorts one last time before heading to new lows. Be prepared for anything.
2. VIX Signals
VIX told us earlier this week that the S&P 500 ( SP:SPX / AMEX:SPY ) was in a precarious spot. A multi-year trendline on VIX lies just below where it closed Friday, January 13, 2023. This trendline provides major support at approximately 16.80 to 17.00 on VIX, and VIX closed at 18.34, its lowest level in a year (specifically, the lowest level since January 2022 when SPX had just finished making its all-time highs).
However, VIX remains within a downtrend, subject to a trendline that has contained VIX levels since they made their most recent peak at mid-October 2022 lows. Until this downtrend is broken, clarity on the next trend leg in SPX will be difficult to find. In the VIX chart below, notice the yellow downward trendline containing VIX peaks more or less. And the pink line is the long-term upward TL that has provided long-term support.
Some say TA cannot be applied to VIX. Strong opinions exist on both sides of this issue. Some of the best technical analysts serving institutions apply TA to VIX, and others do not.
Supplementary Chart A.1
To those who are skeptical, SquishTrade would ask whether you would bet against the long-term upward TL each time VIX levels have reached it. In other words, would you sell vol when VIX fell to its very long-term uptrend line? Each time it has done so, it has moved back higher off that line. See Supplementary Chart A.2.
Supplementary Chart A.2
3. SPX Triangle
A triangle is a consolidation pattern. The Primary Chart above shows the current triangle that has formed. It is essentially a collision between a 3-month uptrend and a 13-month downtrend (lasting over a year since January 2022 highs). So long as price remains in this triangle, uncertainty about the intermediate term direction will likely remain high.
Many triangles have arisen this year, and each one has led to new lows. This one may as well, as the yield curves and macro data support this outcome. But price could whipsaw out the top of the triangle for a month or two before heading to lows. All possibilities remain on the table. Expert Elliotticians have continued to change their wave counts as the year has progressed. This does not mean they are bad at their craft—it simply may point to the challenging nature of the price action.
In the intermediate term, direction remains murky given the collision between these two uptrends. Ultimately new lows should be formed. But will a powerful rally rip higher to trap bears first? Will price action whipsaw around after a triangle breakout before figuring out a recession is coming and the Fed won't come to the rescue as quickly and spectacularly as in the past? These are the questions that many are trying to answer. This post contains no short-term directional bias—it's too close to call.
So despite the powerful rally off October 2022 lows, and despite the powerful rally off late December 2022 lows, and the rapid decline this week, price remains stuck in a very large triangle on the daily chart. See Primary Chart.
Notice how the edges of this triangle align in early February (right around the FOMC meeting) at key Fibonacci levels. See Supplementary Chart B.1 The smaller blue circles point to key pivot levels at 3800 SPX / 380 SPY and 4000 / 400 SPY. The larger blue circle shows the apex of the triangle and the (compressing) range it covers from 388 to 396 / 3890-3970 SPX, where price may remain for a bit longer.
Supplementary Chart B.1
Here is an additional chart showing the Fibonacci levels a little more clearly. The key .618 retracement of the August-October 2022 decline lies at 399.79 SPY / 4000 SPX. Above that, a .786 retracement lies at 402.85 SPY. These now are both outside the downward trendline. If the downward trendline is adjusted for the whipsaws in mid-December 2022 (yellow downtrend line chart below), these key Fibonacci levels could be tagged within the "adjusted" down trendline. To the downside, notice how multiple Fibonacci levels come in right at 380 / 3800 SPX. This seems to be a line in the sand, also from a support perspective. When 3800 is decisively broken, watch out below for a new low.
Supplementary Chart B.2
Note the 200-day SMA which has been widely discussed in financial media over the past week as it was tested yet again. This 200-day SMA is the magenta EMA in Supplementary Chart B.2.
4. Anchored VWAPs
The anchored VWAPs—anchored to key swing highs and lows since June 2022—align quite well with the lower boundary of the consolidation triangle discussed, especially as more time passes and that lower boundary (an uptrend line from October 2022 lows) rises. See Supplementary Chart C.1. The VWAPs show a support range of 3870 to 3900 SPX / 836-388 SPY. If these are broken decisively, watch out for the upward trendline as it may break too. If these are held, as they have been so far this week, uncertainty remains high.
Supplementary Chart C.1
VWAPs also show confluence with two key Fibonacci retracements, the .50 retracement and the .618 retracement of the recent rally from December 22, 2022 to January 17, 2023.
Supplementary Chart C.2

$ZN_F: Bonds have bottomedI think we have a low risk trade here, buying bonds until March 17th or so. Weekly trend is up, until said date, and could after that form a new consolidation and new continuation pattern over time if my view here is correct. Definitely a good idea to have some exposure to bonds, I personally opted for buying OTM calls to ride this signal, but you could use futures or ETFs as well (or just buy the actual bonds).
Best of luck!
Cheers,
Ivan Labrie.

Bitcoin long term outlookFirst outlook on previous analysis turned out to be wrong, but the overall idea is very much valid: BTC is now hanging around supply area/886 retracement level and losing momentum, RSI showing heavy divergence.
I wouldnt't expect prices to go balistic in 2023 with recession coming and goverments doing all kinds of crazy stuff.
This could very well be the top of the "bull trap", "fake out" or however you wanna call it.
In case we break 25k, 30k would be pretty much guaranteed, but i still excpect a sub 10k Btc within the year.
Remember the market will always gear towards the maximum amount of loss for the max amount of people, I would argue that a sub 10k BTC would be almost a sure thing if we get to 30k as the top of the fake out, just cause it would be such a loss for most people.
Always working level by level and taking action based on what the market tells me and not my feelisngs.
I would only enetertain the possibility of the bottom having been 15k if we break above 30k, until then this is the plan.

Can Dow Jones Rise Above Falling Trend Line?It's FOMC day! The markets have already priced in the 25bps rate hike so Powell's speech will be the most important thing today. A dovish Fed can help Dow Jones break the falling trend line and finally see acceptance above the resistance level of 34000. While I'm expecting a dovish speech from Powell today, the inflation fears are slowly fading away and recession fears are taking over, so in this environment, it's best to trade with minimized risk on stocks.
