Apple Inc. (NYSE:$ AAPL)Drops $300B+ in Tariff- Fueled Sell-OffApple Inc. (NYSE:$ AAPL) faced a massive sell-off on Thursday, April 4th 2025, with its stock closing at $188.38, down $14.81 (7.29%). This marked Apple’s worst trading day since March 2020. The steep drop came after former President Donald Trump announced a new set of tariffs targeting 185 countries, including major U.S. trading partners.
As a result, Apple’s market capitalization fell by more than $310 billion in a single day. These newly imposed tariffs, effective April 9th, include a 10% blanket duty on all imports, with higher rates applied to specific countries. China, Apple’s primary manufacturing hub, will face a combined 54% tariff—34% newly imposed, added to an existing 20% rate.
Other affected regions include the European Union (20%), Vietnam (46%), Taiwan (32%), and India (26%). Analysts consider Apple especially vulnerable to these policies due to its heavy reliance on overseas production, especially in China, where nearly 85% of iPhones are manufactured.
According to Dan Ives of Wedbush, future exemptions to these tariffs may depend on Apple’s efforts to localize its operations within the U.S., a move hinted at by the company earlier this year. However, no details have been confirmed regarding whether Apple’s U.S. expansion plans will qualify for tariff relief. The timing of the policy combined with Apple’s exposure to international supply chains, led to a bear shift in market.
Technical Analysis: Apple Breaks Below Key $197 Support
Apple’s price action shows an impulsive breakdown below the key $197 strong support level. The price is currently trading around $188, trading towards next support at $167 as the immediate support.
A drop below $167 could push the stock lower to a long-term support around $125, which was lastly retested in Dec 2022. On the upside, any recovery would first need to reclaim the broken support at $197, which now acts as resistance. The all-time high around $260 remains far away from reach unless the overall stock market sentiment improves.
Looking ahead, the chart outlines two likely scenarios. In the bullish case, Apple may find support around $167, bounce back and attempt to break above $197, possibly re-establishing it as a support zone.
In the bearish case, failure to hold $167 could push the stock lower to test $125, and if that level breaks, the price may continue downward. The current market outlook suggests a wait-and-see approach, to what happens at key level, as both macroeconomic news and technical levels continue to drive Apple stock lower.
Recession

Goldman Sachs Raises Recession Odds to 35% Amid Tariff Fears Goldman Sachs (NYSE: GS) has lowered its S&P 500 year-end target again. The firm now sees the index ending at 5,700 points, down from its earlier forecast of 6,200. This revision comes just days before President Trump’s new round of tariffs is set to begin. The updated target implies only a 2% gain from Friday’s close of approximately 5,597.
Chief U.S. Equity Strategist David Kostin pointed to rising tariffs and slowing economic growth as key concerns. The revised forecast reflects a cautious outlook in light of economic risks. This is the second time Goldman has slashed its target this month.
At the same time, Goldman Sachs has raised its 12-month recession probability to 35%, up from a previous 20%. Chief Economist Jan Hatzius explained that higher tariffs and softening economic data contributed to the decision. Goldman now estimates the average U.S. tariff rate will rise to 15% in 2025, compared to an earlier projection of 10%.
Alongside these changes, the bank has cut its Q4 2025 U.S. GDP growth forecast to 1.0% from 1.5%. The adjustment follows weakening household and business confidence. Recent White House comments also suggest officials may accept short-term economic strain to pursue long-term trade objectives.
These developments reflect growing concern across Wall Street. Goldman’s 5,700 target ranks among the lowest of major forecasts. With markets already on edge, the new projection underscores broader fears over trade tensions and economic resilience.
Technical Analysis: Bearish Momentum Below $500
The S&P 500 has turned bearish after falling below a key support at $510. This level had held firm previously but now acts as resistance. The break and close below the key level signals strong bearish pressure and there is a possibility of more bearish momentum.
Price is currently trending lower towards the next potential support at $440. If it breaks below it, further drop could follow. The bearish pressure may continue unless the bulls defend the key support level.
However, if the bulls can finally defend the $440 level, it could potentially recover and target $510. In that case, the first resistance to overcome is $510. If it is also broken above, the next target would be the $592 resistance zone. A break above $592 could revive bullish momentum.
As of April 4th 2025, Goldman Sachs stock closed at $21.74, down 1.50% on the day. Investors await further updates ahead of the earnings report due April 14th 2025.

HOLY MOLY! ARE WE IN A RECESSION? $TSLA $120 BEAR FLAG PATTERNA bear flag trading pattern is a technical analysis formation that features a downward-sloping flagpole, followed by a consolidation phase forming a parallel channel. This pattern suggests a potential sharp decline or continuation of the downward trend
I also notice a head and shoulders pattern, as well as an inverse cup and handle.
Everything points to $120.
Sell/Short NASDAQ:TSLA right now with fact check:
+brand reputation risk, high competition, loss of EV market leadership, cyber truck/ product recalls, declining sales with lower margin, stock volatility concern, insider selling, investors buy it based on expected future earnings rather than its current profitability.
+ potential stagflation, tariff war, slow economic growth, inflation, rising public debt, geopolitical tensions, ai bubble, and more

US Recession Imminent! WARNING!Bond traders are best when it comes to economics. Stock traders not so much.
As the chart shows, historically, when rates bunch up, what follows is a recession. During the recession, the economy tries to fix itself by fanning out the yield curve, marking it cheaper to borrow and boosting the economy.
The best time to be buying up stocks and going long the market is when the yield curve is uninverted and fanned out wide—not when it is bunched up like this.
My followers know this is my first warning of a recession since FEB. 2020.
WARNING! Things can get ugly from here very quickly!

USOIL: Key Levels and Bullish Prospects Amid Trade War ConcernsGood morning Traders,
Trust you are doing great.
Kindly go through my analysis of USOIL.
USOIL is currently experiencing market imbalance due to the nature of its opening range, following a gap-down decline last night in response to trade war concerns that have fueled recession fears. The price dropped from its weekly high of 72.22 to a key support zone at 69.00, which is near the week's low. As we anticipate the release of the ISM Services PMI at 3 PM GMT+1, I expect the demand zone to hold, driving the price higher—initially to fill the gap and subsequently toward the 71.35 region. Furthermore, this outlook is strengthened by the formation of a bullish Bat pattern on the M30 chart.
The key levels I will be monitoring for potential price action include the previous week's high at 70.10, the five-week high at 70.62, and the 71.35 region. These areas represent significant resistance levels that could be tested as price moves upward. A break below 68.80 will invalidate this outlook.
Cheers and Happy trading.


$NQ CorrectionPrice clearly is going towards Sellside Liquidity.
The standard deviation shows -2 to -2.5 is where price would reverse from and its also aligned with Sellside liquidity.
Idea: Bearish.

$BTC HTF IdeaLooks like the starting of "Major Correction"
If the price goes above $93k, there are chances CRYPTOCAP:BTC could make a new ATH, if not 40s seem to be the bottom before the next rally.
Neutral Thoughts.

Theory.This is just a theory about CRYPTO:BTCUSD
I think we’re going to see a lot of global economic problems in the near future. THEY will try to preserve THEIR capital with gold and Bitcoin, as the stock market stagnates.
I believe we’re in the BUBBLE RUN, but the key question remains open: “At what stage of the BUBBLE RUN are we?”

Recession searches spike on Google!!Good day traders and investors.,
The term recession has had a few spikes over the years since Google has been around, but what does it mean? These searches are typical made by the common folks.
Did the herd get it right this time?? Probably not, I have generally bet against them. The Google search trends has the data to back the information. Generally this means the bottom is either in or close. Also on two occasions there have been a couple of back to back spikes. Almost like one was a precursor.
You can see very clear in this naked chart of the DOW JONES, that only includes the GOOGLE TRENDS search of the term “RECESSION”. I have time aligned the GOOGLE TRENDS data to the DOW JONES it really shows a clear picture. The herd is always a day late and a dollar short. By the time they are searching it most of the pain is gone and the market is at or near a bottom. The only question that remains is, how long? If it lasts too long it could hurt any forward movement.
Let me know what you think
Kind regards,
WeAreSat0shi

Target | TGT | Long at $105.75Target NYSE:TGT
Strengths:
P/E: 11.82x
Earnings are forecast to grow 4.95% per year
Dividend: 4.24%
Better "value" compared to others (i.e. NYSE:WMT )
Insiders recently awarded options
May have double-bottomed (see weaknesses below...)
Weakness
Economic headwinds / recession concerns
Debt-to-equity: 1.09x (slightly high)
Several price gaps on the daily chart are open below the current price. If recession fears are valid and news to messages "tighter consumer spending", these gaps will likely be filled (all the way down to the GETTEX:50S ). One day these will be filled, but that would be a huge opportunity for long-term investors...
Thus, at $105.75, NYSE:TGT is in a personal buy zone.
Targets
$119.75
$137.00
$150.00

Credit Spreads - About to Blow?While credit spreads, which reached near-historic lows in 2024, remain tight, they have widened notably since the beginning of 2025. If this trend accelerates, it could put substantial pressure on the bond market, resulting in tighter financial conditions and corresponding headwinds for the domestic economy. The last 2-3 weeks have seen risk assets come under pressure, but the below chart suggests that the risk-off sentiment shift may still be early-stage... Whether viewed through a traditional technical lens or supply/demand, current levels could be considered supportive - risk is to the upside.
A few impacted ETFs: NASDAQ:IEF , NASDAQ:TLT , AMEX:HYG , AMEX:JNK
Jon
JHartCharts

ETHEREUM SHORT TO $786! (UPDATE)ETH keeps on dumping😉
That's the power of Elliott Wave. We can see from our analysis that ETH remains within a 3 Sub-Wave (A,B,C) corrective channel. From naked price action we can still see that price remains bearish. Wave C target still remains around $786🩸

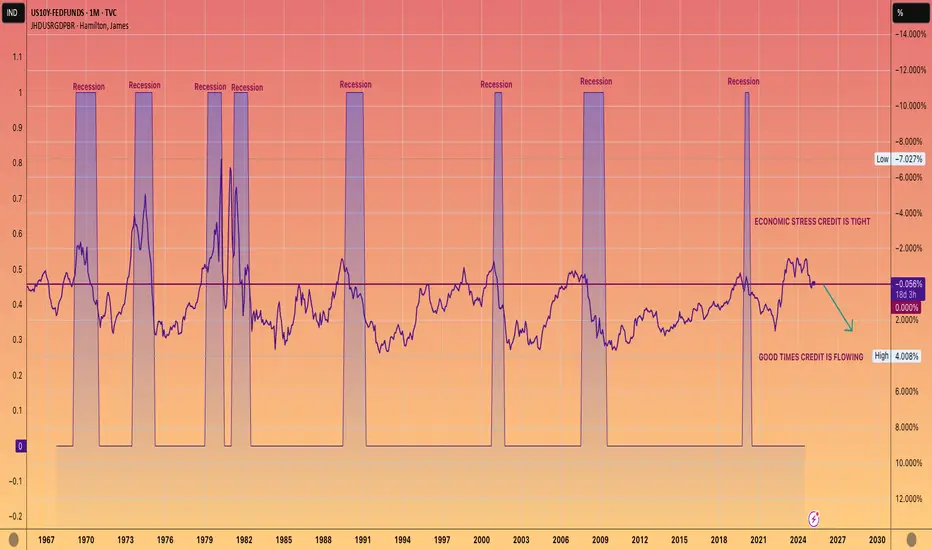
WE ARE COMING OUT OF A RECESSION. NOT GOING INTO ONE.This chart shows 10-year yield, which is closely tied to mortgage rates, minus the Federal funds rate.
When this figure is negative, it typically indicates that we are experiencing a recession or economic downturn.
Conversely, a positive number usually aligns with economic growth, often referred to as the good times.
While it's up to you to determine the reasons behind a official recession not being declared during the Biden administration, the undeniable data reflects a prolonged period of economic strain.
However, the current trend seems to be shifting towards a positive reading, which should lead to more accessible lending and economic growth.
AKA The good times are coming.
SPX to dump 30% - 50% for Inflated Expectations in 2026I like to say the narrative follows the price . This was bound to happen after such an overheated year, couple years. Blame whomever you want, in the end its your wallet if you aren't ready to have your expectations met.
Best case scenario, the breakout of macro is confirmed after the retest (blue arrows). Worst, more likely case, it smashes down to confirm a double bottom with a strong foundation to form a macro support. The sawtooth can provide opportunities for volatile scalps, but its gonna get gnarly I can already tell.

EURUSD PoVIn recent months, inflation data in both Europe and the United States has shown contrasting trends, creating an uncertain outlook for the EUR/USD pair. In Europe, inflation has remained relatively stable, but with signs of a slight increase, while in the United States, there has been a more pronounced rise in consumer prices. This scenario has prompted the European Central Bank and the Federal Reserve to carefully assess their respective monetary policies, with potential interest rate hikes in the future. At the same time, recent trade policies under U.S. President Donald Trump have added further volatility to the currency market. In February 2025, Trump imposed significant tariffs on imports from Mexico, Canada, and China, raising global concerns. The European Union criticized the Trump administration for not engaging in negotiations to avoid such tariffs, increasing trade tensions. Trump's actions, including the introduction of a universal 10% tariff on all imports and a 100% tariff on cars produced abroad, have raised questions about their effectiveness in strengthening the U.S. economy and reducing the trade deficit. If these policies do not produce the expected results, we could see the dollar weaken, with the EUR/USD pair potentially surpassing the 1.09300 level, a liquidity intersection point. On the other hand, if Trump's measures prove effective in improving the trade balance and supporting the economy, the dollar could strengthen, pushing the EUR/USD pair towards parity. In summary, the future direction of the EUR/USD pair appears uncertain, influenced by central bank policies and U.S. trade strategies, with potential significant movements depending on the effectiveness of these measures.

BTC PoV The projection of a potential rise in Bitcoin (BTC) starting from liquidity points at 75K, 65K, and 57K suggests a recovery dynamic from a bearish phase. If BTC were to rise above the 75,000 USD level, it could trigger a significant bullish push, as this is an important resistance level that, once broken, would open the way for new highs. This would mark the end of a correction and the resumption of the bullish trend. On the other hand, if the price were to drop to 65,000 USD, this level could represent an accumulation opportunity, with a potential recovery from this zone, confirmed by an upward movement. In a worse-case scenario, if BTC were to fall to 57,000 USD, it would be a key support level, a zone where the market could attempt a rebound. If the buyers' response were positive, BTC could find the strength to rise again and resume its bullish trend. Essentially, the liquidity points at 75K, 65K, and 57K are critical levels in determining the future direction of BTC, with a potential recovery depending on the market’s reaction to these supports and resistances.
In parallel, a potential recession in the United States could directly impact the value of the dollar, with significant implications for Bitcoin. During a recession, the Federal Reserve's monetary policies could become more accommodative, with interest rate cuts to stimulate the economy. This increased liquidity could drive investors toward assets like BTC, as Bitcoin is seen by many as a hedge against inflation and the depreciation of the dollar. If the recession were to weaken the dollar, BTC could benefit from increased demand for cryptocurrencies as an alternative to the traditional monetary system. However, if the Fed were to counter the recession with policies that strengthen the dollar, possibly to attract foreign investments, the price of BTC could suffer, as a stronger dollar might reduce Bitcoin's appeal as a safe-haven asset. In conclusion, BTC's future direction depends not only on its technical levels but also on global economic policies and macroeconomic dynamics, which could favor a BTC rally if the recession weakens the dollar, or slow its growth if the dollar maintains strength.

Start of bearish cycle for equities $SPXSP:SPX confirming trend reversal on high time frame as it attempts to breach the 50 weekly MA for the first time since the start of the 2022 bear market. Macroeconomic environment is full of uncertainty and recession signals, with POTUS Trump openly confirming that some short term pain in assets is needed for the US economy to reset and go on a better path forward.
GLOBAL RECESSION IS COMING!The chart provided depicts the **US Dollar Index (USDOLLAR)** on a monthly timeframe, highlighting a bearish outlook. The analysis suggests a significant downturn in the value of the US dollar, which could have profound implications for the global economy. Here's a breakdown of how this scenario could lead to a global recession:
Key Observations:
1. Lower High Formation : The chart shows a lower high forming after a previous peak, signaling potential weakness in the dollar's long-term trend. This aligns with bearish market structure, indicating that sellers are gaining control.
2. Fair Value Gap (FVG) : The annotation mentions that a "Monthly FVG" has been respected. FVGs are imbalances in price action often revisited before continuing the prevailing trend. In this case, the FVG rejection reinforces the bearish continuation.
3. Projected Downtrend: The red arrow projects a steep decline in the US dollar's value, suggesting a collapse or sharp devaluation over the coming months or years.
Implications for a Global Recession:
1. Weaker Dollar and Global Trade : As the world's primary reserve currency, a collapse in the US dollar would disrupt global trade and financial systems. Countries heavily reliant on dollar-denominated trade or debt would face increased costs and financial instability.
2. Debt Crisis in Emerging Markets: Many emerging economies hold significant amounts of US dollar-denominated debt. A devalued dollar could lead to capital flight, higher borrowing costs, and defaults, triggering financial crises in these regions.
3. Commodity Price Volatility : Since commodities like oil and gold are priced in dollars, a sharp decline in its value could lead to extreme volatility in commodity markets, further destabilizing economies dependent on imports or exports of these goods.
4. Investor Panic and Market Sell-Offs : A collapsing dollar would likely trigger panic in global financial markets. Investors may flee to other safe-haven assets like gold or cryptocurrencies, leading to sharp declines in equity markets worldwide.
5. Global Economic Contraction: With trade disruptions, financial instability, and market volatility, global economic growth would slow significantly. Central banks might struggle to stabilize their economies due to reduced policy effectiveness amid currency turmoil.
Conclusion:
The chart's bearish projection for the US dollar suggests that its collapse could act as a catalyst for widespread economic instability, potentially leading to a global recession. This scenario underscores the interconnectedness of currencies, trade, and financial markets in shaping economic outcomes worldwide.

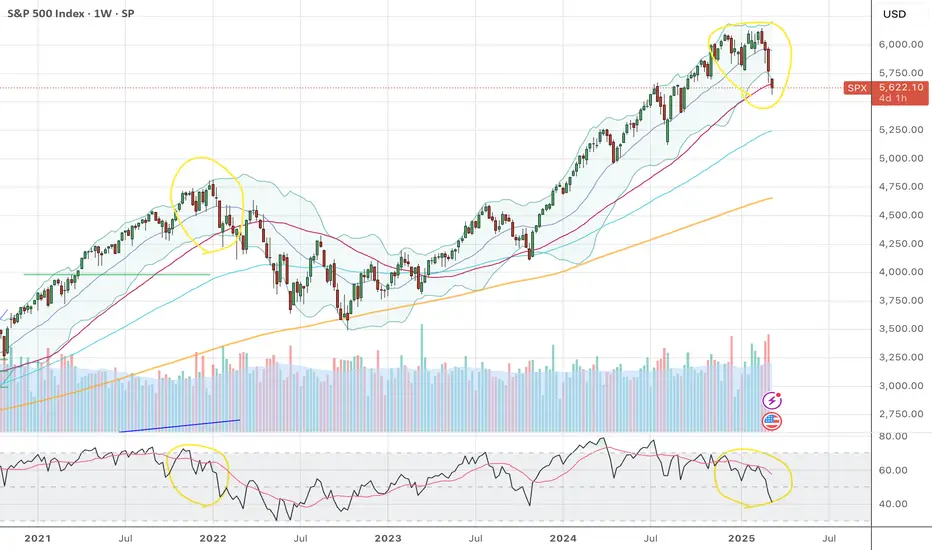
S&P 500: Rejection at Resistance and Potential Downside RisksThe chart shows a clear rejection from a key resistance zone around 6,150 points, highlighted by the red area. After an attempt to break through, the price faced strong bearish pressure, falling back below the 6,100 level. The current retracement has led the price to test the 50-day moving average (yellow), which has so far provided temporary support. However, breaking this structure could increase the risk of a sharper decline toward the intermediate support at 5,924, marked by the dashed yellow line.
Recent macroeconomic releases, such as the decline in retail sales and weakening consumer confidence, are weighing on market sentiment, increasing pressure on stock indices. Additionally, uncertainty related to tariffs proposed by the U.S. administration is adding volatility, with investors showing signs of risk aversion. If the price fails to quickly recover the 6,100-6,150 area, the next bearish target could be the more structured support zone at 5,850-5,800, identified by the lower blue area.
In summary, the technical structure reflects a moment of uncertainty with a clear rejection from the weekly resistance. A recovery above 6,100 could bring buyers back in control, while further weakness would open the door to new declines toward lower support levels.

SPX Final Blow Off TopSPX going through it's final peak euphoria wave before the final blow off top in my opinion. Recession is coming as indicators such as Sahm Rule, Inverted Yield Curve are predicting a recession. The FED is blindsided by a dead cat bounce in inflation and will find themselves in a position to cut rates insanely fast.

META run almost finished? Just a little fun and brainstorming with higher time frame charts. Utilizing RSI, patterns, and time cycles.
Lots of similarities between now and the 2020-2021 bull run. Not to mention a lot of good data suggesting we are close to a recession at best. (Weak housing data/stocks, yield curve uninversion)
What are your thoughts?

SPY Top: US Federal Reserve Emergency Rate Coming SoonI think it’s pretty clear we have avoided a recession (Jerome, Powell, 12/18/24).
One last final high on the stock market before the recession is coming in my opinion.
