SPY FLUSH, EOY TARGET 230This is the exact same trend line which flushed the markets with the VOLADROP in 2008. Compare and Enjoy.
Pray if you hold any asset : stock, crypto, car, house, chicken
VIX 80
SPY 230
BTC 10K
DXY 110
short on confident break.
Recession

Big resistance ahead of 10 Year T-notes future After hitting a major weekly suport level, the market starts to break the downtrend structure on H4, making a new higher low, that can show a possible reversal of prices since stocks are going downtrend and investors are going for the treasury notes and bonds...

A Fork in the Road: How Will the Recession Affect Crypto?The more positive way of looking at LUNA, and other crypto disasters in general, is that these sorts of systemic problems eventually all get caught as the foundation falls underneath.
In fiat, these sorts of issues get covered up, bailed-out, and hidden behind tools like quantitative easing as people get pushed out into the streets through inflation and housing scarcity and such. It's a more socially acceptable form of exploitation in a way - with the worst of them actually dipping into taxpayer money and public funds. Just ask the exploited classes about this stuff - they know all about it.
Keep in mind that Bernie Madoff was able to get away with his racket for 17 years because the market generally always kept on going up. When the recession hits, we're going to start seeing the ugly undersides of what's been going on in fiat, too. Ponzi schemes are not exclusive to crypto, and there's a lot of pot calling the kettle black arguments floating around, especially in finance. The guilty conscience often attacks what they themselves are doing.
The big question for crypto holders is what happens when the recession hits - there's primarily two different types of outlooks in the space right now.
The pessimistic outlook is that when fiat goes down, so does crypto, as it has typically done for most of its runs.
The optimistic outlook is that Bitcoin itself was born out of the recession and controversy of 2008, where it has experienced the biggest of its returns.
Both are true, but how 2022 turns out will largely depend on how secure people are feeling about their money in general.
A couple of things that make the economy of the US today unprecedented, compared to recessions in the past:
- A historic 8%+ inflation rate which has not yet shown signs of slowing down.
- Interest rates will likely be raised to the highest it's been in recent history (possibly 3%, but likely higher).
- A massive 36% increase in money supply since 2020, mostly gone to government spending relating to COVID.
- High costs of living and new remote work options driving record amounts of people out of the cities (where the housing prices are the most inflated).
- The US government has been in massive debt for a while and have been using "fixes" like quantitative easing to kick the can down the road. It's been relying on money printing and taxing capital gains in order to pay off its bills but if the economy goes into a recession, that will no longer be an option.
Some people say that this is the "day of reckoning" for the US economy coming that has long been overdue. Which way will the tides swing for crypto and Web3? Time will tell.

NQ Power Range Report with FIB Ext - 5/19/2022 SessionCME_MINI:NQM2022
- PR High: 11923.25
- PR Low: 11883.75
- NZ Spread: 88.50
Evening Stats (As of 12:05 AM)
- Gap: = N/A
- Session Open ATR: 456.33
- Volume: 42k
- Open Int: 251k
- Trend Grade: Bear
- From ATH: -29.0% (Rounded)
! GETTING CLOSE TO THE 'MAGICAL' -30% !
Key Levels (Rounded - Think of these as ranges)
- Long: 14105
- Mid: 12960
- Short: 11820
Keep in mind this is not speculation or a prediction. Only a report of the Power Range with Fib extensions for target hunting. Do your DD! You determine your risk tolerance. You are fully capable of making your own decisions.

SPX/USD Weekly TA Cautiously BearishSPX/USD Weekly cautiously bearish. * CPI continues to go up since April 2020 (and for some commodities like bread, milk and oranges since mid-2019), Finland and Sweden officially apply to join NATO , the Fed remains committed to increased funds rate to ring in inflation, mid-term elections in the USA are underway and Republicans currently have a slight lean , supply chains are still getting battered by Russia/Ukraine & China lockdowns -- the overarching theme for equities remains a return to true value.* Recommended ratio: 30% SPX, 70% cash. Price is currently testing $3950 minor support for the second consecutive week. Volume remains moderate and is on track to favor sellers for seven consecutive sessions. Parabolic SAR flips bullish at $4652. RSI is currently trending down slightly at 32 as it approaches 25.26 support ( which would coincide from the uptrend line from October 2008 ). Stochastic remains bearish and is currently trending sideways at max bottom; a break above 4 would lead to a bullish crossover. MACD remains bearish and is currently trending down at -104 with no signs of trough formation; the next support is the ATL at -125.20. ADX is currently trending up at 29 as Price continues to fall, this is bearish. If Price is able to defend $3950 minor support, the next likely target would be a test of $4167 minor resistance. However, if Price breaks down here then it will likely retest $3722 support for the first time since March 2021. Mental Stop Loss: (one close above) $4167.

Tesla 22'-23' Forecast (Fibonacci Analysis)Base Case:
US Equities are experiencing broad base revaluations due to excess demand in the markets from the 2020 Stimulus. As a result, current markets are survival of the fittest & higher interest rate environments do not suit equities. I believe the markets are currently pricing in the highly anticipated two 50bps (FEDS FUNDS RATE) on June 14-15 & July 26-27 giving stocks room for the final bull rally (End of June - Q1 23') to begin the inevitable bear market, or "hard-landing". (Q2 23 - TBD).
I believe the risks of a recession in 2023 are 7/10.
Idea:
(Long)
Entry Price: ~$700.00
Entry Date: ~June 24, 2022 (Mid-to-late)
Price Target(s): $1,150.00, $1,250.00
Date Target(s): Mid to Late August, Q4 22' - Q1 23'
(Short)
Entry Price: $1,150.00, $1,250.00
Entry Date: Mid to Late August, Q4 22' - Q1 23'
Price Target: ~$660.00
Date Target: ~June 26, 2023 (Mid-to-late)

SPX Forecast 22'-23' (Fibonacci Analysis)Notes:
Expecting financial markets to rally amid FOMC summer hikes.
Entering "Complacency" (June 06, 2022 - Feb 2023) in market cycle.
Entering "Anxiety" (Nov. 2022 - Oct. 2023) in market cycle.
Hedge Idea
(Long):
Entry Price: $3,923.00
Entry Date: June 06, 2022
Price Target: $4,500.00
Date Target: Nov. 2022
(Short):
Entry Price: $4,500.00
Entry Date: Feb. 06, 2023
Price Target: $3,600.00
Date Target: Oct. 2023

SPX Recession Looming StrongerAs we approach critical crossroads for where markets are headed let us have a small recap of how we got here.
Here is my SPX post I published on March 23rd. Price has finally hit support in the chart. See for yourself:
Something odd though is that NDQ (Posted on March 22) has not reached this same type of long term support:
If we simply compare the 2020 Boom VS Now:
(2020 Boom)~SPX already corrected 35%~Low inflation~Growing Economy~FED cut Rates to 0%~FED QE~10 FED Term Sheets~Commodity Abundance~No Wars~No Sanctions~No Pandemic~No World Food Crisis
(Now) ~SPX corrected only 19%~HIGH Inflation~Slowing Economy~FED Raising Rates (Potentially 8 Hikes)~FED QT~No FED Term Sheets~Commodity Scarcity~Russia/Ukraine War~Sanctions~Pandemic (China with No Covid Policy Lockdown)~World Food Crisis
Now that Price has tested 13-year support, what's next?
Well, the answer isn't always so simple.
If things continue on this same path or even worst, begin to unravel further, this is a very reasonable outlook if faced with a Global Recession.
More interesting still, look at Elon Musk's tweets that seem to have perfectly timed the top.
Is that a really strange coincidence or does he have access to information we don't?
Anyways to further drive a few points we also have Soaring Energy or more specifically Oil . I will leave this here for reference. The post explains the situation quite well:
Another thing to consider is the US Yields and its correlation with the stock market: We have seen both a yield inversion and steeping of yields which has been the precursor for the last 6+ recessions.
The last thing two things ill leave off on is the World Food Crisis and one last thing about US Treasury Yields.
Here is Wheat Futures in comparison to just before the GFC in 2008:
And the US Treasury Yields in relation to the previous stock market recession/crashes:
This post is not necessarily a prediction, but rather just an acknowledgment of its potential.
If we do see a World Wide Recession play out, this is a very realistic outlook in my opinion.

SPX/USD Daily TA Neutral BullishSPX/USD Daily neutral with a bullish bias. Recommended ratio: 60% SPX, 40% cash . Price is currently trending up at $4000 (after bouncing off of $3938 minor support) as it looks to test the lower trendline of the descending channel from August 2021 ($4100) for the first time since breaking down out of it. Volume remains moderately high and is on track to break a two day streak of buying if it is able to close today in the red. Parabolic SAR flips bullish at $4175 resistance, this margin is mildly bullish. RSI is currently trending sideways and testing 38.06 resistance. Stochastic remains bullish and is currently trending up at 28; it is still technically testing 18.32 resistance. MACD is slightly trending up at -112 and would need to break out above -97 for a bullish crossover. ADX is currently trending sideways at 27 as Price is bouncing from a minor support, this is neutral at the moment. If Price is able to continue with this bounce then it will likely test the lower trendline of the descending channel from August 2021 at $4100 as resistance before potentially testing $4175 resistance. However, if Price falls back down here, it will likely break down below $3938 minor support and potentially test $3508 support. Mental Stop Loss: (one close below) $3938.
**Seeing that QT is only just beginning and we are arguably already in a recession, it is recommended to be vigilant (and perhaps even conservative) with bullish trades in these market conditions**

BTC/USD Daily TA Neutral BearishBTC/USD Daily neutral with a bearish bias. Recommended ratio: 40% BTC, 60% cash. Price is currently retesting the uptrend line from March 2017 at $29k as support after breaking back down below $30507 support. Volume remains moderate and is currently on track to end the three day streak of buyer dominance if it is able to close today in the red. Parabolic SAR crosses bearish at $25409, this margin is neutral at the moment. RSI is currently trending down at 32.71 after forming a peak at 36; the next support is at 25.60. Stochastic remains bullish and is currently trending up at 37; it is still technically testing 29.70 resistance. MACD remains bearish and is currently trending sideways at -2848; it is still technically testing -2497 support. ADX is currently trending up slightly at 42 and appears to be forming a peak as Price is attempting to defend this critical support; this is mildly bearish. If Price is able to establish support at $30507, then the next likely target is a test of $36258 minor resistance. However, if Price loses support here (and at the uptrend line from March 2017), then the next likely target is a test of $24180 and potentially lower. Mental Stop Loss: (two consecutive closes above) $30507.

EU Forecast (Spectral & Fibonacci Analysis)Current Price: 1.04
Target Price: 0.99000
Target Date: Q4 2022 (6 month)

Crypto Outlook (Spectral Analysis: BTC) Accessing The Risks of BTC
~ Sensitive to US interest rates
~ Correlation to SPX
(Is BTC a measure of Global GDP?)
~ Communist Objectives
(Finding solution to overthrow USD?)
~ Regulations
~ Global Adoption
SPX WAVE AND TREND ANALYSISBe sure to stick to Stop Lost and TAkE Profit. This is an idea and not a bargain offer
This is just idea, not trading advice, use at own risk.
reasons:
It is recommended to buy in this price limit
It is mandatory to pay attention to the stop loss and the target marked on the chart
Do not be greedy and adhere to the specified principles. I hope you will be profitable
Note that there is no 100% analysis and it is possible to stop flirting
This is a personal analysis and you should not enter into a transaction without review
If you know this, make a purchase
Be sure to adhere to the principles of capital management and do not invest more than 2% of your capital in each transaction.
High-risk individuals can enter a maximum of 5% of risk capital in this transaction by accepting risk-taking.
This analysis has been analyzed with the classic Elliott topics and neo wave style. Also, the principles of price action have been used.

NASDAQ INDEX TREND AND WAVE ANALYSISBe sure to stick to Stop Lost and TAkE Profit. This is an idea and not a bargain offer
This is just idea, not trading advice, use at own risk.
reasons:
It is recommended to buy in this price limit
It is mandatory to pay attention to the stop loss and the target marked on the chart
Do not be greedy and adhere to the specified principles. I hope you will be profitable
Note that there is no 100% analysis and it is possible to stop flirting
This is a personal analysis and you should not enter into a transaction without review
If you know this, make a purchase
Be sure to adhere to the principles of capital management and do not invest more than 2% of your capital in each transaction.
High-risk individuals can enter a maximum of 5% of risk capital in this transaction by accepting risk-taking.
This analysis has been analyzed with the classic Elliott topics and neo wave style. Also, the principles of price action have been used.

PEPSICO TREND AND WAVE ANALYSISBe sure to stick to Stop Lost and TAkE Profit. This is an idea and not a bargain offer
This is just idea, not trading advice, use at own risk.
reasons:
It is recommended to buy in this price limit
It is mandatory to pay attention to the stop loss and the target marked on the chart
Do not be greedy and adhere to the specified principles. I hope you will be profitable
Note that there is no 100% analysis and it is possible to stop flirting
This is a personal analysis and you should not enter into a transaction without review
If you know this, make a purchase
Be sure to adhere to the principles of capital management and do not invest more than 2% of your capital in each transaction.
High-risk individuals can enter a maximum of 5% of risk capital in this transaction by accepting risk-taking.
This analysis has been analyzed with the classic Elliott topics and neo wave style. Also, the principles of price action have been used.

NIKE WAVE AND TREND ANALYSISBe sure to stick to Stop Lost and TAkE Profit. This is an idea and not a bargain offer
This is just idea, not trading advice, use at own risk.
reasons:
It is recommended to buy in this price limit
It is mandatory to pay attention to the stop loss and the target marked on the chart
Do not be greedy and adhere to the specified principles. I hope you will be profitable
Note that there is no 100% analysis and it is possible to stop flirting
This is a personal analysis and you should not enter into a transaction without review
If you know this, make a purchase
Be sure to adhere to the principles of capital management and do not invest more than 2% of your capital in each transaction.
High-risk individuals can enter a maximum of 5% of risk capital in this transaction by accepting risk-taking.
This analysis has been analyzed with the classic Elliott topics and neo wave style. Also, the principles of price action have been used.

TMUS TREND AND WAVE ANALYSISBe sure to stick to Stop Lost and TAkE Profit. This is an idea and not a bargain offer
This is just idea, not trading advice, use at own risk.
reasons:
It is recommended to buy in this price limit
It is mandatory to pay attention to the stop loss and the target marked on the chart
Do not be greedy and adhere to the specified principles. I hope you will be profitable
Note that there is no 100% analysis and it is possible to stop flirting
This is a personal analysis and you should not enter into a transaction without review
If you know this, make a purchase
Be sure to adhere to the principles of capital management and do not invest more than 2% of your capital in each transaction.
High-risk individuals can enter a maximum of 5% of risk capital in this transaction by accepting risk-taking.
This analysis has been analyzed with the classic Elliott topics and neo wave style. Also, the principles of price action have been used.

10 Yr T-note $TNX Break-out$TNX has broken out of its long-standing 35 year descending channel, first time breaking out above 50 EMA and pushinf towards 100 EMA since 1994.
The descending channel includes both the dot.com and housing bubbles without breaking above the 50 EMA.
Given add'l rate hikes on the table and bloated CB balance sheets, extreme supply of money in the markets, overnight reverse repo in the trillions... there's an incredibly long way to go walking back unfettered money printing, unless the Fed gives up and lets inflation run unabated.
Either way, TNX isn't done climbing.
Expecting a bear market rally to bring it back for a 50 EMA retest is reasonable and normal; however, the broader macroenvironment is unhealthy and there's more room for these yields to run this year.

SPX Trending Consecutive Weekly Red CandlesThe S&P is entering bear market "correction" territory as it's retraced ~20% from ATH with 6 red consecutive weeks under its belt now.
Currently facing resistance on weekly with a rejection at the 100 EMA, economy experiencing widespread macro headwinds, & a Federal Reserve looking to reestablish credibility as Q1 laid the foundation for calling a recession this year.
3 periods since 2000 where 6 red weekly closes can be considered as benchmarks:
1. Dot.com crash 2000 through 2002 realized 50.5% retracement with 3 instances of at least 6 red weeks, with several instances of significant draw-downs occurring in less than 6 week periods.
2. Brief ~9% retracement in 2004 before reversing and continuing higher
3. Housing crash of 2008 Dropped another 45% following 6 weekly red closes, total retracement ~58%
Instance #2 (2004) was less than 10% retracement and is not a comparable benchmark.
Both instance #1 (dot.com) & #3 (housing) reflect similar initial trends as the current SPX performance, both correcting >50% overall.
The current correction extending forward w/ greater than 50% retracement overall would bring SPX down to the 2020 March low around 2620. This would be a nearly 55% draw-down.
The reversion to the March 2020 low, is still ~35% above previous support/resistance levels that were realized in a pre-QE environment where the Fed was far less divish.
The new QT paradigm with a supposed "hawkish" Fed has not yet played out... will the Fed regain credibility and drive markets lower to address rampant inflation in the economy or will it reverse course and accept higher inflation?
Given the incredible amount of money supply in the markets and bloated Central Bank balance sheets, the Fed's tools are limited to rate hikes and shedding assets. Continuing to print and prop up markets w/ Quantitative Easing has become an untenable position.
Either the Fed tries to steer the sinking ship to safe harbor, slowly reining in its reckless behaviors or the markets go into a tailspin as inflation rips higher.

PSQ Is The US market crash coming ? Is The US market crash coming ?
We have 3 types of “crashes”
Correction <15% downward movement in a major indicy
Bear Market <20% downward movement in a major indicy
Black Swan event, something very unexpected that tanks the market, think 1987, 1929, challenger disaster, 911 and so on.
The fourth type is the 1919, 1929, 1999 and 2008 scenario that people generally refer to as a “crash” 2022 a new one ?
Sincereley L.E.D In Spain 14/05/2022

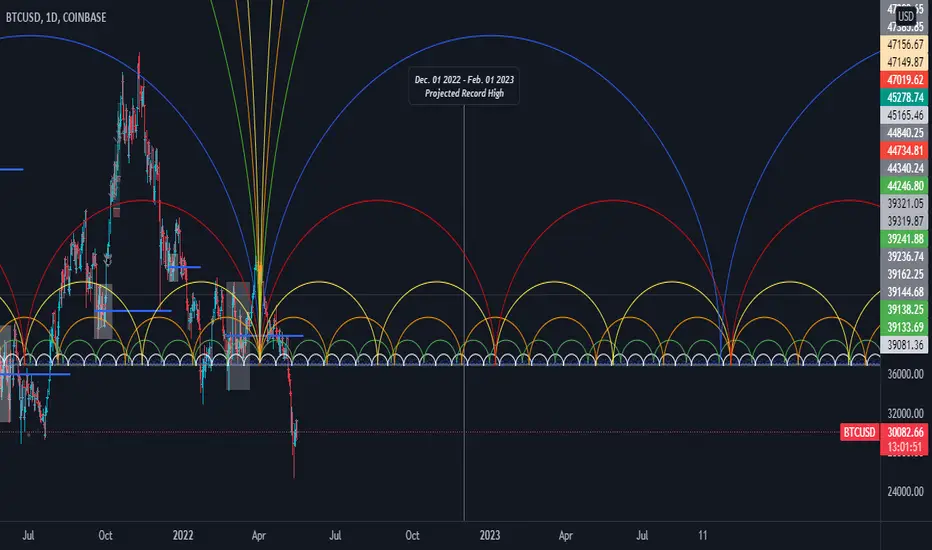
Bitcoin Long Bitcoin is clearly holding its 29-30k level. This is the time to make the big plays. Millionaires & then Billionaires are made here. YES HERE! This is the importance of grey powder during difficult times aka recessions. Buffett is old school for sure, but old is gold and do you know what the new gold is? ;D Dont overthink it and buy BITCOIN.

Are we in the middle of a recession ? On the weekly time frame, the market is largely due for a correction. Is this the reset we are looking for ?

Recession?
the weekly close beyond 104 would lead to a new high since 2002
which on the daily chart could mean the break that is taking place today (to wait for the end of the day)
