Inflation SupercycleOn the afternoon of October 3rd, 2023 something unprecedented happened in the U.S. Treasury market. For the first time ever, bear steepening caused the 20-year U.S. Treasury yield and the 2-year U.S. Treasury yield to uninvert.
Bear steepening refers to a scenario in which long-duration bond yields rise faster than short-duration bond yields, as bond yields rise across the term structure. In all past instances, inverted yield curves have normalized due to bull steepening . The probability that bear steepening would cause an inverted yield curve to normalize is so low that, until now, most term structure models excluded the possibility of it ever happening. In this post, I'll explain why this anomalous event is a major stagflation warning.
The chart above shows that the 10-year Treasury yield has been rising much faster than the 3-month Treasury yield throughout 2023, narrowing the once-deep yield curve inversion.
Since a yield curve inversion indicates that a recession is coming, and bear steepening indicates that the market is pricing in higher inflation for the short term, and even more so, for the long term, then bear steepening during a yield curve inversion indicates that high inflation may persist even during the recessionary phase. High inflation during the recessionary period is what defines stagflation . Since very strong bear steepening is normalizing a deeply inverted yield curve, the combination of these events is a warning that severe stagflation is likely coming.
High inflation has caused Treasury yields to surge at an astronomical rate of change. Bond prices, which move in the opposite direction as yields, have sharply declined causing destabilizing losses. The effects of these massive bond losses are not even close to being fully realized by the broad economy.
The image above shows a bond ETF heatmap with year-to-date returns. Large losses have been mounting across numerous bond ETFs. Long-duration Treasury ETF NASDAQ:TLT has declined by more than 18% this year. Click here to interact with the bond ETF heatmap
Despite the extreme pace of monetary tightening, many central banks are still struggling to contain inflation. Inflationary fiscal spending and ballooning debt-to-GDP levels are confounding central bank monetary policy efforts. In Argentina, for example, inflation continues to spiral higher despite the central bank raising interest rates to 133%.
The chart above shows that the central bank of Argentina has hiked interest rates to 133%. Despite this extreme interest rate, the country's inflation rate continues to spiral higher. In an inflationary spiral, there is no upper limit to how high interest rates can go.
As the Federal Reserve tightens the supply of the U.S. dollar -- the predominant global reserve currency -- all other countries (with less demanded fiat currency) generally must tighten their monetary supply by a greater degree in order to contain inflation. If a country fails to maintain tighter monetary conditions than the Federal Reserve, then the supply of that country's (lesser demanded) fiat currency will grow against the supply of the (greater demanded, and scarcer) U.S. dollar, causing devaluation of the former against the latter. In effect, by controlling the global reserve currency, the Federal Reserve is able to export inflation to other countries. This phenomenon is explained by the Dollar Milkshake Theory .
The forex chart above shows FX:USDJPY pushing up against 150 yen to the dollar. The longer the Bank of Japan continues to maintain significantly looser monetary conditions than the Fed, the longer the yen will continue to devalue against the U.S. dollar.
The meteoric rise in bond yields is particularly concerning because it has broken the long-term downtrend, signaling the start of a new supercycle. After hitting the zero lower bound in 2020, yields have rebounded and pierced through long-term resistance levels.
The chart above shows that the 10-year U.S. Treasury yield broke above long-term resistance, ending the period of declining interest rates that characterized the monetary easing supercycle.
We've entered into a new supercycle, one in which lower interest rates over time are a thing of the past. The new supercycle will be characterized by persistently high inflation. It will start off insidiously, with brief periods of disinflation, but over the long term it will accelerate higher and higher, ultimately causing today's fiat currencies to meet the same fate that every fiat currency in history has met: hyperinflation.
* * *
Important Disclaimer
Nothing in this post should be considered financial advice. Trading and investing always involve risks and one should carefully review all such risks before making a trade or investment decision. Do not buy or sell any security based on anything in this post. Please consult with a financial advisor before making any financial decisions. This post is for educational purposes only.
Recession

A massive selldown is potentially coming for #SP500As the chart progresses, old post was shared wayback Dec 2022 when the index has completed the Wave A leading Diagonal, the 1st impulse of the 3-wave corrective of the bigger cycle.
Currently, Wave B might have already topped off on the rejected 4600 zone.
I'm seeing a potential 3rd and the last impulsive of the greater corrective cycle which is at an unbelievable level estimated to be around 3276 by May of 2024 as target of the time completion.
Disclaimer: Not a financial advise. Idea is only based from the analyst's perspective applying Wave and Time Theories.

In uncertain environments, Quality Dividend Growers the answer2023 saw one of the narrowest bull markets in history, with only 10 stocks contributing 14.3% out of the 20.6% rally during the first 7 months of the year. Since then, markets have turned with the S&P 500 and the MSCI World dropping around -7% since their top1.
Looking forward to the rest of 2023 and beyond, uncertainty is high:
The Federal Reserve (Fed) has reached or is nearing the end of its rate hike cycle, but the easing cycle is still distant and its speed is unknown.
The US may avoid a full-blown recession but a recessionary environment with below-average growth is still on the table.
Further disinflation may be slower as we get closer to target, and energy prices continue to put pressure on core CPI.
In such uncertain times, investors could be contemplating reducing risk in their portfolios. However, many of them have been caught with an underweight in equities early in 2023 and missed out on the rally, leading to underperformance. To avoid a repeat, remaining invested but shifting equity exposures toward higher quality, dividend growing companies could help protect the downside while maintaining exposure to the upside.
Quality stocks tend to outperform at the end of rate hike cycles
With the rate hike cycle reaching its end, it is interesting to see what happened historically to equities in the 12 months following the end of rate hike cycles. The absolute performance of US equities has been quite dispersed following the end of the last 7 rate hike cycles by the Fed. US equities returned 24% in the best period and -18.8% in the worst. Looking at high-quality companies, we observe some consistency, though, since they outperformed the market in 6 out of those seven periods. The only period of outperformance was in 1998, when quality companies returned ‘only’ 23.3% versus 24.3% for the market. In the two periods when equities posted negative returns, quality companies cushioned the loss well, reducing the drawdown significantly.
When investors get picky, quality companies benefit
On observing the performance of high- and low-quality stocks depending on the level of growth in the economy. We split quarters into 4 quartiles, from low-growth quartiles to high-growth quartiles, and then calculate the outperformance or underperformance of those stocks in the quarter following the growth observation.
We first observe the resilience of high-quality companies. While low-quality companies only outperform when the economy is firing on all cylinders, high-quality companies outperform in all 4 environments. High-quality stocks outperform more when growth is either low or below average.
The style that doesn’t go out of style
Investment factors ebb and flow between periods of relative under- and outperformance, depending on where we are in the cycle. One big exception is quality which is, in our view, the most consistent of all factors. Sure, quality can lag in the sharp risk-on rallies that typically mark the start of an early cycle snapback; but those environments don’t tend to last, and neither does quality’s underperformance. In fact, there hasn’t been a rolling 10-year period when quality underperformed since the late 1980s.
The rolling outperformance of different US equity factors versus the market over 10-year periods since the 1970s based on the data from a famous academic: Kenneth French. On average, over periods of 10 years, quality is the factor that has historically delivered outperformance the most, often by a significant margin (90% of the time, the second best only hit 78%). It is also the factor that exhibited the smallest worst performance.
Conclusion
Overall, high-quality companies have exhibited outperformance in periods of low growth, in periods following rate hikes and, more generally, across many parts of the business cycle. With economic uncertainty remaining elevated, and an equity rally that is faltering, investors could consider quality as their portfolio anchor.
Sources
1 WisdomTree, Bloomberg. As of 27 September 2023.
2 WisdomTree, Bloomberg, Morningstar, June 2016 to June 2023.
This material is prepared by WisdomTree and its affiliates and is not intended to be relied upon as a forecast, research or investment advice, and is not a recommendation, offer or solicitation to buy or sell any securities or to adopt any investment strategy. The opinions expressed are as of the date of production and may change as subsequent conditions vary. The information and opinions contained in this material are derived from proprietary and non-proprietary sources. As such, no warranty of accuracy or reliability is given and no responsibility arising in any other way for errors and omissions (including responsibility to any person by reason of negligence) is accepted by WisdomTree, nor any affiliate, nor any of their officers, employees or agents. Reliance upon information in this material is at the sole discretion of the reader. Past performance is not a reliable indicator of future performance.

Dr. Copper has a PHD in ECONOMICSBEAR FLAG?
The target would make a trendline from our two major demand destroying events
08 & Covid Crash
Listen to Dr. Copper when he speaks

Exploding MOVE/VIX Ratio: A Major Warning SignHey everyone 👋
Guess what? This post was created by two TradingView users! @SquishTrade and I collaborated on this post.
We wanted to share our thoughts about the MOVE/VIX ratio, which has been exploding recently, and which may be presenting a warning about the future movement of the S&P 500 ( SPX ).
Before we begin, here's a bit more about the MOVE index:
The MOVE Bond Market Volatility Index measures the expected volatility of the U.S. Treasury bond market. It is calculated based on the prices of options contracts on Treasury bonds. The higher the price of these options, the higher the expected volatility of the market. The MOVE index is widely used by investors, traders, and analysts as a measure of risk in the bond market, as changes in market volatility can have a significant impact on the prices of bonds and other financial instruments.
The above image shows a 10-year U.S. Treasury bond issued in 1976.
Here's a bit more about the VIX volatility index:
The VIX is a measure of volatility in the stock market. More specifically, the VIX measures volatility by using weighted prices of SPX index options with near-term expiration dates. When the VIX volatility index was created by the Chicago Board Options Exchange (CBOE) in 1993, it was calculated using at-the-money (ATM) options. In 2003, the calculation was modified to include a much wider range of ATM and out-of-the-money (OTM) strikes with a non-zero bid. The only SPX options that are considered by the volatility index calculation are those whose expiry period lies within more than 23 days and less than 37 days.
The above image shows the highest VIX ever recorded at the close of a trading day. It occurred near the start of the COVID-19 pandemic shutdown.
Recently, @SquishTrade discovered that the ratio between the MOVE bond volatility index and the VIX volatility index has been rising along a trend line (as shown below).
Indeed, since 2021, the MOVE/VIX ratio has been exploding higher and is now approaching the highest level ever.
@SquishTrade identified that the daily chart of the MOVE/VIX ratio has shown a moderately strong positive correlation to moves in the S&P 500, this correlation appears to be statistically significant.
Citing the above chart, @SquishTrade further explains that:
The peaks in MOVE/VIX seem to correlate with peaks in SPX, especially since late 2021 (exceptions in yellow circles). This makes sense. When a rise in MOVE occurs, but VIX stays low, this raises the ratio. Of course, when VIX stays low, it's almost always because SPX price has risen or remains supported. Overall, higher MOVE and lower VIX suggest underlying problems in broader bond markets / financial system / economy AND that this is not being reflected in implied volatility (IV) for SPX. In other words, for a variety of reasons, some of which may have to do with volatility players, equity volatility shows that equities don't care yet.
When the VIX rises, the ratio falls. The interesting thing is that the peaks in MOVE/VIX correspond with the peaks in the SPX. The other interesting thing is the general trend up in MOVE/VIX and the corresponding trend down in SPX since late 2021.
So when MOVE/VIX peaks, it is as if rates markets are flashing red, and SPX is rallying like all is well. That process continues until a top in both SPX and MOVE/VIX occurs, at which time SPX gets the memo, VIX rises, and the MOVE/VIX and SPX fall together.
My response to @SquishTrade's above analysis is that: It is my belief that the explosive move higher in the MOVE/VIX ratio relates to the capital dislocation hypothesis, which I explain in further detail in my TradingView post below:
In short, the capital dislocation hypothesis is that there is far too much capital in the stock market (SPX) for bond yields to be as high as they are (and while GDP growth is also as low as it currently is). Similarly, S&P 500 volatility (VIX) is far too low for bond volatility (MOVE) to be as high as it is, as @SquishTrade alludes above.
Exeter's inverted pyramid (shown below) ranks financial assets according to safety, with the safest assets at the bottom of the inverted pyramid. Whenever an asset lower down on the inverted pyramid becomes volatile, riskier assets above it tend to experience some greater degree of volatility. This often occurs on a lagging basis since macroeconomic processes are not instantaneous.
Therefore, we can extrapolate that the extreme volatility of U.S. Treasury bonds will likely precede extreme volatility in riskier asset classes, including stocks. Consequently, the exploding MOVE/VIX ratio is likely a warning that the VIX may move much higher soon. Chart analysis of the VIX, as shown below, potentially supports this conclusion.
Bond volatility, as measured by the MOVE index, has likely increased due to the market's extreme uncertainty about the future of interest rates and monetary policy. This extreme uncertainty underpins the stagflation paradox: persistently high inflation pulls the central bank toward monetary tightening (higher bond yields) while liquidity issues and slowing economic growth pull the central bank toward monetary easing (lower bond yields), thus resulting in bond volatility. The explosion of bond volatility is likely a sign of impending stagflation, which may be severe. For more of my stagflation analysis, you can read the below post:
Certain futures markets, such as the Eurodollar futures market, which typically guides the Federal Reserve's monetary policy, have been experiencing historically high volatility, as shown below.
The above futures chart suggests that the uncertainty about future interest rates stems directly from ambivalent market participants. Since the Federal Reserve generally follows the market, if there is extreme uncertainty and ambivalence about the future of interest rates among market participants then the result will likely be a period of whipsawing monetary policy (whereby the Fed hikes, cuts, hikes, and cuts interest rates in rapid succession). In the quarters and years to come, we will likely see extreme monetary policy whipsaw as the Federal Reserve grapples with the dueling high inflation and slowing economic growth crises that characterize stagflation.
Be sure to follow @SquishTrade on TradingView, and let us know in the comments below if you would like us to collaborate on additional posts! If you're interested in collaborating with us, also let us know!
Important Disclaimer
Nothing in this post should be considered financial advice. Trading and investing always involve risks and one should carefully review all such risks before making a trade or investment decision. Do not buy or sell any security based on anything in this post. Please consult with a financial advisor before making any financial decisions. This post is for educational purposes only.

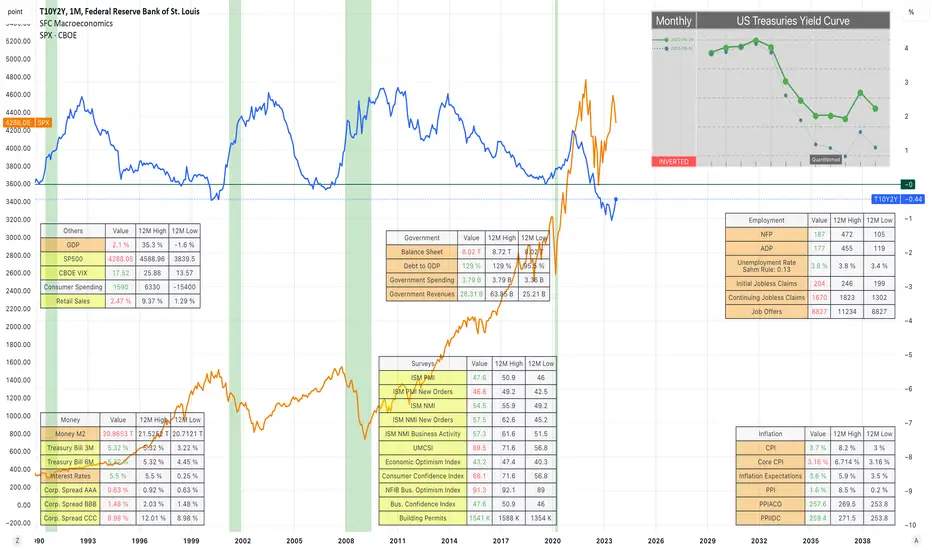
Qualitative Fundamental Analysis of US Economy Oct.2023The most important factor for the economy is the behaviour of GDP. Several economic indicators are tracked to determine the overall economic situation and GDP growth.
A technical recession is defined as 2 consecutive quarters of negative real GDP.
If GDP grows less than 3% on average for the year, the economy is not growing fast enough and this will lead to unemployment.
At its core, the Federal Reserve has dual mandate policy: price stability(2% inflation for a year) and maximum employment (max Unemployment rate 4%) .
CPI Inflation projection: inflation is forecast at 4.7% in 2023 and is expected to further slow down to 3.0% in 2024.
Actual CPI : 3.7 %
PCE Inflation projection: inflation to be 3.3 percent in 2023, 2.6 percent in 2024, and 2.2 percent in 2025, and the Federal Reserve expects a similar outlook of 3.3 percent, 2.5
Actual PCE : 3.5%
Unemployment rate projection: The unemployment rate reaches 4.1 percent by the end of 2023 and 4.7 percent by the end of 2024 before falling slightly, to 4.5 percent, in 2025.
Actual: 3,8%
GDP Growth projection: Real GDP increases by 1.5 percent in 2024 and by 2.4 percent in 2025.
Actual: 2,4%
Interest rates projection:The Fed now expects its benchmark federal funds rate to close out 2024 at an effective rate of 5.1%, which is higher than its June forecast of 4.6%
Interest rates: 5.5%
MONEY MARKET
Yields
From the chart above we can see when the recession is coming. The 10Y-2Y has already fallen below 0 and we should prepare for a recession when it comes above 0.
The yield curve (all yields) is slightly inverted, but only because of the 20-year yields. The overall curve is normal, which means that investors are not worried about the future, at least for now and they invest more in long-term bonds.
According to the FED, we should expect a mild recession at the end of this year.
The SP500 seems to be consolidating for the next few months.
Corporate Bonds and Credit Spread
Spreads are relatively stable. They do not point to a recession.
Money Supply M2
The money supply is also stable, which means that the printer is not running. This is a good sign considering the banking crisis.
interest rates
The last time IR was so high was during the last recession in 2008. History could repeat itself. At the last FOMC meeting, the FED paused rates but said they would remain high. This could be exactly what happened in 2007. FED paused after aggressive hike and recession came.
SERVEYS
ISM PMI, NMI
The historical correlation between real GDP growth and the ISM PMI/NMI is 85%. PMI/NMI are leading indicators and they will predict how GDP will move. It is a short to long term prediction (within 12 months).
The reading continued to point to another albeit smaller deterioration in the manufacturing performance, as contractions in output and new orders softened. Meanwhile, sufficient stocks of inputs and finished items, alongside still subdued demand, led firms to reduce their purchasing activity sharply again and firms continued to work through inventories in lieu of expanding their input buying, which contributed to a further improvement in supplier performance.
Consumer Sentiment Index(UMCSI)
The level of consumer confidence in stability and future prospects can be used to understand the overall trend in the economy.
Still, consumers are unsure about the trajectory of the economy given multiple sources of uncertainty, for example over the possible shutdown of the federal government and labor disputes in the auto industry.
From a technical perspective the chart looks very suspicious. Like bullback before the new swing. Will see.
Building Permits
The jump in permits suggested that new construction continues to thrive, driven by a shortage of homes available in the market, despite the dampening effect of rising mortgage rates on housing demand.
NFIB Business optimism index
Twenty-three percent of small business owners reported that inflation was their single most important business problem, up two points from last month. Also, the number of small business owners expecting better business conditions over the next six months declined (seven points from July to a net negative 37%). “With small business owners’ views about future sales growth and business conditions discouraging, owners want to hire and make money now from strong consumer spending,” said NFIB Chief Economist Bill Dunkelberg. “Inflation and the worker shortage continue to be the biggest obstacles for Main Street.
Overall the business is not optimistic for the near future.
Leading Economic Index
The Leading Economic Index provides an early indication of significant turning points in the business cycle and where the economy is heading in the near term.
The US LEI continues to signal a recession. Combined with the yield curves, it looks like a recession could be coming very soon.
INFLATION
Total Inflation = 30% CPI (demand) + 40% PCE(supply) + 30% other factors)
CPI
The FED's target may be 2%, but the reality is that inflation is between 2-4%. Inflation has risen again in recent months and current oil prices suggest that it will remain high.
Investors are worried about future prices. The same thing happened in the 80s. The FED does not want the same to happen today, which is why they have been so hawkish recently.
Core CPI
This projection is very scary, but if the economy goes crazy, it can happen, just like in the 80s. I am not predicting that core CPI will rise that much, just pointing out the similarity.
PCE Inflation
The US personal consumption expenditure price index rose 3.5% year-on-year in August 2023, the most in four months, after an upwardly revised 3.4% rise in July and in line with market expectations.
PPI / Core PPI
The producer price inflation in the United States accelerated to 1.6% year-on-year in August 2023. This is the second consecutive month.
GOVERNMENT
Balance sheet
The balance sheet is falling, which is deflationary. On the one hand, this is good and gives us an indication that inflation should be contained, but on the other hand, it is a sign of recession.
[b ]Cyclical Commodities
Trade weighted US Dollar Index
Rising trade indices are actually deflationary for the economy.
Commodities
They stable prices do not give us a clear picture of the near future.
Stocks
The benchmark indices are falling. The failed to make new HH, suggesting that the will consolidate or fall.
Sometimes they are seen as a leading indicator of future GDP and recession.
Summery
The current pause in interest rates, with the hawkish narrative that rates will stay high for a long time, could be the second phase of the business cycle. The next one is recession.
Yield curves have also suggested that the recession is not as far away as we think.
The surveys are relatively stable, but the overall picture is not so optimistic.
Inflation is on the rise again, which may lead the FED to be more aggressive. They have said many times that they would rather have a recession than a price explosion. They have even warned about a mild recession, how mild we will see.
The unemployment rate is still below 4%, but in recent months it has risen from 3.5% to 3.8%. Rising unemployment is a sign of recession.
Stock indices have risen in recent months, but future expectations of a new recession, combined with high interest rates and business optimism, are bearish factors for the stock market.
Nordstrom Head and Shoulder'sJWN has a trailing twelve month Price to Earnings (PE) ratio of 73.69 which places it above the histroical average of roughly 15.
Another expensive retail name
#JWN has alot of stores in #California
Obviously not a great place to be a retailer, given the rampant crime spree going on in that state!
well The chart action clearly foretells further woes ahead ..

If Love The Gap. You will love it under a $1Let's look at some household retail names
starting off with The GAP #GPS
It's ATH was over Twenty years ago
Is this Head and Shoulders signalling a Bankruptcy event during the next recession?

Berkshire Hathaway: Bearish Gartley Hinting at a 40-60% DeclineBerkshire Hathaway is currently trading at the HOP level of a Bearish Gartley and at this HOP level, upon close, will likely confirm a Bearish PPO Confirmation Arrow as the PPO Oscillator itself gets closer and closer to breaking below a well established trend line.
Along with that, we have some Bearish Divergence on the MACD and the price action we got at the HOP resulted in a green Shooting Star Candlestick Reversal Pattern that we are working on confirming via a Weekly Bearish Engulfing.
If all goes as expected, I would think that the shares of Berkshire Hathaway will first pull back 27% which would put at the 2022 lows but after that I think it will likely pullback around 40%-60% to fill an unresolved gap at $314,850.00

SPX Market Crash (upcoming) - 35% why?Hi Everyone,
A summary of the last 5 recessions since 1981... These recessions triggered declines of at least 20%. The Great Recession from December 2007 to June 2009 was the one that most affected the market with a decrease of about 57%. Regarding macroeconomics, the Americans are currently implementing a monetary tightening policies and have announced a final interest rate hike before the end of the year, so in my opinion, a recession is now inevitable.
The SPX is currently forming a tweezer top on the 3-month timeframe... In my opinion, a 35% decline is possible to test the M Neckline (entry gate).

MACRO MONDAY 10~ Interest Rate & S&P500MACRO MONDAY 10 – Historical Interest Rate hike Impact on S&P500
This chart aims to illustrate the relationship between the Federal Reserve’s Interest rate hike policy and the S&P500’s price movements.
At a glance the chart highlights the lagging effects of the Federal Reserves Interest Rate hikes on the S&P500 (the “Market”). In all four of the interest rate hikes over the past 24 years the S&P500 did not start to decline until 3 months into an interest the rate pause period (at the earliest) and in 3 out of 4 of the interest rate pauses there was a 6 – 16 month wait before the market begun to turn over. The move to reducing interest rates (after a pause period) has been the major warning signal for the beginning or continuation of a major market decline/capitulation. We might have to wait if we are betting on a major market decline.
In the chart we look particularly at the time patterns of the last two major interest rate hike cycles of 2000 and 2007 as they offer us a framework as to what to expect in this current similar hike cycle. Why is this cycle similar to 2000 & 2007?.. because rates increased to 6.5% in 2000, 5.25% in 2007 and we are currently at 5.50% in 2023 (sandwiched between the two). These are the three highest and closely aligned rate cycles over the past 24 years. The COVID-19 crash is included in this analysis but has not been given the same attention as the three larger and similar hike cycles 2000,2007 & 2023.
The Chart
We can simplify the chart down to FIVE key points (also summarised hereunder):
1. Previously when the Federal Reserve increased interest rates the S&P500 made significant
price gains with a 20% increase in 2000 and a 23% increase in 2007.
- Since rates started increasing in February 2022 we have seen the S&P500 price make a
sharp decline and then recover all those losses to establish an increase of 5% at present
since the hiking started.
- This means all three major interest hike cycles resulted in positive S&P500 price action.
- For reference, a more gradual rate hike pre COVID-19 also resulted in 20%+ positive price
action.
2. When the Federal Reserve paused interest rates in 2000 it led to a 15% decline in the
S&P500 and then in 2007 it led to a 28% increase in the S&P500. It is worth noting that a
lower interest rate was established in 2007 at 5.25% versus 6.5% in 2000. This might
indicate that this 1.25% difference may have led to an earlier negative impact to the
market in 2000 causing a decline during the pause phase. Higher rate, higher risk of
market decline during a pause.
- At present we are holding at 5.5% (between the 6.5% of 2000 and the 5.25% of 2007).
3. In the event that the Federal Reserve is pausing rates from hereon in, historic timelines of
major hike cycles suggest a 7 month pause like in 2000 or a 16 month pause in line with
2007 (avg. of both c.11 months). For reference COVID-19’s rate pause was for 6 months.
- 6 - 7 months from now would be March/April 2024 and 16 months from now would be
Nov 2024 (avg. of both Jun 2024 as indicated on chart).
4. As you can see from the red circles in the chart the initiation of Interest rate reductions
have been the major and often advanced warning signals for significant market declines,
including for COVID-19.
5. It is worth considering that before the COVID-19 crash, the interest rate pause was for 6
months from Dec 2018 – Jun 2019. Thereafter from July 2019 rates begun to reduce (THE
WARNING SIGNAL from point 4 above)…conversely the market rallied hard by 20% from
$2.8k to $3.4k topping in Feb 2020 at which point a major 35% capitulation cascaded over
6 weeks pushing the S&P500 down to $2,200. Similarly in 2007 the rates began to decline
in Aug 2007 in advance of market top in Oct 2007. A 53% decline followed. The lesson here
is, no matter how high the market goes, once interest rates are decreasing it’s time to be
on the defensive.
Summary
1. Interest Rate increases have resulted in positive S&P500 price action
2. Interest rate pauses are the first cautionary signal of potential negative S&P500 price action however 2 out of 3 pauses have resulted in positive price action. The higher the rate the higher the chance of a market decline during the pause period.
3. Interest rate pauses have ranged from 6 to 16 months (avg. of 11 months).
4. Interest rate reductions have been the major, often advanced warning signal for significant and continued market decline (red circles on chart)
5. Interest rates can decrease for 2 to 6 months before the market eventually capitulates.
- In 2020 rates decreased for 6 months as the market continued its ascent and in 2007
rates decreased for 2 months as the market continued its ascent. This tells us that
rates can go down as prices go up but that it rarely lasts with any gains completely
wiped out within months.
September – The Doors to Risk Open
We now understand, as per point 2 above, that an Interest rate pause is the first cautionary signal of potential negative S&P500 price action. Should the Fed confirm a pause in September 2023 we will clearly be moving into a more dangerous phase of the interest rate cycle.
Based on the chart and subject to the Fed pausing interest rates from September 2023 we can now project that there is a 33% chance of immediate market decline (within 3 months) when the pause commences with this risk increasing substantially from the 6th and 7th month of the pause in March/April 2024.
I have referenced previously how the current yield curve inversion on the 2/10 year Treasury Spread provided advance warning of recession/capitulation prior to almost all recessions however it provided us a wide 6 - 22 month window of time from the time the yield curve made its first definitive turn back up to the 0% level (See Macro Monday 2 – Recession Timeframe Horizon). Interestingly September 2023 will be the 6th month of that 6 – 22 month window.
Both todays chart and Macro Monday 2’s chart emphasize how the month of September 2023 opens the door to increased market risk. Buckle up folks.
March/April 2024 – Eye of the Storm
On Macro Monday 2 – Recession Timeframe Horizon our average time before a recession after the yield curve starts to turn up was 13 months or April 2024 (average of past 6 recessions using 2/10Y Treasury Spread).
From today’s review of the Interest rate hikes impact on the S&P500, we have a strong indication that March/April 2024 will be key high risk date also.
Now we have two charts that indicate that the month of Mar/Apr 2024 will come with significantly increased risk.
Its worth noting a pause could last 16 months like in 2007 lasting until Nov 2024, at which point we would be pretty frustrated if we had been preparing defensively since Mar/Apr 2024. Just another scenario to keep in mind.
The Capitulation Signal
Based on today’s chart, should interest rates at any stage decline we should be prepared for significant market decline with immediate effect or within 2 months (at worst). Regardless of any subsequent increases in the market, these would likely be wiped out within 6 – 9 months by a capitulation. An optimist could run a trailing stop and hope it executes in the event of.
Bridging the Gaps
Please have a look at last week’s Macro Monday 9 – Initial Jobless Claims if you would like to measure risk month to month. The chart is designed so that you can press play and have an idea of the risk level we are entering into on an ongoing basis. In this chart we summarised more intermediate risk levels with Sept-Oct 2023 as Risk level 1 (yield curve inversion time window opens and potential rate pause risk increase) and Nov-Dec 2023 as stepping into a higher Risk Level 2 (as increase in Jobless claims average timeframe will be hit). Should the yield curve continue to move up towards being un-inverted and should Jobless Claims increase then Jan 2024 forward this could be considered a higher Risk level 3 leading the path to our Risk level 4 defined today which is March/April 2024.
Final Word
It is worth noting that the Fed could surprise us and start increasing rates again, they may also not pause interest rates in Sept 2023. For this reason I included the small black and red arrows that provide a general timeline across different rate periods to help us gauge a market top (red arrows) and a market bottom (black arrows). The black arrows suggest a time window of 27 – 32 months from now being the market bottom. A lot of people are focused on when a recession or capitulation will start, we may want to start thinking a step ahead and prepare for the opportunity that will present itself at a market bottom. Having a time window can help us plan and be psychologically prepared to consider taking a position in a market of pain and fear should the timing window align. If we are expecting this bottom in between Oct 2025 and Mar 2026, we can make more rational decisions when the streets are red.
We can try to make more definitive calls and decisions on an ongoing bases so please please do not take any of the above as a guarantee. We know the risk is increasing now and a lot of charts indicate incremental increases in risk up to Mar/Apr 2024, Nov 2024 and even January - March 2025. All of theses dates are possible trigger events but ultimately we don’t know. We are just trying to prepare and read the warning signs on the road as we drive closer to a potential harpin turn.
If you have any charts you want me to look at or think would be valuable to review in the context of the above subject matter please let me know, id love to hear about it.
PUKA

Dark times are coming...
- TVC:US10Y is showing significant strength on all major timeframes.
- The EMA's on the monthly timeframe broke bullish after 12,000 days (Last seen 1962).
- If the US10YR breaks the 50% price retracement, we could see between 7.25% - 15%. (Last seen 1981)
The markets are in a scary place right now. This bear market may be extended due to many factors were dealing with in 2023 (War, Virus, Inflation, Rising Interest Rates, Upcoming election, etc...).
Maybe a crash is what's needed to reset all of this chaos?

The Dollar Recession Channel?This is an idea showing the possible downtrend until year end for the Dollar index DXY.

Oil Reserves Plummet to 40-year LowThe Biden Administration is treading on dangerous ground as it continues to deplete the Strategic Petroleum Reserve (SPR) to levels not seen in decades, as geopolitical tensions flare and as global crude prices remain high.
The chart above shows that the Strategic Petroleum Reserve has declined to levels not seen since the early 1980s.
The SPR is a tool used to alleviate the market impacts of both domestic and international disruptions, caused by among other things: weather, natural disasters, labor strikes, technical failures/accidents, or geopolitical conflicts.
Source: U.S. Department of Energy. Office of Cybersecurity, Energy Security, and Emergency Response. This image is in the public domain.
Since the start of 2023, the SPR has drained by another 6.5% or 24 million barrels.
Source: U.S. Department of Energy. Office of Cybersecurity, Energy Security, and Emergency Response. This image is in the public domain.
The SPR is comprised of 60 caverns, each one of which can fit the Willis Tower, one of the world's tallest skyscrapers.
Source: U.S. Department of Energy. Office of Cybersecurity, Energy Security, and Emergency Response. This image is in the public domain.
The decision to withdraw crude oil from the SPR in the event of an energy emergency is made by the President under the authority of the Energy Policy and Conservation Act (EPCA) and done through competitive sale.
Perhaps what is so remarkable is that over the past 2 years, the Biden Administration has released nearly 300 million barrels of crude oil from the SPR, concurrent with the Federal Reserve undertaking the most extreme pace of monetary tightening on record in its attempt to maintain price stability, and yet crude oil prices have barely subsided.
In fact, in recent months, crude oil prices have surged, as shown in the chart below.
The global crude benchmark, TVC:UKOIL has been on an upward trajectory in recent months, soaring nearly 30% since June.
On the higher timeframe chart, we can see that crude oil prices show strong upward momentum. As soon as the Federal Reserve pivots back to monetary easing crude oil prices will likely resurge.
A log-linear regression channel is applied to the quarterly (3-month) chart of NYSE:OXY Petroleum, showing the current bull rally could just be the first leg of a multi-year upward trend. The red line in the middle represents the mean price and each gray line represents one standard deviation from the mean.
Perhaps the tendency of crude oil to rise in price over the coming years is why the Oracle of Omaha , Warren Buffet, began purchasing a large number of NYSE:OXY Petroleum shares in 2022, accumulating more than a 25% ownership stake in the company by mid-2023.
Some financial experts are sounding the alarm about the SPR depletion. The founder of The Bear Traps Report , Larry McDonald, has indicated that the drastic decline in U.S. oil stockpiles, a critical asset in times of conflict, undermines America's energy security.
McDonald is warning that diminishing domestic oil reserves heighten America's dependence on imports, potentially exposing the nation to severe supply disruptions and extreme price volatility in the international oil market. Each time the price of crude oil subsides, petroleum exporting countries, including Saudi Arabia and Russia, cut production to keep prices higher for longer.
To some, it may seem that these production cuts are a gray zone tactic meant to deplete an adversary of its strategic oil reserves before engaging them in a conflict.
There is also collateral damage occurring to the U.S. dollar. The petrodollar system, which emerged in the 1970s when the U.S. abandoned the last vestiges of its gold standard, was a series of agreements between the U.S. and petroleum exporting countries to use the U.S. dollar for cross-border oil transactions. Since almost every country needed to import or export some amount of petroleum, the petrodollar system was a means of ensuring a perpetual global demand for U.S. dollars despite the currency not being redeemable at the Federal Reserve for anything of value.
As crude oil prices continue to surge, despite the Federal Reserve tightening monetary conditions at the fastest pace on record, a crisis is unfolding for developing countries that lack access to dollars. These countries are on the precipice of hyperinflation. In essence, by tightening the supply of dollars the Federal Reserve is exporting inflation abroad, especially to those that lack easy access to dollars. Consequently, countries at the periphery of the dollar access hierarchy are being incentivized, now more than ever, to turn to alternative currencies, thereby accelerating de-dollarization.
As oil prices continue their relentless march upward, the scenario continues to exacerbate inflationary pressures in the U.S., and even more so, abroad. Higher prices could compel the Federal Reserve to maintain higher interest rates for much longer than anticipated, even in the face of deteriorating economic conditions and rising unemployment, resulting in stagflation. Exacerbating the situation further are global climate change policy objectives, which act as a disincentive for countries to increase domestic oil production.
If a major geopolitical conflict occurs when petroleum reserves are depleted and production is constrained, the outcome could result in severe stagflation, as prices spiral higher even though economic growth stagnates in the face of a fragmenting world.
* * *
Important Disclaimer
Nothing in this post should be considered financial advice. Trading and investing always involve risks and one should carefully review all such risks before making a trade or investment decision. Do not buy or sell any security based on anything in this post. Please consult with a financial advisor before making any financial decisions. This post is for educational purposes only.

Soft Landing?A lot of market participants are falling for the Fed's illusion that a soft landing has been achieved. However, the charts are still warning that a recession is coming.
The chart below shows the extreme degree of inversion between the 10-year Treasury bond and the 3-month Treasury bill. The current inversion is the worst in over 40 years.
A yield curve inversion reduces bank lending for various reasons, one of which is the removal of the incentive for banks to borrow at lower short-term rates and lend at higher long-term rates. Since bank credit is how most money comes into creation, a yield curve inversion is, therefore, a sign that monetary conditions are deteriorating. Indeed, manipulating the interest rate is how the central bank controls the money supply and induces a recession.
The impact of rate hikes always occurs on a lagging basis. The lag can last anywhere from several quarters to several years. As the infographic below shows, an economic recession will likely begin in the U.S. between Q4 2023 and Q4 2024.
The warning signs of the coming liquidity crisis are everywhere.
In a prior post (shown below), @SquishTrade and I pointed out that a major disparity between the volatility of bond prices and the volatility of equity prices is occurring. This extreme disparity could be a warning that much greater volatility for equity markets has yet to come.
Even for stocks that have experienced a strong rally in 2023, the basis of their surge is largely unsupported by dollar liquidity levels. In the chart below, the price of NASDAQ:NVDA is compared against the dollar liquidity index.
This is further confirmed by the below chart, which shows how extreme the price of NASDAQ:NVDA as a ratio to the price of a risk-free 10-year Treasury bond has become. Never before have investors been willing to pay so high of a risk premium to hold Nvidia's stock.
While anything is possible, the charts suggest that there isn't enough money in the economy to support the payment of debt at current yields. The below chart shows the price of long-term government Treasurys (adjusted for interest payments) as a ratio to the M2 money supply.
There is simply not enough money in the M2 money stock for market participants to be able to pay all newly issued debt at the current high rates. When the liquidity issues begin to mount, the Fed will quickly pivot back to new money creation, as it did in March 2023 when it abruptly created the Bank Term Funding Program (BTFP), which is the latest of the many tools that the Fed uses to create new money.
However, when the economy begins to slow, this time around central banks will get trapped because of commodity price inflation. Although commodity prices are generally disinflating at the present time, this slow disinflation is merely forming a bull flag on the higher timeframes.
With unemployment also bull flagging on the higher timeframes, when commodity prices and unemployment concurrently break out, the result will definitionally be stagflation.
Important Disclaimer
Nothing in this post should be considered financial advice. Trading and investing always involve risks and one should carefully review all such risks before making a trade or investment decision. Do not buy or sell any security based on anything in this post. Please consult with a financial advisor before making any financial decisions. This post is for educational purposes only.

The Great StagflationIn this post, I will present a compendium of higher timeframe charts to show why it's likely that the U.S. economy, and likely much of the global economy as well, is heading into a period of stagflation. I have termed this coming period "The Great Stagflation" because I believe this is how the mid-2020s will be characterized in retrospect. The term stagflation refers to a period when economic growth slows or declines, unemployment increases and inflation remains elevated. To listen to my full thoughts on stagflation, and my thoughts on why I believe we're already in a recession, you can watch my video below.
Chart 1 - S&P 500 Yearly Chart (SPX)
This chart shows a downward oscillation of the Stochastic RSI on the yearly chart of the S&P 500 index (SPX). This degree of strong downward momentum on the yearly chart of SPX is rare and has only occurred just three times in the past 100 years: the Great Depression, the 1970s Stagflation, and the Dotcom Bust. In each case, the stock market stagnated for a period of at least a decade.
Chart 1a
This chart shows the several important Fibonacci levels on the highest timeframe on the S&P 500 (SPX). What this chart shows is that the market bottom in 2022 was right at the 3rd Fibonacci extension, when using the peak before the Great Depression and the lowest ever price for SPX as our reference point. It's possible that if the stock market falls below the market bottom from 2022 decisively, the next major Fibonacci support on the highest timeframe will be all the way down at the Dotcom peak (or pre-Great Recession peak), which is the 2.618 Fibonacci extension. This price level is highlighted in red.
Chart 2 - Producer Price Index (PPIACO)
This chart shows the Producer Price Index by Commodity: All Commodities (PPIACO). The Producer Price Index is a measure of the average change in the selling prices received by domestic producers for their output. It is calculated by the Bureau of Labor Statistics (BLS) and is reported on a monthly basis. It covers a wide range of commodities, including those used as inputs for goods, services, and construction, and is grouped into various stages of production, such as raw materials, intermediate goods, and finished goods. The Producer Price Index can be used as a leading indicator of Consumer Price Index (CPI). As we see in this yearly chart, the Stochastic RSI is showing strong upward momentum that is rising up from oversold conditions. This type of upward oscillation can add inflationary pressure for years to come, and can set the stage for stagflation.
Chart 3 - Stock Market Deflation vs. Commodity Price Inflation
This chart shows the S&P 500 index (SPX) compared against the Producer Price Index by Commodity: All Commodities (PPIACO). During periods of stagflation, the SPX/PPIACO ratio oscillates downward as commodity price inflation causes the Federal Reserve to tighten the money supply to curtail inflation. As a result, the stock market declines as commodity prices inflate. Thus, the yearly chart of the SPX/PPIACO ratio could be sending a warning that what we are dealing with is a period of prolonged stock market stagnation.
Chart 4 - Stock Market to the Moon
These quarterly (3-month) charts show the entire price history of the U.S. stock market (SPX) dating back to 1871. I applied a log-linear regression channel to give a rough approximation of the extent to which the stock market has deviated from its mean, or average price, over the years. In the fourth quarter of 2021 (Q4 2021), the stock market closed exactly at the +2 standard deviation from its mean price, the highest ever recorded on a quarterly closing basis. The chart on the right side shows a zoomed-in view, which shows how perfectly SPX reached the +2 standard deviation before declining. The mean or average price, which is visualized in the chart as the red line, is so far down, that it does not even appear on the zoomed-in chart. To put the meteoric rise of the stock market during the period of limitless monetary easing into perspective: It has been so extreme that it has actually rendered the extreme bubble of the Roaring '20s, before the Great Depression, as merely being an average stock market valuation.
Chart 5 - Supercycle Bearish Divergence
This chart ominously shows a major bearish divergence on the yearly chart of the S&P 500 index (SPX). Bearish divergence is when price creates a higher high while the RSI creates a lower high. Bearish divergence can warn of a coming reversal, as it reflects the notion that the bull run is becoming exhausted. Looking back 150 years, such an extreme bearish divergence has actually never occurred before on the yearly chart. This multi-decade bearish divergence could be indicating the start of a new Supercycle, or potentially even the start of a new Grand Supercycle -- one in which the stock market underperforms for years to come, as interest rates, or the cost of money, trends higher. Only time will tell how this will unfold, but this chart provides further evidence that we're likely entering a period that will be characterized by prolonged stock market stagnation.
Chart 5a
Volume has been declining during the formation of this bearish divergence.
Chart 6 - Stock Market Growth vs. GDP Growth
This quarterly chart shows Gross Domestic Product (GDP) on the left and the stock market (SPX) on the right. Applied to both charts is a log-linear regression channel. Notice how GDP is barely hanging on to the -2 standard deviation at a time when the stock market has blasted up to the +2 standard deviation. This extreme divergence has been made possible solely by the Federal Reserve's monetary easing experiment. The Federal Reserve has compensated for declining GDP growth by lowering interest rates even faster than GDP growth declines. By doing this, the Federal Reserve has made the cost of money so low that risk assets were able to rally, even as actual increases in productivity did not occur. The extreme divergence of extreme stock market outperformance coupled with extreme GDP growth underperformance is unsustainable, particularly in the face of commodity inflation. The Great Stagflation will likely see stock market returns stagnate, which in turn will more accurately reflect stagnating economic growth. The cycle of boom and bust is largely an inevitable eventuality.
Chart 7 - Price of Stocks vs. Price of Bonds
In a prior post, I discussed the meaning of this chart. Simply put, this ratio chart compares the price of the S&P 500 Index to the price of a risk-free Treasury bond (defined here as the 10-year U.S. Treasury bond). I applied a log-linear regression channel to illustrate the fact that despite all the tightening that the Federal Reserve has already undertaken, we are only just now at the historical mean for this ratio chart. What I am about to say next is quite dense, but see if you can understand my logic: Since the numerator of this ratio chart (SPX) currently has strong downward Stochastic RSI momentum on its yearly chart (which is depicted in Chart 1 above), and since this ratio chart has strong upward momentum on its yearly chart, then this suggests that the denominator (the price of a 10-year U.S. Treasury bond, written here as the inverse of its yield {1/US10Y}) is likely to head down faster than numerator (SPX) does, thereby allowing the ratio to move up and reach the +2 standard deviation of the regression channel. Since the price of bonds moves inversely to the yield, this ratio chart is ominously warning that the yields on 10-year Treasury bonds may move much higher in the years to come. If Treasury yields are moving higher this is likely because inflation continues to be persistent. Such a tight monetary environment, coupled with persistent inflation, is likely to result in stagflation. To read more on the meaning of this chart, you can view my post below.
Chart 7a
This chart is similar to the previous, except that real rates are used. With real rates rising so drastically (and therefore bringing down bond prices) as a ratio to the S&P 500, it creates the appearance that the stock market is becoming more and more overvalued, even as it nonetheless sells off! This reflects a massive dislocation in capital. Over time, capital will flow out of the stock market and into less-risky and higher-yielding Treasury bonds, particularly since commodity inflation is unlikely to abate and thus Treasury yields will remain elevated.
Chart 8 - The Real Cost of Apple (AAPL)
This chart shows the price of Apple's stock (AAPL) compared against the price of a 10-year U.S. Treasury bond. Over the past year, Apple's great balance sheet and high cash flow, has made it seem like a safe haven relative to more speculative risk assets and companies with negative cash flow. Yet, when compared against the actual safe-haven asset (the 10-year U.S. Treasury bond), the premium in Apple's price could not be higher. The price of AAPL for the current yield on a 10-year U.S. Treasury reflects a capital dislocation (the biggest ever). In other words, too much capital is in Apple's stock for the yield on a 10-year U.S. Treasury to be as high as it currently is. An efficient market would cause capital to flow out of Apple's stock and into less-risky and higher-yielding U.S. Treasury bonds over time, especially since persistent inflation is likely to keep Treasury yields higher for longer. Since Apple is a component of many exchange-traded funds (ETFs) and mutual funds, the decline in its value may cause the entire stock market to decline. As unemployment rises, the stream of passive contributions to mutual funds and ETFs will slow and reverse as drawdowns and hardship withdrawals increase. Higher unemployment will also lead to less consumer spending on Apple's products and services causing an earnings recession. Finally, rising geopolitical tensions between the U.S. and China may severely disrupt supply chains. Apple stands to gain little, but lose a lot in the years to come.
Chart 9 - High-Yield Corporate Bonds vs. Money Supply
The symbol in chart is a bit dense to understand, but upon deciphering it, one can understand that it warns of a coming liquidity crisis for companies with lower credit ratings. First, BAMLH0A0HYM2EY is the symbol for the all-in effective rate of high-yield corporate bonds. This represents the cost of borrowing for companies with lower credit ratings. Second, the denominator is the M2 money supply in the U.S. Finally, the chart is adjusted by an arbitrary multiplier to remove visual distortion. The effective yield that companies (which the market considers to be risky) must pay on their bonds has increased rapidly relative to the supply of money, the latter of which has actually been decreasing at a record pace. This is a liquidity crisis in the making for companies that have low credit ratings and which need constant infusions of new debt to maintain financial viability. If the amount of money needed to finance new debt is increasing at a record pace as the supply of money decreases at a record pace, then the amount of money in the economy available for these companies to earn, so as to be able to finance their debt, will quickly become insufficient as a matter of mathematical certainty. Thus, a liquidity crisis is largely inevitable, particularly since the central bank may not be able to intervene to the extent that would be needed to avert such a crisis without worsening commodity inflation. As we can see in the monthly chart, the EMA ribbon which acted as resistance, has been broken. Even as the Stochastic RSI oscillates down, price is remaining above the EMA ribbon for the first time since the Great Recession.
Chart 10 - Persistent Inflation
This chart shows just how persistent inflation has been. This ratio chart compares iShares TIPS Bond ETF which tracks an index composed of inflation-protected U.S. Treasury bonds (TIP) to iShares 7-10 Year Treasury Bond ETF (IEF). For the first time ever, the Stochastic RSI (which is shown on the bottom) has oscillated fully down to oversold levels on the monthly chart while price remains above the EMA ribbon. This suggests a major trend change may have occurred in that the EMA ribbon, which has generally held as resistance, may have flipped to support. This leads us to conclude that inflation may be persistently elevated for longer than anticipated. So long as inflation remains high, central banks must keep interest rates, or the cost of money, high as well. Compare the current situation to the Great Recession when inflation quickly turned into deflation, which allowed the central banks to pivot to monetary easing. One might question whether this monthly chart is showing a... bullflag?
Chart 11 - Commodity Inflation Supercycle
Similar to the previous chart, this chart shows Invesco DB Commodity Index Tracking Fund (DBC). DBC is composed of futures contracts on 14 of the most heavily traded and important physical commodities in the world. Each candlestick in this chart represents a 2-month period. What this chart shows is just how persistent commodity inflation has been. Despite nearly an entire year of monetary tightening at a record pace, commodity futures are only very slowly disinflating. Compare this to the Great Recession, when commodity prices rapidly deflated. This time around it is likely that commodity prices will remain elevated even as economic growth slows. This is occurring because commodity prices have entered into a new supercycle, and this new supercycle of higher commodity prices will likely result in The Great Stagflation.
Chart 11a
It appears that if anything, DBC is presenting a bull flag pattern on this higher timeframe chart. This could stymie the Federal Reserve's ability to pivot to easier monetary conditions should unemployment begin to rise rapidly or should corporate liquidity issues mount.
Chart 12 - Cost of Energy
This chart shows the price of American multinational oil and gas corporation, ExxonMobil (XOM). Price has been ripping higher after bouncing on the -2 standard deviation regression channel line during the pandemic shutdown. Now, the yearly Stochastic RSI is showing strong upward momentum. This suggests that the costs of energy, including fossil fuel energy, will trend upward for years to come, even as economic growth slows. Similar patterns as this are appearing across virtually all charts in the energy sector, including in sustainable energy (hydrogen, uranium, etc.). Since energy is considered a commodity, these charts patterns buttress the assertion that commodity prices may continue to inflate in the years to come. In my post below, I note how the hydrogen energy company Plug Power (PLUG) looks to be in a log-scale bull flag pattern. (Not a buy or sell recommendation)
Chart 13 - Coffee
This chart shows that coffee futures bounced after undergoing a Fibonacci retracement to the 0.618 level. Now, long lower wicks are forming on bullish reversal candles, indicating that prices are likely to attempt a rally on the monthly timeframe. This is yet another warning that commodity inflation may remain persistent.
Chart 14 - Eggs
This chart, with a seemingly cryptic symbol, shows the price of eggs (specifically, the price of one dozen of large, Grade A eggs) compared against the U.S. money supply (M2). The chart is actually quite ominous, and I'll explain why. The price of eggs is soaring at a record pace even as the supply of money is shrinking at a record pace. For the first time on record, the price of eggs relative to the supply of money has reached a level above the 6-month EMA ribbon, which has historically always acted as resistance. From a conceptual perspective, what this chart actually means is that more of consumers' wealth must go into meeting their basic food needs. Thus, consumers will have less wealth to spend on other goods and services. Since eggs are inferior goods, meaning that one's demand for eggs increases as one's income goes down, the soaring price of eggs may actually be confounded by increasing demand (alongside supply constraints). If demand of these inferior goods increases as unemployment goes up, and eggs remain scarce, the price can soar even higher as the below chart suggests.
This chart shows the yearly Stochastic RSI is only now just beginning to oscillate up. This means that the upward pressure on the price of eggs may last for years to come. Of course, eggs are commodities. When commodity prices inflate even as the central bank tightens the money supply, this may result in stagflation. Commodity inflation is a central bank's worst nightmare because it makes it difficult to pivot to easier monetary conditions to stimulate a slowing economy. If a central bank pivots to easier monetary conditions before commodity inflation is mitigated, then commodity prices will not just continue to rise, but they may hyperinflate. Thus, this inflationary spiral in the price of eggs is sending an ominous warning about the coming Great Stagflation.
Chart 15 - Money Supply
This chart shows that for the first time, when looking back to 1960, the U.S. money supply (M2) actually declined year-over-year. The amount of dollars removed from the money supply in 2022, could carpet the country of Luxembourg and spill into Belgium, Germany and France, or if each dollar were lined up lengthwise, would span the distance from earth to the moon more than 100 times over. Fortunately though, enough dollars still exist within the M2 money supply, that if each dollar was lined up lengthwise, it would reach from earth to past Uranus, the second most distant planet in our solar system.
Chart 16 - The Fed's Balance Sheet
The chart on the left of the two charts shown above, shows what appears to be the Federal Reserve rapidly rolling off assets off its balance sheet in 2022, and into 2023. However, when put into perspective, as illustrated by the chart on the right, the past year of balance sheet rolloffs barely scratches the surface of the total amount of assets that the Federal Reserve added to its balance sheet over the decades of monetary easing. In the years to come, the global financial system will have to grapple with the consequences of the monetary easing experiment ending.
Chart 17 - Dollar Index (DXY)
This chart shows what appears to be the U.S. dollar index (DXY) breaking out of a bull flag on this yearly chart. In doing so, it is also breaking out above the resistance of its EMA ribbon, as shown in the chart on the right. On a conceptual level, by tightening the money supply more than the central banks of other countries, the Federal Reserve is effectively exporting inflation to those countries, and averting domestic commodity shortages. Yet, as with everything, there are disadvantages to doing this. Tightening the U.S. money supply too much can cause global liquidity issues since the U.S. dollar is the world's reserve currency and most global debt is denominated in it. Already the Bank for International Settlements (BIS) has warned of dollar liquidity issues in the FX swaps and forwards market. If commodity inflation resurges, and forces the U.S. Federal Reserve to hike more than anticipated, this could cause a global liquidity crisis. Destabilizing the fragile and highly leveraged dollar-denominated global debt and derivatives market could ultimately accelerate the move away from the dollar standard. This Catch-22 is likely to result in a Great Stagflation.
Chart 18 - Soaring Risk-Free Rate
This chart shows a clear trend break in the yields of 10-year U.S. Treasury bonds. The era of lower and lower interest rates over time is over. In theory, when the interest rate on a bond rises, this occurs because the market perceives greater risks associated with holding that bond. Therefore, the rapid rise in the risk-free rate (10-year U.S. Treasury yield), means that suddenly this risk-free asset is more... risky. Since holding any other asset, except physical cash and physical gold, is considered some degree more risky than holding U.S. Treasury bonds, then all other assets become more risky as well. One would expect this to happen as the monetary easing experiment comes to an end, and the everything bubble deflates.
Chart 19 - Extreme Yield Curve Inversion
This chart shows the yield curve inversion between the 10-year U.S. Treasury bond and the 3-month U.S. Treasury bill. Just days ago, the inversion slipped to the steepest inversion since the early 1980s. This is often considered a reliable recession indicator because these yields have never inverted without a recession ensuing. Effectively, these yields only invert because the central bank is tightening the money supply. When yields are inverted, bank lending declines because banks can no longer profitably borrow at short term rates to lend at long term rates. Since bank credit creates the most amount of money in a capitalist economy, a yield curve inversion is a warning of impending decline in the money supply, and therefore an impending decline in corporate earnings and consumer spending. Corporations can only earn, and consumers can only spend, some subset of the total money supply. Right now, that warning is blaring the loudest it has in over 40 years. In fact, we've never had such a steep inversion while the global economy is as leveraged as it is. Only time will tell how this will play out, but it's unlikely to end well.
Chart 20 - Volatility (VIX)
This chart shows the Volatility S&P 500 Index (VIX) in a years-long symmetrical triangle pattern. This triangle pattern will likely end at some point this year, or early next year. Since the yield curve is inverted, this pattern will quite likely end with a breakout. Indeed, the yearly Stochastic RSI momentum for the VIX is upward, as shown in the chart below.
Chart 20a
As noted above, this chart shows that the yearly Stochastic RSI for the VIX is on a bull run.
Chart 21 - Job Openings
This chart shows that job openings reached the +2 standard deviation from their mean in early 2022. This was likely not just a business cycle high, but more likely, this was a supercycle high. The U.S. economy is unlikely to achieve such a high amount of job openings again for the foreseeable future. Since GDP growth barely substantiated such a high amount of job openings, one may conclude that this occurred due to excessive economic stimulation that denotes the monetary easing experiment.
Chart 22 - Dow Jones Industrial Average Index (DJI)
This chart shows that even with the declines in 2022, the Dow Jones Industrial Average Index (DJI) remains at an extremely overbought level. The only other times the DJI has been as overbought as it is now was before the Great Depression and before the Dotcom Bust.
Chart 23 - International Stock Markets
This yearly chart compares the performance of S&P 500 (SPX) to that of the Deutsche Boerse AG German Stock Index DAX (DEU40). As you can see, it looks like the SPX is set to underperform the DEU40, possibly for years to come. Technically, the DEU40 can outperform the SPX by falling by less than it. Thus, this chart does not speak to absolute performance.
Chart 23a
This yearly chart compares the performance of S&P 500 (SPX) to that of the NIFTY 50 (NIFTY). The NIFTY is a benchmark Indian stock market index that represents the weighted average of 50 of the largest Indian companies listed on India's National Stock Exchange (NSE). It looks like the NIFTY has formed a years-long bull pennant relative to the S&P 500, and that the former could be ready to outperform its U.S. counterpart for years to come. It seems that in a defragmenting world with rising tensions between global super powers, a largely neutral India could be poised to outperform. So far, India has become a beneficiary of sanctions on Russia in that it has been able to purchase energy at discounted prices from the latter. Discounted energy prices, in a world that is otherwise struggling with commodity inflation, is a unique advantage that may explain why the NIFTY is set to outperform. Cheap energy enables strong economic growth.
Chart 24 - Emergence of Bitcoin
Let's go on a journey through time to measure just how disruptive the emergence of Bitcoin has become to traditional financial markets.
This chart shows that, in just over a decade's time, Bitcoin has generated more wealth for an investor than the S&P 500 has generated in the past 150 years. Of course, such performance is not sustainable, and the returns of Bitcoin will become less and less impulsive with each successive halving cycle, which is mathematically consistent with a log growth curve function.
Chart 24a
This chart shows that the central bank can use interest rates to deflate the price of risk assets. As Treasury yields rise, risk assets typically decline. This shows that individuals' wealth is controlled by central governments.
Chart 25 - Stock Market Decay
This chart shows the performance of the U.S. stock market (SPX) compared against the performance of Bitcoin over the past ~15 years. There has never, in the history of the stock market, been an asset class that actually turns the exponential growth of the S&P 500 into a decay function like this. Bitcoin has become too disruptive to traditional financial markets, and is undermining central banks' ability to control individuals' wealth. Thus, central banks are preparing to deal with this problem. The solution will likely be in the form of CBDC which will restrict one's ability to convert fiat currency into decentralized cryptocurrency such as Bitcoin. Yet, CBDC can also result in unprecedented control by central governments of the way in which humans transact.
In the coming months, I plan to write a research-based post on Bitcoin, cryptocurrency, and the ways in which blockchain technology and non-fungible tokens (NFTs) will revolutionize the way humans transact, authenticate ownership, and verify originality in a digital space. But for this technology, in a digital world denominated by AI, it will become impossible for humans to distinguish between what is real and what is not.
Important Disclaimer
Nothing in this post should be considered financial advice. Trading and investing always involve risks and one should carefully review all such risks before making a trade or investment decision. Do not buy or sell any security based on anything in this post. Please consult with a financial advisor before making any financial decisions. This post is for educational purposes only.

Seeking Shelter from Recession in the Utilities SectorBoring is better in a recession. Fed Chair reaffirmed his steely resolve to fight inflation. In short, he wants to break the back of inflation "at any cost" to subdue it down to Fed’s target of 2%. Soft-landing is desired. But overcorrection to fend off sticky inflation could tip soft-landing into a hard one.
In a recession, economic activities shrink resulting in declining outputs and softening demand across consumers and businesses. Recession leads to rising unemployment and reduced consumer confidence.
History has ample evidence demonstrating that defensive sectors typically outperform the broad market index by more than 10% on average.
This paper posits a long position in Utilities Select Sector SPDR ETF ("XLU") to harvest potential outperformance gains plus a dividend yield of 3.3% and combined with a short position in CME Micro S&P 500 Index Futures.
INFLATION REMAINS HOT; FED RESOLVED TO FIGHT IT CAN LEAD TO RECESSION
Last week, Federal Reserve Chair Jerome Powell reaffirmed his determination to tame inflation down to its target 2%. He reasserted his singular focus on restoring price stability in the US. If that requires higher interest rates for longer to get back to 2% target, then so be it. That was the key takeaway from Jackson Hole Central Bankers Symposium in Wyoming.
US inflation is much cooler than a year before. History has taught policymakers an expensive lesson to avoid declaring victory too soon.
Softening inflation combined with record low unemployment, strong business climate and resilient consumer balance sheets point to a potential soft-landing. However, over correction could tip into a hard landing.
WHAT HAPPENS IN A RECESION?
During a recession, non-cyclical sectors, like Consumer Staples, Utilities, and Health Care, have historically performed well. The fortunes of these sectors hinge on non-discretionary spending and hence less sensitive to economic fluctuations.
These defensive sectors have outperformed the broad market by more than 10% on average during six of seven past recessions.
Tech & Real Estate rank among the worst-performers. Dependant on discretionary expenditure, these sectors are the first to face the heat when businesses and consumers cut spending as incomes shrink.
UNPACKING THE S&P SELECT SECTOR UTILITIES INDEX
The Utilities Select Sector Index ("Utilities Index") is market-cap-weighted and tracks the performance of the largest thirty utility firms in the S&P 500. It aims to deliver exposure to firms from the electric & water utility, independent & renewable power producers, and gas utility industries.
The Utilities Sector includes firms that provide essential services such as electricity, natural gas, and water. These firms marshal stable cash flows and low debt levels. Consequently, the sector is described as a defensive play which performs well during economic downturns.
The Utilities Index was launched on 16th December 1998. Over the last decade, the index has delivered an average annual return of 5.5%. It exhibits lower risk with a volatility of 12.5%. It is popular among long term investors looking for a defensive investment vehicle.
As of August 2023, the Utilities Index reveals an aggregate price-to-cash flow ratio of 10.1x, price-to-earnings of 19x, and one-year forward price-to-earnings ratio of 17x.
Largest firm in the index weighs in with a market cap of USD 136.6 billion. The smallest firm has a market cap of USD 8.5 billion. Weighted average market cap of the index stands at USD 51.15 billion. Top ten constituents forming 59% of the Utilities Index as of 22nd August 2023 are:
• NextEra Energy (14.85%)
• Southern Company (8.03%)
• Duke Energy (7.5%)
• Sempra (4.88%)
• American Electric Power (4.40%)
• Dominion Energy (4.34%)
• Exelon Corporation (4.32%)
• Constellation Energy Corporation (3.75%)
• Xcel Energy Inc. (3.47%)
• Consolidated Edison Inc. (3.37%)
Twelve-month price targets for the top-10 in the Utilities Index looks compellingly strong except for Constellation Energy and Consolidated Edison. Mean 12-month price targets are on average 14% above the closing price as of August 25th.
Investors securing a long position in the index can expect to generate positive returns from capital gains in addition to a healthy dividend yield.
RESILIENCE OF UTILITIES SECTOR IN A RECESSION
Experts who have been calling recession have been stumped and humbled with the resilience demonstrated by corporations and consumers.
A recession may be round the corner. Or we are living through a rolling recession and rolling recovery which impact one sector at a time.
The chart below produced by State Street Research powerfully captures various sector performance across business cycles. If a recession is round the corner, then holding a long position in Utilities is an astute investor choice.
COMPREHENDING UTILITIES SELECT SECTOR SPDR ETF ("XLU")
XLU is a convenient low-cost option for investors to secure exposure to the U.S. utilities sector. It was launched in Dec 1998 and has a low expense ratio of 0.1% of AUM.
XLU's AUM stands at USD 14.39 billion. Over the last six months, XLU has had a net inflow of USD 150.2 million.
XLU has a 20-day volatility of 12% and a beta of 0.52x. It pays out an annual dividend of USD 2.10 amounting to an annual dividend yield of 3.31%.
TRADE SET UP
A sector's outperformance does not necessarily mean that it will appreciate during a recession. Since, equity prices generally decline during recessions, outperformance can also mean that the decline in defensive and non-cyclical sectors will be less severe than the decline in growth sectors.
Investors can use a spread position to benefit from sectoral outperformance even when equity prices decline. This is because the losses from the long leg will be offset by profits from the short leg which is likely to perform worse.
The proposed trade set up comprises of a long position in XLU and a short position in CME Micro E-Mini S&P 500 Index Futures expiring in December 2023 (MESZ2023).
The XLU ETF settled at USD 63.63 per share on August 25th.
Each lot of MESZ2023 provides a notional exposure of index value times USD 5. MESZ2023 settled at 4463 on August 25th delivering a notional value of USD 22,315.
• Entry: 0.0142
• Target: 0.0160
• Stop Loss: 0.0135
• Profit at Target: USD 5,347
• Loss at Stop: USD 2,200
• Reward/Risk: 2.43x
MARKET DATA
CME Real-time Market Data helps identify trading set-ups and express market views better. If you have futures in your trading portfolio, you can check out on CME Group data plans available that suit your trading needs www.tradingview.com
DISCLAIMER
This case study is for educational purposes only and does not constitute investment recommendations or advice. Nor are they used to promote any specific products, or services.
Trading or investment ideas cited here are for illustration only, as an integral part of a case study to demonstrate the fundamental concepts in risk management or trading under the market scenarios being discussed. Please read the FULL DISCLAIMER the link to which is provided in our profile description.

SPX Should We Prepare For Another Lost Decade?another different perspective of equity markets.
uncertainty ahead.
if it happens , the next economic recovery phase could take years.

Where There is Smoke, There is Fire | CSX Short 🚂Classic short setup for CSX railroad here. It just so happens other railroads are also showing bearish formations with imminent resolution - most likely to the downside - ahead.
Remember: we are at 3.6% unemployment - a rate that has remained historically unsustainable, and elusive if not unattainable - for the last 75 years.
Combining the "large-time-frame" bearish formation of CSX and the current status of the long-run labor market, I think we have a strong case for a weak aggregate demand.
Not to mention, oil has been selling off for a year, despite higher unemployment. So... what gives?

Is the Market Deluding Itself with a Soft Landing Fantasy?As markets surge against expectations, many are starting to believe that the impossible might unfold. The unusually low fund allocation to equities reflects a market sentiment plagued by fear, yet mega caps are continuing to rise against expectations, making some investors feel left behind. With GDP figures beating expectations and headline inflation plummeting, markets are now starting to believe the soft landing narrative. Can the Federal Reserve, after decades of economic engineering, finally dodge a recession? The bond market remains skeptical.
When the yield curve inverted, everyone thought a recession was imminent. However, many overlook the lag between the onset of the inversion and an actual recession. Depending on historical context, a recession can either hit while the yield curve remains inverted or much later, once it has normalised. Thus, relying solely on the yield curve as a recession indicator can be misleading.
Nevertheless, history has consistently shown that a recession follows the inversion at some point. However, the human psyche is notoriously impatient. If a predicted event doesn't manifest promptly, the market tends to discount its possibility. Remember, most people buy at tops and sell at bottoms. So, the real question isn't whether a recession will happen, but rather when.
Why and When Could a Recession Happen?
The Federal Reserve holds significant influence over this timeline. As long as interest rates hover around 5.5%, the recession clock ticks faster. With headline inflation plummeting (orange line) and inflation expectations paralleling this descent (blue line), we must understand what caused inflation initially to gauge where it's headed.
The inflationary surge was mostly driven by the excessive expansion of the money supply. Examining the first derivative of the US money supply (M2) shows a rapid expansion followed by a subsequent decline. Comparing the growth rate of the money supply (yellow line) with the CPI year-over-year (orange line) reveals a 16-month lag. If this lag remains consistent, there's significant potential downside to inflation.
Yet, the Fed continues to hike rates, despite projections of disinflation and deflation. This is because the Fed's job isn't to predict the future, but to respond to current data. Indicators showing a robust labor market and elevated Core PCE caution against prematurely reducing rates. It would be wise for the Fed to await signs of weakening in these indicators before contemplating rate cuts.
This could potentially take a while to materialise, especially since unemployment doesn't seem poised to weaken in the immediate future. Unlike previous business cycles, the current situation stands out due to the Job Openings and Labor Turnover Survey (JOLTS) data. There remains a significant number of job openings for every unemployed individual. This bolsters the resilience of the labor market, making rate cuts less probable.
Furthermore, the Core Personal Consumption Expenditure (PCE) - a lagging indicator - remains historically high and resilient. Powell has emphasised the Fed's intent to avoid repeating the same mistakes made in the '70s, suggesting we should expect higher rates for longer in order to permanently get Core PCE to 2%. He's also highlighted the relative ease of stimulating the economy out of a recession compared to raising rates, implying it might be more straightforward for the Fed to rein in Core PCE by inducing a recession.
Similarly, the government can't afford the risk of the Fed raising rates later on. Considering the government's dependency on low-cost borrowing to manage interest payments on existing debts, higher future rates could pose a big challenge. Fortunately, the Fed uses the Reverse Repo (blue line) as a strategic tool to bypass any potential liquidity crisis until they are able to finance the government's balance sheet (orange line) with cheap debt once again.
Given that interest expenses are nearing 1 trillion USD, the Fed will inevitably have to cut rates to zero and initiate Quantitative Easing (QE) in the future. Remember, the sole limitation to Keynesian economics is inflation. Hence, it's logical for the Fed to avoid risking a resurgence of inflation. In essence, a recession might be essential for the Fed's future assistance to the government.
Deciphering the Stock Market's Puzzle
Despite Powell's frequent emphasis on a 'higher for longer' stance, the market remains skeptical. This is alarming, especially as the full implications of a 5.5% rate haven't been fully experienced by the economy. Once they manifest, job openings will plummet, unemployment figures will surge, and the 'soft landing' illusion might crumble. Historically, such scenarios are common when real rates reach unsustainable levels.
Fortunately for investors, there seems to be room for the AI bubble to continue. Markets typically peak about a month before a sustained increase in unemployment. Hence, forward-looking unemployment indicators like job openings, initial claims (blue line), and continued claims (orange line) are crucial for those wishing to divest before a potential market downturn.
In the current scenario, it might be wise for investors to stay away from higher-risk assets like small caps and cryptocurrencies. Historically, these haven't performed as well as mega caps during liquidity crunches. Investors might want to reconsider taking on additional risks unless there's a sustained surge in global liquidity (yellow line).
Conclusion: A Time for Caution and Opportunity
In conclusion, even though a recession seems inevitable, mega caps may continue their upward trend until the labor market reveals signs of distress. Therefore, it's crucial for investors to closely watch leading unemployment indicators and central bank balance sheets to ensure they're well-positioned for both the upcoming market downturn and the subsequent recovery.
Disclaimer: This article is intended for informational purposes only. It is not intended to be investment advice. Every investment and trading move involves risk, and you should conduct your own research when making a decision. Past performance is not indicative of future results.

VIX - THE RECESSION INEVITABLE?The "VIX = Volatility Index S&P500" has predicted us in the last 3 decades, quite reliable possible "extreme movements".
= Why in the next 2-years such an event could occur, we will take a closer look in the following article.
WHAT IS THE VOLATILITY INDEX S&P500
= Expresses the expected range of fluctuation of the U.S. stock index S&P 500.
= To determine volatility, it measures the distribution of options that run on these stocks.
TABLE OF CONTENTS
- 1st part = VIX
- 2nd part = VIX PROPERTIES + USE
- 3rd part = CURRENT SITUATION
- 4th part = CONCLUSION
PART ONE
"PAST."
If you compare the past of the "VIX" with the S&P500, you will notice that the - 36.47 - mark played / continues to play a very important role.
Every time the "VIX" exceeded the - 36.47 -, there was extreme volatility in the S&P500 and other asset classes.
PAST EXTREME MOVEMENTS .
> 01.10.1998
> 01.10.2008
> 03/02/2020 (near crash)
Why the VIX has such a big impact on the S&P500 and how we can actively factor this into our trading follows in part two.
PART TWO
"VIX CHARACTERISTICS"
The "VIX" provides information on how serious fluctuations could be based on the option volume.
= "VIX" goes up -> Statistically more likely that the S&P500 will fall.
= "VIX" goes down -> Probably that the S&P500 gains slightly.
Additionally, it can be noted that as soon as the "VIX" gets close to - 36.47 - many market participants take profits.
WHY IS THIS SO?
The market has already reached a "VERY VOLATILE point".
> Price - FALLS - fast = SHORT positions will take profits > BUY
> Price - RISES - fast = LONG positions will take profits > SELL
CONSIDERATION OF "VIX" IN TRADING?
"VIX" = Negative correlation to the S&P500 = "VIX" goes up = S&P500 goes down.
= This negative correlation occurs because institutional investors use options to hedge against high volatility (hedge against stocks).
RISING "VIX"
= less liquidity in the stock markets + position reduction = stocks fall
FALLING "VIX"
= More liquidity in the equity markets + position building = equities rise
PART THREE
"CURRENT SITUATION"
> The "CORONA crash" could not make a new HH in the "VIX", which is why this could still be pending at the current view.
= 2020 the market "fell" "35.41%" in the SPX
= 2008 the market "fell" "57.69%" in the SPX
With the technical analysis, I come with the current constellation, to a higher "VIX" value than the 2008 reached.
= which would mean a bigger sell-off.
> Since 2018, we have been testing a "falling resistance line."
= Similar resistance lines resulted in the past when broken, with significant volatility + movement in the S&P500 (= traditional markets).
= The current resistance line has been respected several times, resulting in reactions.
> The "rising resistance line" since 1990 + "the arc" + "the macroeconomic environment", suggest another "VIX" breakout .
> The rising resistance line was tested at the two "extremes" - 01.10.1998 + 01.10.2008 - on.
= this meant, both times, the temporary end of the extreme volatility
= in 2020 we could not reach it, which additionally suggests another "breakout".
> If the price trend continues to consider the direction of the arc, then this leads us to a much higher target than 2008 / ever before.
PART FOUR
CONCLUSION
"If the VIX is high, then it's time to buy, if the VIX is slow, it's time to go"
> Regardless of the outcome of the analysis, anyone who hasn't used the VIX before should now have gained a little insight.
The future looks anything but bright for now, however we can use this time to learn and grow .
The VIX could delay the final decision for another 2-years, which is certainly to the advantage of each of us.
= Despite this still "long" period of time, a decision will be made in the future.
> Let's discuss it in the comments and exchange our perspectives, your view on the whole thing would interest me "burning".
If this idea and explanation has added value to you, I would greatly appreciate a review of it.
Thank you and happy trading!

Stocks, Rates and Inflation: Assessing Risks and OpportunitiesOver the last year, there have been increasing concerns about threats to the US and global economies, mainly due to all the rate hikes from the Fed and other central banks. However, these fears have definitely not played out, as consumer spending and business hiring have shown surprising durability in the US, despite rate hikes and inflation.
Several factors explain the stock rebound since mid-2022:
- Bearish positioning left room for a short squeeze as negative expectations didn’t play out at all. Attention has returned to quality large-cap technology firms leading in AI development like Google and Microsoft, as their innovations promise productivity gains that support growth.
- Ongoing passive investing inflows, corporate buybacks, past fiscal stimulus, and excess savings, the Fed and Treasury generating shadow liquidity, China and Japan keeping rates low and stimulating, the massive deficits of the US government (investors know the US is essentially ‘broke’).
- Inflation coming down is also boosting stocks, as stocks are mainly valued based on inflation, not interest rates.
- The Fed might have finished its hiking cycle or might have one last hike left. Current rate expectations are indicating that rate cuts will come by early 2024.
While earnings seem to be plateauing from peak levels, profitability remains healthy overall. GDP growth remains positive and revised higher, the US economy keeps adding jobs and the unemployment rate remains at record lows.
Global challenges persist, as supply chain disruptions and inflationary pressures from the Ukraine war might come back at any time, despite having significantly subsided. Demographic trends of aging populations in developed countries also drag on labor force expansion and economic growth. High debt loads worldwide likewise limit stimulus options without leading to inflation or instability.
While inflation has moderated, it remains elevated and sensitive to many factors, from geopolitical instability to climate change. More concerning, inflation has eased without a clear link to the Fed’s policy tightening. It’s improbable that the Fed hikes were the ones that pushed inflation from 9.1% down to 3%, as rate hikes act with long and variable lags. This is raising doubts about the Fed, it's forecasting, and its monetary policy’s effectiveness in controlling inflation over the long term, especially as their current super-tight interest rate policy could lead to catastrophic deflation and recession.
Given rising recession risks, the Fed will likely be forced to reverse course and start cutting rates by the end of 2024. This policy whiplash carries risks of its own, as we currently seem to be heading toward a deflationary shock, which might be followed by another inflationary wave. With massive deficits, the Fed also faces constraints from high-interest costs on debt even as its policies try to restrain growth and inflation. The economy isn't a simple dial the Fed can turn on and off. What’s even more concerning, is that the Fed is essentially trying to suppress wage gains and cause unemployment to curb inflation, which is something that could induce an inequality-worsening spiral.
In our opinion, a more balanced approach recognizes that moderate wage growth won’t spur runaway inflation, especially as technology evolves work. The policy should prepare workers for automation and AI through training programs, not just reactively responding to lagging data as it is currently doing. The Fed’s constraints highlight the need for creative solutions to complement monetary policy. The economy is a multifaceted system requiring diverse policy responses.
With vision and flexibility, emerging technologies like AI have immense potential to broadly uplift living standards. But this requires inclusive policies and acknowledging the economy's dynamism. The future likely holds turbulence, but with strategic foresight productivity gains can be harnessed for the benefit of all.
Despite concerns over rising rates, the fundamental backdrop remains favorable for stocks. Many investors have grown excessively bearish and underestimate the market's upside potential. Sentiment and positioning remain bearish and cautious, with most investors underestimating all the positive headwinds for stocks, especially productivity gains from AI, falling inflation, falling rates, and currency debasement.
Crucially, the rally since mid-2022 has not been fueled by leverage, unlike past bubbles. Margin debt levels decreased last year, reducing systemic risk. The market has a strong foundation to build on gains, especially as most unprofitable tech has been clobbered and hasn’t recovered, unlike US tech behemoths. Big tech and AI stocks are leading the way higher, forming a new monopoly built on network effects and immense scale. Their nearly unassailable competitive advantages will drive growth for years to come.
Although in the short-term sentiment has turned bullish, hence a 10% correction is possible, we don’t think that a new bear market is in the cards until stocks make new all-time highs.
In conclusion, while risks remain, the US economy has proven resilient amid rate hikes and inflation. Productivity gains from AI innovations, coupled with prudent and flexible policymaking, can support continued growth and market gains if properly harnessed. Investors should look through short-term volatility and maintain a constructive long-term outlook.

Deciphering Divergent Signals The Complex Economic LandscapeThe global economy continues to face profound uncertainties in the wake of COVID-19's massive disruptions. For policymakers and business leaders, making sense of divergent signals on jobs, inflation, and growth remains imperative yet challenging.
In the United States, inflation pressures appear to be moderately easing after surging to 40-year highs in 2022. The annual Consumer Price Index (CPI) declined to 3% in June from the prior peak of 9.1%. Plunging gasoline and used car prices provided some consumer relief, while housing and food costs remained worryingly elevated. Core CPI, excluding food and energy, dipped to 4.8% but persists well above the Fed’s 2% target.
Supply chain improvements, waning pandemic demand spikes, and the strong dollar making imports cheaper all helped cool inflation. However, risks abound that high prices become entrenched with tight labor markets still buoying wages. Major central banks responded with substantial interest rate hikes to reduce demand, but the full economic drag likely remains unseen. Further supply shocks from geopolitics or weather could also reignite commodity inflation. While the direction seems promising, the Fed vows ongoing vigilance and further tightening until inflation durably falls to acceptable levels. The path back to price stability will be bumpy.
Yet even amidst surging inflation, the US labor market showed resilience through 2022. Employers added over 4 million jobs, driving unemployment down to 3.5%, matching pre-pandemic lows. This simultaneous inflation and job growth confounds historical norms where Fed tightening swiftly slows hiring.
Pandemic-era stimulus and savings initially cushioned households from rate hikes, sustaining consumer demand. Early retirements, long COVID disabilities, caregiving needs, and possibly a cultural rethinking of work also constricted labor supply. With fewer jobseekers available, businesses retained and attracted talent by lifting pay, leading to nominal wage growth even outpacing inflation for some months.
However, the labor market's anomalous buoyancy shows growing fragility. Job openings plunged over 20% since March, tech and housing layoffs multiplied, and wage growth decelerated – all signals of softening demand as higher rates bite. Most economists expect outright job losses in coming months as the Fed induces a deliberate recession to conquer inflation.
Outside the US, other economies show similar labor market resilience assisted by generous pandemic supports. But with emergency stimulus now depleted, Europe especially looks vulnerable. Energy and food inflation strain household budgets as rising rates threaten economies already flirting with recession. Surveys show consumer confidence nosediving across European markets. With less policy space, job losses may mount faster overseas if slowdowns worsen.
Meanwhile, Mexico’s economy and currency proved surprisingly robust. Peso strength reflects Mexico’s expanding manufacturing exports, especially autos, amid US attempts to nearshore production and diversify from China reliance. Remittances from Mexican immigrants also reached new highs, supporting domestic demand. However, complex immigration issues continue challenging US-Mexico ties.
The pandemic undoubtedly accelerated pre-existing workforce transformations. Millions older employees permanently retired. Younger cohorts increasingly spurn traditional career ladders, cobbling together gig work and passion projects. Remote technology facilitated this cultural shift toward customized careers and lifestyle priorities.
Many posit these preferences will now permanently reshape labor markets. Employers clinging to old norms of in-office inflexibility may struggle to hire and retain talent, especially younger workers. Tighter immigration restrictions also constrain domestic labor supply. At the same time, automation and artificial intelligence will transform productivity and skills demands.
In this context, labor shortages could linger regardless of economic cycles. If realized, productivity enhancements from technology could support growth with fewer workers. But displacement risks require better policies around skills retraining, portable benefits, and income supports. Individuals must continually gain new capabilities to stay relevant. The days of lifelong stable employer relationships appear gone.
For policymakers, balancing inflation control and labor health presents acute challenges. Achieving a soft landing that curtails price spikes without triggering mass unemployment hardly looks guaranteed. The Fed’s rapid tightening applies tremendous pressure to an economy still experiencing profound demographic, technological, and cultural realignments.
With less room for stimulus, other central banks face even more daunting dilemmas. Premature efforts to rein in inflation could induce deep recessions and lasting scars. But failure to act also risks runaway prices that erode living standards and stability. There are no easy solutions with both scenarios carrying grave consequences.
For business leaders, adjusting to emerging realities in workforce priorities and automation capabilities remains imperative. Companies that embrace flexible work options, prioritize pay equity, and intelligently integrate technologies will gain a competitive edge in accessing skills and talent. But transitions will inevitably be turbulent.
On the whole, the global economy's trajectory looks cloudy. While the inflation fever appears to be modestly breaking, risks of resurgence remain as long as labor markets show tightness. But just as rising prices moderate, the delayed impacts from massive rate hikes threaten to extinguish job growth and demand. For workers, maintaining adaptability and skills development is mandatory to navigate gathering storms. Any Coming downturn may well play out differently than past recessions due to demographic shifts, cultural evolution, and automation. But with debt levels still stretched thin across sectors, the turbulence could yet prove intense. The path forward promises to be volatile and uneven amidst the lingering pandemic aftershocks. Navigating uncertainty remains imperative but challenging.
