Morgan Stanley - Weekly AnalysisMorgan Stanley - Weekly time frame Analysis
Its traveling in a wedge pattern, once the TG1 is reached, there will be a small pull back, once it is broken, then it will travel towards TG2.
Note: This is only for educational purpose.
Recession

Gold xauusd rate hike on 26 July and looming recession Dear Ziilllaatraders,
A rate hike increases the interest rate in the country whose central bank implements it. This often leads to a stronger currency, in this case, the Dollar, as higher interest rates attract foreign investors seeking higher returns. As a result, the value of the Dollar may rise relative to other currencies, including gold. This could potentially put downward pressure on the XAUUSD price.
But as we have seen after the NFP news, a significant bearish movement has unfolded, making me think that at the end of the month, we will see a bearish candle for the dollar and a bullish candle for XAUUSD. I will let you guys know what the future possible movements are.
Furthermore, we have a looming recession last 2 years had a negative GDP which would suggest a recession is looming. Adding to this, the FED has released a probability chart where you can see that there is more chance of a rate decrease in March 2024. Good to know that we have some time before the highly possible recession.
Conclusion:
short-term retracement of DXY which will pressure XAUUSD down. After this DXY will probably continue the downtrend and so will gold move up to the 2000 levels.
Greetings,
Ziilllaatraders

SP500 Black Swan Event Incoming!Following on from our alternative account which has now become our primary count we have cleaned up the chart and think we are very close to the top of this B wave, as retail traders and the media are turning bullish on the stock markets we think it's a matter of time before the rug is swept out from under the bulls feet and we come crashing down to our target of 3200. A 1300 point move from current prices! What could spark such a sharp move? China invading Taiwan? Inflation staying stickier than analysts expect? Moving into a negative growth environment? There are plenty of things that could spark this move, what it will be is anyones guess. All we know is if our analysis is correct this move will be very sharp and catch a lot of people off guard.

PPI Good News on Inflation Bad News on Recession?S&P 500 INDEX MODEL TRADING PLANS for THU. 07/13
The softer than expected PPI on the top of yesterday's softer inflation numbers are likely going to stoke the "Half Full, Half Empty" debate to a higher pitch. The die-hard bulls would like to see it as an indication of the coveted "soft landing", while the die-hard bears would like to cast this as an indication of potential recession ahead.
The next question that needs to be answered to resolve this debate in one way or another: is the softening inflation going to impact earnings numbers? We will start getting a glimpse into this starting from tomorrow. If early earnings show any unexpected weakness ("unexpected" is the key word there), then we might have seen an interim top; but, if the earnings appear to be on track or with a bias to the upside surprises then the next bull leg could get well entrenched.
The previously stated level of 4500-4505 is the next area of resistance.
Positional Trading Models: Our positional models indicate staying out of the markets until otherwise stated.
By definition, positional trading models may carry the positions overnight and over multiple days, and hence assume trading an index-tracking instrument that trades beyond the regular session, with the trailing stops - if any - being active in the overnight session.
Aggressive/Intraday Models: Our aggressive, intraday models indicate the trading plans below for today.
Aggressive, Intraday Trading Plans:
For today, our aggressive intraday models indicate going long on a break above 4507, 4491, 4467, or 4454 with a 8-point trailing stop, and going short on a break below 4497, 4486, 4478, or 4448 with a 9-point trailing stop.
Models indicate explicit long exits on a break below 4463, 4483, or 4504, and short exits on a break above 4483 or 4500. Models also indicate a break-even hard stop once a trade gets into a 4-point profit level. Models indicate taking these signals from 09:41am EST or later.
By definition the intraday models do not hold any positions overnight - the models exit any open position at the close of the last bar (3:59pm bar or 4:00pm bar, depending on your platform's bar timing convention).
To avoid getting whipsawed, use at least a 5-minute closing or a higher time frame (a 1-minute if you know what you are doing) - depending on your risk tolerance and trading style - to determine the signals.
(WHAT IS THE CREDIBILITY and the PERFORMANCE OF OUR MODEL TRADING PLANS over the LAST WEEK, LAST MONTH, LAST YEAR? Please check for yourself how our pre-published model trades have performed so far! Seeing is believing!)
NOTES - HOW TO INTERPRET/USE THESE TRADING PLANS:
(i) The trading levels identified are derived from our A.I. Powered Quant Models. Depending on the market conditions, these may or may not correspond to any specific indicator(s).
(ii) These trading plans may be used to trade in any instrument that tracks the S&P 500 Index (e.g., ETFs such as SPY, derivatives such as futures and options on futures, and SPX options), triggered by the price levels in the Index. The results of these indicated trades would vary widely depending on the timeframe you use (tick chart, 1 minute, or 5 minute, or 15 minute or 60 minute etc.), the quality of your broker's execution, any slippages, your trading commissions and many other factors.
(iii) These are NOT trading recommendations for any individual(s) and may or may not be suitable to your own financial objectives and risk tolerance - USE these ONLY as educational tools to inform and educate your own trading decisions, at your own risk.
#spx, #spx500, #spy, #sp500, #esmini, #indextrading, #daytrading, #models, #tradingplans, #outlook, #economy, #bear, #yields, #stocks, #futures, #inflation, #recession, #earnings, #ppi

Fasten your seat belt, please.Hello investors.
I repost and re-edit my chart multiple times to be updated.
Take this one as long-term based on daily time frame.
I think, crisis ain't done and the worst will come yet.
We can spot a lot of similarities with 2008, when
Bitcoin does not exist. It is on SP500 chart.
To make is simple I let bars pattern in chart as an example:
It would happen very soon, probably with start in this May ( traditional "Sell in May and go away" ).
Don't read news if wave is done.
This rally was suspicious from its beginning and only made Lehman formation.
I don't expect much upsides - to be clear.
I am just a passenger as you. So let's wait and see.
My belt is fasten already ;-)
With care always,
Emvo.

Guide to Recession - What Is It? Recession is a scary word for any country An economic recession occurs when the economy shrinks. During recessions, even businesses close their doors. Even an individual can see these things with his own eyes:
1. People lose their jobs
2. Investment lose their value
3. Business suffers losses
Note: The recession is part of an economic cycle.
If you haven't read that article, you can check it below:
What is the Recession?
Two consecutive quarters of back-to-back declines in gross domestic product constitute a recession. The recession is followed by the peak phase. Even if a recession lasts only a few months, the economy will not reach its peak after serval years when it ends.
Effect on supply & Demand - The demand for goods decreased due to expensive prices. Supply will keep increasing, and on the other hand, demand will begin to decline. That causes an "excess of supply" and will lead to falling in prices.
A recession usually lasts for a short period, but it can be painful. Every recession has a different cause, but they have the main reason for the cause of the recession.
What is depression? - A deep recession that persists for a long time eventually leads to depression.
During a recession, the inflation rate goes down.
How to avoid recession?
1. Monetary Policy
- Cut interest rates
- Quantitative easing
- helicopter money
2: Fiscal policy
- Tax Cut
- Higher government spending
3: higher inflation target
4: Financial stability
Unemployment :
We know that companies are healthy in expansion, but there is a saying, "too much of anything can be good for nothing."
During peak,
The company is unable to earn the next marginal dollar.
Companies are taking more risk and debt to reset the growth
Not only companies but investors and debtors also invest in risky assets.
Why does lay-off occur?
After the peak phase, companies are unable to earn the next marginal dollar. Now, the business is no more profitable. CCompaniesstart to reduce their costs to enter into a profitable system. For example - Labour
Now, Companies are working with fewer employees. Fewer employees must work more efficiently. Otherwise, they may be lay-off by the company too. You can imagine the workload and pressure.
You may argue that they should leave the company! Really? Guys, we just discussed the employment rate declines. How will you get a job when there is no job? Now, you get it!
Let's assume the effects of the recession on the common man:
Condition 1: He may be laid off.
Condition 2: Perhaps he will be forced to work longer hours. The company is unable to maintain a positive outlook. Fewer employees are doing more work due to massive lay-off. His wages decline, and he has no disposable income.
As a result, consumption rates are reduced, resulting in lower inflation rates. A slowdown in the economy is caused by lower prices, which decrease profits, resulting in more job cuts.
Four Causes of Recession:
1. Economic Shocks
2. Loss of Consumer
3. High-interest rates
4. Sudden stock market crash
1) Economic shocks - When there is an external or economic shock the country faces. For example, COVID-19,
2) Consumer confidence - Negative perception about the economy and the company from consumers who lack confidence in their spending power. Instead of spending, they will choose to save money. As there is no spending, there is no demand for goods and services. The absence of spending results in a lack of demand for goods and services.
3) High-interest rates - High-interest rates will reduce spending. Loans are expensive, so few people take them out. Consumer spending, auto sales, and the housing market will be affected. There can be no good demand if there is no lending. There will be a decline in production.
4) Sudden stock market crash - evade people's trust in the stock market. As a result, they do recall their money and emotion drives them crazy. It can also be considered a psychological factor. As a result, people will not spend money and GDP will decline.
Consumer Spending:
During the recession, consumers don’t have additional income called disposable income.
Consumer spending parts
-- Durable goods - Lasts for more than one year
-- Non-durable goods - Lasts for less than one year
-- Service - Accounting, legal, massage services, etc.
Durable goods surfer during the recession. Non-durable goods are recession-proof because their day-to-day fundamentals are not affected by recessions.
Let's take an example of two stocks,
ABC Food vs ABC car
But, will you stop buying food because of the recession? Will you reduce your consumption of toothpaste, bread, and milk?
The answer is "NO".
Consumers buy the same amount of food in good or bad times, On the other hand, consumers only trade in or trade off their car purchase when they are not only employed but optimistic about the safety of their jobs & confident that they could get a promotion or a high paid job with another employer. And People's disposable income is absorbed during the recession.
Consumer spending is the crucial point to displacing recession.
Auto sales:
As we discussed, few people buy cars during a recession. New car sales count as economic growth. You may have heard about 0% loans. The company facilitates a 0% loan to increase auto sales. Mostly, people repair their cars or buy old cars during the recession.
You may see a boost in the used car market and spare parts selling companies’ sales.
Home sales/housing markets:
I have a question now!
Which is your biggest asset? Most of you will say, my home!
New home sales are part of economic growth. Also, house price impact how wealthy consumer feel. Higher the home prices, the more they feel rich, and vice versa. When home prices are higher, consumers feel they are wealthy and they are willing to spend. But when house price declines, they reduce spending/consumption.
If your biggest asset price declines, you don’t spend and the economy takes a longer time to recover. A higher rate stops increasing the home price because they have to pay more EMI. central bank reduces rates during the recession, and the housing market rate boosts because the loan/EMI is cheap.
Interest rates:
Generally, interest rates decline during a recession. Central banks cut interest rates that’s why loans become cheap.
Benefits of Lower interest rates -
- - Boost in the housing market.
- - Increase sales of durable goods
- - Boost in business investment
- - Bonds and interest rates have an inverse relationship. An economic downturn tends to bring investors to bonds rather than stocks, which can perform well in a recession.
- - During the recession, interest rates are lower and banks higher the criteria for getting loans, so that people can face the abstracts while lending money.
Stock Market:
I want to clarify that, the stock market is not an economy. The economic cycle is lagging behind the market cycle and sentiment cycle. It gives me a chill as a technical analyst and a sad moment as an economics lover. Sometimes it's ahead, and sometimes it's behind. Recession = bear market .
Recession-Proof Industries:
* Consumer staples
* Guilty pleasures
* Utilities
* Healthcare
* Information technology
* Education
I will write about this in the future, but for the time being, let's get back to technical analysis .

Recession Timeframe Horizon Macro Monday (2)
Potential Recession Time Horizon
Below you will find a breakdown of how many months pass before a confirmed Economic Recession (shaded grey areas) after the yield curves first definitive turn back up towards the 0% level:
1) 13 Months (Dec 1978 – Jan 1980)
2) 9 Months (Nov 1980 – July 1981)
3) 16 Months (Mar 1989 – Jul 1990)
4) 12 Months (Mar 2000 – Mar 2001)
5) 22 Months (Feb 2006 – Dec 2007)
6) 6 Months (Aug 2019 – Mar 2020)
7) 4 Months so far (Mar 2023 - ????)
Average Time frame: 13 months (reasonable time horizon would be 6 – 18 months).
I consider the first definitive turn up towards the 0% level as no. 7 on the chart (March 2023). Since this date we have rolled over below the -1% level (see additional chart in comments). March 2023 appears similar to the bounce in Dec 1978 (No. 1 in the chart), it also rolled over to the lower sub -1% level. If we assumed a similar 13 month timeframe to recession commencement as in Dec 1978 of 13 months, which also aligns with our 13 month average above, we would be looking at April 2024 for a recession to commence. Interestingly 1978 - 1980 was a similar peak inflationary period known as the Great Inflation, a defining macroeconomic period of high inflation.
You might be wondering, has a recession ever occurred in the month of April before? I personally thought this was a strange month but it has occurred in the past.
In April 1960 a recession commenced and lasted 10 months to February 1961. The 1960 recession was mainly a result of an over-tight monetary policy whereby the Federal Reserve raised interest rates from 1.75% in mid-1958 to 4% by the end of 1959 and maintained them at that level until June 1960. The Federal Reserves motive for raising interest rates and maintaining them was fear of high inflation (as in early 1951 inflation soared to +9.5%). Is it just me or is this all starting to sound a little too familiar?
If we wanted to cater for all time scenarios in the chart and noted above (no. 1 - 6) we could argue that the start of a recession is possible at the earliest within 6 months (Sept 2023) and at the latest 22 months (Jan 2025). Also, the month of April 2024 has some eerie similarities to two prior recessions, the 1978 and 1960 Recessions.
Lucky 13
Since World War 2 bear markets have on average taken about 13 months to reach their bottom and a further 26 months to recover their losses. Our average time before a recession would start is 13 months. It’s worth remembering that it could take an additional 13 months before a bottom is established and then 2 years or 26 months (2 x 13) of price action below the pre-recession price highs. Over 3 years is a long time to wait to recover losses. It would be pertinent to start deleveraging or increasing your hedge from the 6 month mark (Sept 2023 in this case) as subsequently the likelihood of a 3 year period below the Sept 2023 price levels increase as each month passes. For reference the S&P 500 index has fallen an average of 33% during bear markets over the avg. timeframe of 13 months to the bottom.
I actually find it very hard to accept that a recession is possible in the near term (within 6 - 12 months) and I would in fact argue against it, however I cannot explain away the data in the chart which speaks for itself and warrants at least some consideration & caution. Nothing is a guarantee and maybe this time it will be different, especially factoring in the amount of unprecedented liquidity added to the market in recent years, sticky inflation and financial supports provided to systemically important banks.
All the chart really indicates is a probable window for a recession to start some time between Sept 2023 – Jan 2025 and no guarantees.
The rule of 13 is worth remembering, simply from a timing perspective (before and during a recession) as it may help your timing. Based on two similar periods in history, the 1978 and 1960 recessions suggest the month of April 2024 may be a key date. Again, no guarantees.
It is also worth noting that for the last six recessions, on average, the announcement of when a recession started was up to 8 months after the fact…meaning we will have no direct indication when a recession starts, however the un-inversion of the yield curve (back above the 0% level) and a rise in unemployment will be the early tells, so these are worth paying attention too. We will keep you posted on any sudden changes in these metrics.
I hope the chart is helpful, provides one perspective of which there are many, and can help time and frame the situation we currently find ourselves in. NO GAURANTEES, just probable timeframes that may be worth paying attention too.
PUKA
List of Recessions:
1. COVID-19 Recession (February - April 2020)
2. The Great Recession of 2008 (December 2007 - June 2009)
3. The September 11 Recession (March - November 2001)
4. The Gulf War Recession (July 1990 - March 1991)
5. The Iran/Energy Crisis Recession (July 1981 - November 1982)
6. The Energy Crisis Recession (January - July 1980)
7. The Nixon Recession (December 1969 - November 1970)
8. The “Rolling Adjustment” Recession (April 1960 - February 1961)
9. The Eisenhower Recession (August 1957 - April 1958)
10. The Post-Korean War Recession (July 1953 - May 1954)

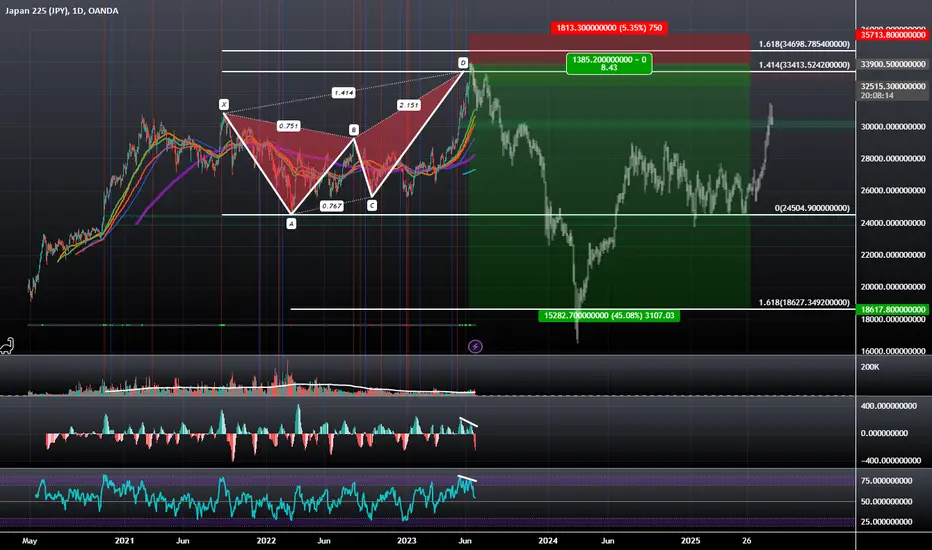
Nikkei 225: Bearish Divergence at Bearish Butterfly PCZThere is Bearish Divergence on both the RSI and MACD at the PCZ of a Bearish Butterfly, and there will hardly be any support until we reach the 1.618 Fibonacci Extension down at 18627JPY, but from the looks of it, it will likely be a very fast drop followed by an even faster recovery, but in the meantime the JPY could gain some strength.
GB10Y - UK pensions at risk? update. #BOE #recession"The Bank of England has hiked interest rates to 5 per cent in a further blow to homeowners struggling with spiralling mortgage costs.
The rise, up from 4.5 per cent, is the sharpest increase since February – surprising economists who had been expecting a smaller increase of 0.25 percentage points – and sends interest rates to their highest level in 15 years!
The move is set to deepen the mortgage crisis as borrowing costs rose for the 13th time in a row in an effort to curb inflation."
*Fractal taken from 2007 high for the GB10Y - Gilt/Bond, reaching similar level's before reversing back down. I would expect the same to happen going forward. inflation is way above current interest rates, with the BOE stuck between banking crisis or a recession. I believe we'll see both! - Banking crisis, potential bail out's - expanding the currency supply further which will create more inflation! Pension's will continue too loose value, as bank of England will not be able to raise rates high enough to match inflation.
"It comes as the rate of inflation remains unexpectedly stubborn – frozen at 8.7 per cent in May. Analysts had expected the Consumer Prices Index, which peaked at 11.1 per cent in October last year, to fall back to 8.4 per cent."
What does this mean for the value of the pound? I'm actually expecting more strength in the GBP - purely from the weakness of the dollar. I would expect the fed to continue to pause now that inflation is finally dropping. FedNow expected to launch on the 1st of July, this will enable faster payment's and a surplus of dollars entering the markets if needed. again weaken's the purchasing power of the DXY - by adding more supply to the currency.

Yields are Yelling: Recession is comingIt looks like we are turning over.
Coupled with gigantic short positioning of speculators on bonds (highest in history bsed on the COT Data), the chart indicates that yields will fall again.
Why would they fall?
Because of a flight to saftey and/or a recession.
I am keeping it very simple, I just buy Bonds via ETF. I am long TLT, IEF and SHY.
With that trade, I am also long USD, since my native currency is EUR.
If we have a weekly close above 3,5% on the US10Y, I will exit my positions.
It might also be lucrative to go short stocks now, but I wont do that too much.
This might be a great trade, but I am viewing it as a set up for an even better one.
We might get a great opportunity to buy stocks soon.

🔥 FED Pauzing Interest Rates Is NOT BullishAs of a couple of minutes ago the FED has announced that they will pauze the interest rates and not hike any further. Since rising interest rates seems bearish for markets, a pauze is often a much more bearish signal.
As seen on the lower chart, once the FED pauzes the hiking cycle ('flat mountain top'), it has often signaled a stock market crash in the not so distant future.
With the most recent pauze, one would be cautious for the future at the very least.
Do you think a stock market crash is coming? Share your thoughts🙏

Signs for a looming recessionInvestigating the 2008 recession, with specific regards to Interest Rates and Inflation.
We can observe a similar pattern occur here. Should history rhyme, we will see at least some more months of bullish price action before the top is set. From there, months of slow decline, before bearish acceleration kicks in - deflation.
Correlative projection puts the top in April 2024, however I have reason to believe that it will happen earlier this time, sometime this year. Reason being, is that the dynamic is different. There is a lot more leverage and this isn't about a housing market. The USD is being ditched as world reserve currency.
Generally, the price increases that we should see in the coming months, would pale in comparison to the price decreases that we will see later. Invest wisely, and stay safe.

Is tomorrow the day we predicted last year to be the market top?FOR THE FULL ANALYTICAL RIGOR THAT IS WORTH READING START HERE (otherwise skip to the section titled if you only care about the future “START HERE IF YOU SKIPPED THE TOP”)
It has been a long year since we got the program working, calculating probabilities, and identifying where we likely were in time. Sometime early 2022, I realized what would happen if we took all S&P 500 price data, applied structured Elliott Wave Theory to it, identified the relationships between all macro and micro wave structures, and determined our current location in time to forecast future movement. By early July 2022, I realized if we completed SubMillennial wave 1--Grand Supercycle 5--Supercycle 1 in January 2022, then I could take prior wave relationships to forecast the 3 waves inside of Supercycle 2 based on the data from Supercycle wave 1. This forecast can be found here:
It forecasted the bottom of the first wave down (Cycle wave A) to end around October 18, 2022, the top of the second wave up (Cycle wave B) to end around mid-July 2023, and the final bottom (Cycle wave C and Supercycle wave 2) likely in the first quarter of 2025. I would update my program every time I believed waves completed and re-calculate these points and the movement over the next few weeks to months. Feel free to head to my profile to view all ideas.
A few reversal points did occur earlier or later than forecasted at higher and lower levels, but I learned the original forecasts were normally the most accurate. One of the key places I rushed a forecast was as we got closer to October 18th I had the bottom occurring later in the October or closer to November. This August 20, 2022 analysis
had the levels and days for the bottom spot on, but I temporarily went a different way. The relational data was proving more and more accurate. The actual bottom in October was on the 13th instead of the first forecast of the 18th. I finally accepted the bottom by December 5, 2022, once I went back to review my older analysis.
From there the program continued to call waves out well, with Primary wave A happening lower than expected but on the date as seen in the December 5th analysis above. Primary wave B was long and the internal wave C never broke below the initial wave A which was confusing, however Primary wave B was forecasted on December 6th to occur in the middle of March and sure enough it occurred on March 13, 2023 as seen below:
But after this original forecasting from the program I continued to attempt to find Primary B in many places after a traditional ABC wave down which never came. Finally by March 2, I reviewed my original analysis and updated Primary wave B to end around March 14 and it ended March 13 as seen here:
Upon completion of Primary wave B, I forecasted the market top and end of Primary wave C. The forecasted date was June 16th no higher than 4403.88 as seen here:
After the completion of Minor wave 2 inside of Intermediate wave 1, I updated the market top to June 20th, based on Intermediate wave 1 likely lasting longer than initially expected when Minor wave 1 ran long as seen here:
At this time I loosely placed Intermediate waves 1-5 in their projected locations as well. The market top was re-adjusted again back to June 16th on April 9th as seen here:
Intermediate wave 2 was forecasted on April 17th as was spot on on April 26th here:
Intermediate wave 3 was much longer than expected after gaining 33% of the expected gain in the first day followed by being slow and trading sideways at times too which is very abnormal of a wave 3. By May 7, I had backed the market top back up to July and then debt ceiling chaos broke out. With the debt ceiling resolved Intermediate wave 3 was still slowly moving. Then my program threw me for the biggest curveball I could not believe and thought it was an error. Intermediate wave 3 had finally wrapped up. All preceding waves to that point had been 12-25 days long. In my wisdom, Intermediate wave 4 would likely be in the middle of that range. The program urged it would only be 2 days AND only retrace 15.06% of Intermediate wave 3’s movement. I was skeptical but went with it and said it could last 4 days.
Intermediate wave 4 lasted only 3 days and after I adjusted the Fibonacci tool retracement levels, 15.06% said the bottom would be at 4261.479 as seen here:
The actual bottom was 4261.07. Finally on June 8, 2023 Ziggy spits out the plan for Intermediate wave 5 as seen here:
START HERE IF YOU SKIPPED THE TOP
The models are pointing for Intermediate wave 5 to last between 3-5 days with the likely top around 4393.93. I chose 4 days and around but not likely over 4400. After all the projections and models and recalculations over the past year we are here. Still around 4400 and back to mid-June. AND it’s Fed day with some high expectations of no hikes and word of a future cut in 2023. Elation should follow if this happens, but what else is going on. Inflation since 2021 is now around 16% and has increased every month since mid-2021. Wages for everyone have not increased even close to 16%. Mortgages are around 7%, not many people rushing to trade their 2% mortgage for a 7% mortgage now. Students with loan need to start paying the piper as they begin to accrue new interest again. Those that did not wisely save their payments and collect interest on that money over the past two years are about to give up some luxuries which means retailers and restaurants are will soon see declining sales. Chaos bound to rattle the 2024 Presidential tickets is just gaining steam with outcomes unknown. Meanwhile the VIX was at its lowest level since pre-COVID last Friday signaling complacency in an economy that continues to lay off workers. All the numbers are not moving synchronously in the proper directions which likely precedes market corrections. In this case, based on all the data, this is likely the major bear market I identified last year.
I can always be wrong, or we can go up a little higher before correcting. But I have learned my lesson to trust the original analysis and that says the top is in. It would be smart to not repeat 2008 and watch your retirement accounts and 401Ks plummet 50% when you have the opportunity to do something about it today. Maybe move to cash or something with less exposure to major companies and indices or the G Fund for you government employees. You may not make much money and can always switch it up if the program is wrong, or you can save your retirement and sit out of the market for 14-18 months until we find the bottom. While others begin recovering and realize they need to pick up a second job or leave retirement for work again (Tom Brady might not mind) to survive, you could then ride the next major bull market up.
Follow me if you would like to see where the models take us moving forward.

XAU/USD - D1 Rise to 2000$ ?Gold in this week can rise to the 2000$. Then the market probably start a correction and gives the Buyers another chance to Long the gold near 1900$.

Last Hurrah of the Bull, or the Next Leg Up? Day 3S&P 500 INDEX MODEL TRADING PLANS for WED. 06/07
The precarious rally of the last month has been baffling many, with the lack of the breadth in the rally was concentrated in just a handful of big-tech names. With the major news cycles in the rear view mirror, that red hot bull could be losing steam. If the rally does not dissipate this week, then it could be indicative of yet another leg up that could obliterate the shorts.
As we first stated to start this week, if you are a bull, it may be prudent to take some profits off the table; if you are a bear, you may begin looking for entries.
Positional Trading Models: Our positional models indicate opening a short on a break below 4275 with a hard stop at 4307.
By definition, positional trading models may carry the positions overnight and over multiple days, and hence assume trading an instrument that trades beyond the regular session, with the trailing stops - if any - being active in the overnight session.
Aggressive/Intraday Models: Our aggressive, intraday models indicate the trading plans below for today.
Aggressive, Intraday Trading Plans for WED. 06/07:
For today, our aggressive intraday models indicate going long on a break above 4291, 4280, or 4268 with a 9-point trailing stop, and going short on a break below 4288, 4277, 4265, or 4250 with a 9-point trailing stop.
Models indicate explicit short exits on a break above 4255. Models also indicate a break-even hard stop once a trade gets into a 4-point profit level. Models indicate taking these signals from 11:16am ET or later.
By definition the intraday models do not hold any positions overnight - the models exit any open position at the close of the last bar (3:59pm bar or 4:00pm bar, depending on your platform's bar timing convention).
To avoid getting whipsawed, use at least a 5-minute closing or a higher time frame (a 1-minute if you know what you are doing) - depending on your risk tolerance and trading style - to determine the signals.
(WHAT IS THE CREDIBILITY and the PERFORMANCE OF OUR MODEL TRADING PLANS over the LAST WEEK, LAST MONTH, LAST YEAR? Please check for yourself how our pre-published model trades have performed so far! Seeing is believing!)
NOTES - HOW TO INTERPRET/USE THESE TRADING PLANS:
(i) The trading levels identified are derived from our A.I. Powered Quant Models. Depending on the market conditions, these may or may not correspond to any specific indicator(s).
(ii) These trading plans may be used to trade in any instrument that tracks the S&P 500 Index (e.g., ETFs such as SPY, derivatives such as futures and options on futures, and SPX options), triggered by the price levels in the Index. The results of these indicated trades would vary widely depending on the timeframe you use (tick chart, 1 minute, or 5 minute, or 15 minute or 60 minute etc.), the quality of your broker's execution, any slippages, your trading commissions and many other factors.
(iii) These are NOT trading recommendations for any individual(s) and may or may not be suitable to your own financial objectives and risk tolerance - USE these ONLY as educational tools to inform and educate your own trading decisions, at your own risk.
#spx, #spx500, #spy, #sp500, #esmini, #indextrading, #daytrading, #models, #tradingplans, #outlook, #economy, #bear, #yields, #stocks, #futures, #inflation, #recession, #fomc, #fed, #fedspeak, #regionalbanks, #debtceiling, #china, #softlanding

untested area downsidemy sentimental analysis for everything is bearish right now
we seem to be due for a massive downside even beyond the levels i marked off to get some orders back
we are approaching a 10 year cycle that MAY activate the markets algorithim to plummet exactly how it did the previous 20 years

What does a bull market look like?Sir John Templeton said: “Bull markets are born on pessimism, grown on skepticism, mature on optimism, and die on euphoria.”
Pessimism:
Following the 2008 crisis, the global economy was engulfed in a cloud of pessimism. Investors were gripped by fear and uncertainty as financial institutions crumbled, economies contracted, and unemployment soared. Stock markets experienced significant declines, and investors became cautious, bracing themselves for further turbulence. This initial stage of pessimism laid the foundation for the birth of a new bull market.
Skepticism:
As the dust settled and economies started to stabilize, skepticism took hold. Investors remained cautious, wary of another downturn and skeptical about the sustainability of the recovery. However, as central banks and governments implemented unprecedented monetary and fiscal stimulus measures QE1,2 & 3, confidence began to slowly seep back into the markets. Gradually, investors started to see signs of improvement, albeit with a sense of skepticism.
Optimism:
The bull market gained momentum as skepticism transformed into optimism. Economic indicators started showing signs of recovery, corporate earnings improved, and investor sentiment shifted towards a more positive outlook. This stage witnessed increased buying activity, as investors sought to capitalize on the upward momentum. As the market continued to rally, optimism became the prevailing sentiment, driving prices higher.
Euphoria:
The final stage of a bull market is characterized by euphoria, a state of extreme excitement and irrational exuberance. During this phase, investors become overly optimistic, disregarding potential risks and buying into the market frenzy. This euphoria is often fueled by widespread media coverage and the fear of missing out (FOMO). In this stage, valuations may become detached from underlying fundamentals, leading to excessive speculation and a heightened risk of a market correction.
Conclusion:
Since the last cycle low established during the 2008 crisis, we have witnessed the birth and evolution of a remarkable bull market. From the depths of pessimism and fear, it grew through skepticism and optimism, ultimately reaching a state of euphoria. It is essential for investors to recognize these stages and exercise caution, especially during the euphoric phase when markets may be prone to excessive speculation and unsustainable valuations. While bull markets provide ample opportunities for wealth creation, it is crucial to remain vigilant and focus on long-term investment strategies that align with underlying fundamentals. By understanding the cyclical nature of bull markets, investors can navigate the ever-changing landscape of financial markets with greater confidence and resilience.
Reference of Nasdaq:
E-mini Nasdaq-100 & Opt
Minimum fluctuation
0.25 index points = $5.00
Micro E-mini Nasdaq-100 Index & Opt
Minimum fluctuation
0.25 index points = $0.50
Disclaimer:
• What presented here is not a recommendation, please consult your licensed broker.
• Our mission is to create lateral thinking skills for every investor and trader, knowing when to take a calculated risk with market uncertainty and a bolder risk when opportunity arises.
CME Real-time Market Data help identify trading set-ups in real-time and express my market views. If you have futures in your trading portfolio, you can check out on CME Group data plans available that suit your trading needs www.tradingview.com

DG has broken its downward trend, showing upward potential.DG recently broke through its downward trend and touched its support line to bounce off upwardly.
DG has an inverse trend to the market due to its budget focused audience. During poor economies DG should rise.
DG sold off quiet a bit as traders became optimistic about the markets conditions in early 2023
Lately new fears of recession are forming making DG a safer bet over tech sector.
DG currently in the low end of its cycle make it good choice for upward momentum

Where is NATTY going next?Huge sell of occurred after breaking it's previous support, turned resistance.
I'd be looking to buy of the resistance @ around 2.050 with the aim of it reaching the broken support.
If it finds resistance there then we might see a H&S pattern emerge which could be severely bloody.
With recession peaking over the corner, this could well play out.
Just my thoughts, not trading advice . Trade at your own risk. NATTY can be expensive .

SPX: Denial on Denial.SPX: Denial on Denial.
There are too much facts going on for anything else to happen than this.
where should I even start.
Highest debt ever above 140% for US. No increased debt ceiling.
Yield curve topped out. Bonds needs to get bought.
Inflation coming down harder and unemployment increasing rapidly.
Core CPI is larger than CPI. harder for households.
More house on the market than ever. Households are not getting sold.
VIX expiration today 17e.
Biggest expiration in QQQ, SPY, IWM, VIX expiration 19e this week.
FED PIVOT is already here. When that happend in history, Recession has always followed.
More outflow in stocks than inflows. Options is the only one saving the market till everything expire and the short bag is to great.

DAX: Recession second wave. Vix exp. risk release.Recession second wave. Vix exp. risk release.
VIX exp 17e.
Options is getting volatile. can be sold today and market will crash before even vix exp.
SQQQ is getting much inflows these days and apple and big tech stocks get heavy shorts these past days into vix exp.
Biggest PUT exp is 19e. We need a lot of downside into that to keep options worth.

Yield curve predicting Recession very soon.TVC:US10Y -US02Y
Looks like we are nearing the recession, it can take from 6 months to 12 months to occur, but for sure.
Recession signals:
1. Unemployment starts to raise.
2. Yield curve is above 0.
3. FEDRATES starts to stay firm and fed starts to cut the rates.(May be consequences)
Only few tech stocks are holding the market up, once they start correcting, we will see drawdown of almost all stocks.
Be prepared to take this golden opportunity to make fortune or atleast protect your assets.
Bear market or recessions are the best time for investment and long term growth as you get base prices and can make money by selling low risk calls.
Hold your bulls and unleash when the time is almost right.

PANW Is this bank stock reversing or a correction?PANW as a stressed back stock has been trending down. However as seen with the regional
banks at large ( KRE as an example ) the bear market had a bullish rally the past couple of
trading days. So, is this a reversal to trade or merely a pullback of the trend down good for
a short entry? On the 15 minute chart price has ascended to outside the Fibonacci bands
(EMA 42 2.618 bands) where mean reversion may soon apply. The fisher transform lines are
approaching the redline above where reversal is statistically likely. On the zero lag MACD,
the lines have crossed and are about to cross the zero line. Overall, the chart suggests to be
that PANW and perhaps the regional banks in general are merely taking a break from the trend
down. I see this as an entry opportunity to join the continuation of the trend and will take
a short position.
