SILVER (XAGUSD): Important Breakout
Silver was accumulating for almost 2 weeks
within a narrow horizontal range on a daily.
The release of the yesterday's fundamentals
triggered a strong bullish movement and the market violated
the resistance of the range.
The broken structure now turned into support.
I think that growth may continue, at least to 31.3
❤️Please, support my work with like, thank you!❤️
Rectangle

Which way for Ocado?Stage 1 base forming for Ocado, almost perfect rectangle, with multiple touches at 370 support.
Is this a chance to go long, or will it break to the downside? wait and see.
Do your own research (DYOR) and this is not a solicitation to make as trade.

Rectangle Top ReversalLook to sell or short
Rectangle Rop Reversal Pattern
Look to ride the wave down
Price headed back towards .58 cent

Gold Probes Bearish Trend Line Resistance - Uptrend Resuming?Gold has had a relatively quiet couple of months, carving out a broad range between $2285 and $2425 since the start of April.
While there are no imminent signs that the range will break any time soon, the precious metal is turning higher off support to test (and potentially break) near-term bearish trend line resistance. A confirmed break here would tilt the odds toward more gains to approach the June high at $2385 and potentially the all-time record high near $2425 in time.
-MW

AUD/USD Range Intact - One Way to Play a BreakAUD/USD has been consolidating within a 120-pip range for the past 6+ weeks, and there are no imminent signs of that range breaking. However, forex traders may still want to prepare for a potential bullish breakout (helped along by a hawkish RBA meeting and weak US retail sales data).
In that scenario, a clean break above 0.6700 could open the door for a continuation toward the 78.6% Fibonacci retracement of the December-April drop at 0.6760 and potentially the December high above 0.6850. However, a false break could lead to a rapid reversal back lower, so risk management will be key.
-MW

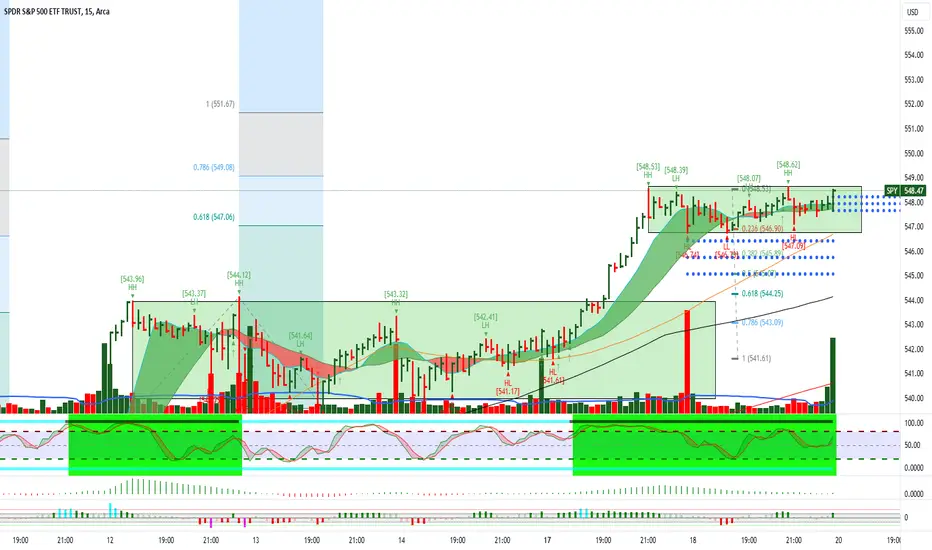
$SPY June 19, 2024AMEX:SPY June 19, 2024
15 Minutes.
Holding 547 AMEX:SPY is aiming for 550-551.5 as next target. Last support for this uptrend is 544 levels which is 61.8% retracement for the last rise as marked.
Gold Analysis Hello all,
Here is my perspective on Gold from the 1D timeframe -
- Price has broken below the upward trendline and is currently retesting the zone of $2300-2280.
- A closure below this area will indicate a long-term trend reversal with the next level of support being found at $2200-2180.
Best regards,
Don4

Long BTCUSDIdea based on Classical chart patterns (Daily Chart).
Abbreviations:
M/W/D/H = Month/Week/Day/Hour
TL: Trendline
DT: Double Top
DTr: Descending Triangle
FW: Falling Wedge
Rct: Rectangle
We are still close to the all time highs, and we have also seen a breakout from a 4W FW on the weekly chart indicating some buying interest left near the relative lows.
When you look at the daily chart, there is a 6W DT which seems to be complete, but the downside breakout bar is with a long wick. And the closing bar was up.
This leads me to suspect this might be a fake breakout. Support is seen close to where we saw the 4W FW pattern completed, with levels close to the last bar acting as key bar to watch. Also, we can see the current market as inside a 20W Rct pattern and we are right around the middle of the box.
if the 6W DT fails the first target will be @ 77363, if completed, the target will become the 4W FW target @ 81678.90, and ultimately 20W Rct target @ 84001.60
the problem with this trade is that we still don't have a confirmation of a failure, so i need to place the stop loss at lows level within the formation of this DT pattern which is May16th low @ 64548, being fully aware that this trade might be one that could cause me to enter multiple times.
Risk reward calculated against capital using the first target is
Entry : 66330 or below
SL : 64548 (-0.73%) / TP: 77363(+4.50%)
RR: Apprx. 6:1
(as always, not investment advise or prediction)

GBPCHF: Important Breakout 🇬🇧🇨🇭
GBPCHF broke and closed below a key daily support.
Retesting the broken structure, the price formed a narrow range on a 4H time frame.
London session opening pushed the prices lower.
The pair broke a support line of the range, leaving a strong bearish clue.
I think that the market may keep falling.
Next support - 1.1224
❤️Please, support my work with like, thank you!❤️

DMart: Ready for new Highs with Bullish StructureClassical inverted H&S Pattern Structure can be seen in this script.
Following points can be considered here before taking any decision:
1. over all Trend is uptrend.
2. Pattern: Bullish IH&S(After healthy Consolidation) Or Inside bar or multiple Resistance BO or Cup and Handle
3. Good Fundamentals
4. over all market structure is also bullish.
DISC: For educational Purposes only. Please consult your financial advisor before taking any position.

GOLD (XAUUSD): Your Trading Plan For This Week
Multiple time frame analysis for Gold.
Price action & important key levels.
Market sentiment and directional bias.
Potential scenarios and thoughts.
❤️Please, support my work with like, thank you!❤️

Coeur Mining Inc. (CDE) - Bullish Rectangle Continuation PatternAnalysis:
Chart Pattern:
Coeur Mining Inc. (CDE) is currently forming a Bullish Rectangle Continuation pattern, indicating potential for an upward breakout.
Support and Resistance: The stock is consolidating between defined support and resistance levels.
Breakout Potential: A breakout above the resistance level could lead to a significant upward movement.
Target Price: The target price can be estimated based on the height of the rectangle.
Stop-Loss: Set a stop-loss just below the support level to manage risk.
Fundamental Overview:
Revenue (TTM): $846.97M
Net Income: -$108.14M
Total Debt: $593.83M
Current Ratio: 1.00
Conclusion:
The Bullish Rectangle Continuation pattern suggests a potential upward breakout, making Coeur Mining Inc. a promising candidate for short-term gains. However, investors should consider the company's current financial challenges and set appropriate risk management measures.
Investment Note:
Trading stocks inherently involves risks. Carefully consider your financial situation and investment goals before making decisions.

GOLD (XAUUSD): Your Trading Plan For Next Week Explained
This Friday, Gold turned very bullish and reached a strong daily resistance.
The underlined red resistance is the upper boundary of a narrow horizontal trading range on a daily.
Next week, look for a breakout of the resistance of the range.
A daily candle close above 2342 will be our strong bullish confirmation.
A bullish continuation will most likely follow then.
Next resistance will be 2736
❤️Please, support my work with like, thank you!❤️

GOLD (XAUUSD): Main Focus is ...
As I predicted yesterday, we got a nice intraday bearish movement on Gold.
Analyzing the price action on a daily time frame today,
I spotted that the market is currently consolidating.
We can see a narrow horizontal trading range.
Those who are looking to buy the market should wait for a breakout
of the resistance of the range.
A daily candle close above 2342 will be our strong bullish confirmation.
A bullish continuation will most likely follow then.
Next resistance will be 2736
❤️Please, support my work with like, thank you!❤️

Legal & General new directionAfter creating a rectangle since Jan 2024, Legal and General has broken to the downside after lacklustre targets issued yesterday. Price is falling below 231 support.
Since March 2013, L&G has gone nowhere and it looks like it could eventually hit 161, if the stock market reverts to a downtrend or business is below expectations.

VBL - 4 months RECTANGLE══════════════════════════════
Since 2014, my markets approach is to spot
trading opportunities based solely on the
development of
CLASSICAL CHART PATTERNS
🤝Let’s learn and grow together 🤝
══════════════════════════════
Hello Traders ✌
After a careful consideration I came to the conclusion that:
- it is crucial to be quick in alerting you with all the opportunities I spot and often I don't post a good pattern because I don't have the opportunity to write down a proper didactical comment;
- since my parameters to identify a Classical Pattern and its scenario are very well defined, many of my comments were and would be redundant;
- the information that I think is important is very simple and can easily be understood just by looking at charts;
For these reasons and hoping to give you a better help, I decided to write comments only when something very specific or interesting shows up, otherwise all the information is shown on the chart.
Thank you all for your support
🔎🔎🔎 ALWAYS REMEMBER
"A pattern IS NOT a Pattern until the breakout is completed. Before that moment it is just a bunch of colorful candlesticks on a chart of your watchlist"
═════════════════════════════
⚠ DISCLAIMER ⚠
The content is The Art Of Charting's personal opinion and it is posted purely for educational purpose and therefore it must not be taken as a direct or indirect investing recommendations or advices. Any action taken upon these information is at your own risk.

AUDCAD: Important Bullish BreakoutThe AUDCAD is currently in a robust uptrend on a daily basis. For the past few weeks, the pair has been trading within a sideways range on a 4-hour chart.
Following the yesterday's US fundamentals, the price broke above the range's resistance, showcasing the dominance of buyers and suggesting a likely continuation of the bullish momentum.
The next level of resistance to watch is at 0.9203.a highly probable bullish continuation.
Next resistance - 0.9203

NZDJPY: Time to Buy 🇳🇿🇯🇵
NZDJPY broke and closed above a key daily structure resistance.
After a breakout, the market started to consolidate within a narrow range on a 4h time frame.
A retest of a broken structure triggered an impulsive bullish movement
and a violation of a resistance of the range.
It gives us a strong bullish confirmation.
I think that the pair will reach 97.5 level soon.
❤️Please, support my work with like, thank you!❤️

AUDCAD May Keep Going Higher 🇦🇺🇨🇦
AUDCAD set a new higher high higher close on a daily,
after a release of the yesterday's US fundamentals.
The pair successfully violated a resistance line of a wide horizontal range on a daily.
We can expect a further bullish continuation now.
Next resistance - 0.918
❤️Please, support my work with like, thank you!❤️

$Rose retest, could it bounce?ROSE has retested back and looking strong after breaking a previous rectangular resistance.
It might still continue if price hold further on support.

NASDAQ INDEX (US100): Potential Scenarios Ahead of FOMC
NASDAQ Index is currently consolidating within a horizontal range.
Most likely, the market participants are waiting for the FOMC tomorrow.
Depending on the reaction of the market to the boundaries of the range,
I see 2 potential scenarios.
Bullish Scenario
If the market breaks and closes above 19115 the resistance of the range,
with a high probability, a bullish rally will continue.
Bearish Scenario
If the Index breaks and closes below 18880 the support of the range,
it may initiate a correctional movement.
I think that US100 may keep being weak before the news release.
Let's see what direction the market will choose tomorrow.
❤️Please, support my work with like, thank you!❤️

$SPY June 11, 2024AMEX:SPY June 11, 2024
15 Minutes.
AMEX:SPY held 532 and did not cross 536.5.
Big consolidation in 15 minutes.
All averages except 200 have converged in 15 minutes.
So, holding 532 I expect 539-540 as target now, today or tomorrow. (Tuesday or Wednesday), as nearly 5 days of consolidation in 15 minutes.
And on breaking down 532, target is 530 being 200 averages.
So not time to short.

AVGO - 3 months RECTANGLE══════════════════════════════
Since 2014, my markets approach is to spot
trading opportunities based solely on the
development of
CLASSICAL CHART PATTERNS
🤝Let’s learn and grow together 🤝
══════════════════════════════
Hello Traders ✌
After a careful consideration I came to the conclusion that:
- it is crucial to be quick in alerting you with all the opportunities I spot and often I don't post a good pattern because I don't have the opportunity to write down a proper didactical comment;
- since my parameters to identify a Classical Pattern and its scenario are very well defined, many of my comments were and would be redundant;
- the information that I think is important is very simple and can easily be understood just by looking at charts;
For these reasons and hoping to give you a better help, I decided to write comments only when something very specific or interesting shows up, otherwise all the information is shown on the chart.
Thank you all for your support
🔎🔎🔎 ALWAYS REMEMBER
"A pattern IS NOT a Pattern until the breakout is completed. Before that moment it is just a bunch of colorful candlesticks on a chart of your watchlist"
═════════════════════════════
⚠ DISCLAIMER ⚠
The content is The Art Of Charting's personal opinion and it is posted purely for educational purpose and therefore it must not be taken as a direct or indirect investing recommendations or advices. Any action taken upon these information is at your own risk.
