$SPY March 7, 2024AMEX:SPY March 7, 2024
15 Minutes.
The gap at open to 510 levels did not allow for a short.
AMEX:SPY taking support on 200 averages and is consolidating for a move.
The moving averages have converged at close.
So holding 508 levels I expect an upward push today towards 513-514 levels.
The stochastics which had a black bar at the bottom have now reversed.
For the rise of 504.91 to 512.05 AMEX:SPY has retraced 50% of the rise, so I expect a top around 514 levels.
As we can see in chat the 512 levels become a resistance, hence I feel the next upward move is only when 514.5 is crossed with a close near the top of the bar.
AMEX:SPY has managed to hold the gap at 503 very well so far.
Rectangle

PIXEL / RangeWe've completed a five-wave structure, removed liquidity above the previous high (ph), and on the linear chart, we're breaking the ascending structure (bos). These indicators suggest a probability of correction towards equal lows (eql), which act as a price magnet.
After removing liquidity at equal lows (eql), I anticipate price action ascending towards the upper level of the sideways channel. This will confirm the range.

USDJPY: Your Trading Plan For Today↪️USDJPY was in an upward trend and reached a new high before entering a consolidation phase in a tight range on the 4-hour chart.
To consider shorting the currency pair with confirmation, it is recommended to wait for a breakout below the support level of the range.
A confirmation of this breakout would be a 4-hour candle closing below the support level. If this occurs, a bearish continuation towards the 147.78 level can be expected.

Rectangle BottomSell opportunity
Rectangle Bottom Pattern
Look to short the breakout to the next level

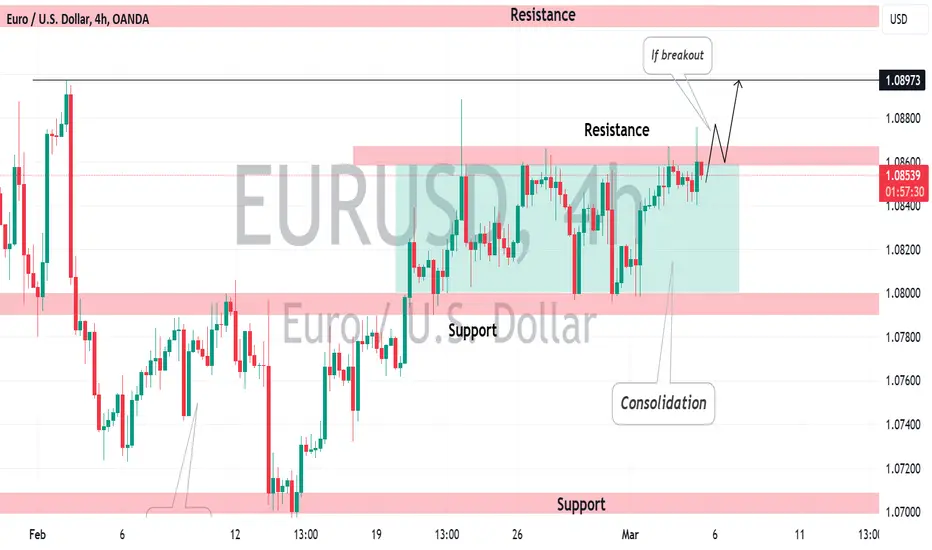
EURUSD: Your Trading Plan For This Week📊EURUSD is currently in a bullish trend, with a consolidation phase happening within a horizontal range after reaching a new higher high.
The resistance of the range is at 1.0867/58, and a break and close above this level on a 4-hour chart could signal a trend-following movement with the next resistance at 1.0897.
On the other hand, a bearish breakout below the support of the range could lead to a bearish continuation in the market.
SILVER - NEW BREAKOUT 🚀Hello Traders !
On The Daily Time Frame, The XAGUSD Reached a Support Level (22.27700 - 21.88300).
The Price Formed a Rectangle Pattern.
The Resistance Level is Broken.
So, I Expect a Bullish Move 📈.
------------
TARGET: 24.16000🎯

SILVER (XAGUSD): Important Breakout 🪙
Silver successfully violated a resistance line of a wide
horizontal trading range on a daily with a strong bullish imbalance.
It may indicate the dominance of the buyers and a strong bullish sentiment.
The market may reach at least 24.0 resistance soon.
❤️Please, support my work with like, thank you!❤️

DCMNVL - BUY ACTIVEDCMNVL - DCM Nouvelle Limited - BUY ACTIVE
Chart Insights : Day Chart
Stock closed at 217 on 04-Mar-23
We can see that stock is broken the resistance with volume and can expect upside move if its sustain above the resistance.
BUY Active only on top of resistance , it may try to retest the same level in coming days , best buy on retest level & keep monitor for future investment.
Drawn support and resistance levels on chart for entry and exit reference

USDJPY: Your Trading Plan For This Week 🇺🇸🇯🇵
USDJPY is trading in a bullish trend.
After the price set a new higher high, we see quite an extended consolidation
within a horizontal range.
150.9 is the resistance of the range.
If the market breaks and closes above that on a daily,
we can anticipate a trend-following movement.
Next resistance will be 151.6
Alternatively, a bearish breakout of the support of the range
may trigger a bearish continuation.
❤️Please, support my work with like, thank you!❤️

Bitcoin is about to reach ATH zone! Are we gonna break it?We're now formalizing consolidation triangle which is mostly telling us about to continue of the trend, means that we're expecting to continue to grow. So by growing we're reaching the resistance of ATH, I think after that we are going for correction, or we're going for correction after breaking ATH.
You thoughts guys?

Darvas Box Strategy Darvas Box Strategy on Bullish outlook
Looking to ride the wave up
Expected bullish move in the next 4 or 5 days
Buy or Long

USDJPY: Waiting For The Next Swing Move 🇺🇸🇯🇵
USDJPY is trading in a bullish trend.
After the price set a new higher high, we see quite an extended consolidation
within a horizontal range.
150.9 is the resistance of the range.
If the market breaks and closes above that on a daily,
we can anticipate a trend-following movement.
Next resistance will be 151.6
Alternatively, a bearish breakout of the support of the range
may trigger a bearish continuation.
❤️Please, support my work with like, thank you!❤️

Bullish Pennant Bullish continuation
Nice looking move too the upside
Look to ride the wave up
Pennant Pattern

AAVE - Rectangle FormationAAVE has formed 2 year rectangle formation.
Need to have a bullish close above 110 and then stops can be placed below 90.
Goodluck!

Scallops Pattern Scallops Descending
Price looks like it’s selling off once again
Sell the next retest of resistance

PYTH - new ATH, can this coin 20x in 2024?Technical analysis
PYTH looks absolutely strong! This coin is listed on all major exchanges and is pretty easy to buy. Why do I think this coin is bullish? We can see that the price is going up after the listing on exchanges, which is a strong sign of interest. It will hit a new all-time high pretty soon, and after that, it can skyrocket. The accumulation phase should be completed, and we are ready for price discovery in 2024. Let me know what you think about my analysis, and please hit boost and follow for more ideas. Trading is not hard if you have a good coach! Thank you, and I wish you successful trades.
About Pyth Network
The Pyth Network is the largest and fastest-growing first-party oracle network. Pyth delivers real-time market data to financial dApps across 40+ blockchains and provides 380+ low-latency price feeds across cryptocurrencies, equities, ETFs, FX pairs, and commodities.
The network comprises some of the world's largest exchanges, market makers, and financial services providers who contribute their own price data for use by smart contracts. Participants in the network include Binance, OKX, Jane Street, Bybit, Cboe Global Markets and more. The Pyth oracle program aggregates their data on-chain to guard against inaccuracies and manipulation. Finally, the protocol allows users to "pull" the latest price onto their blockchain when needed.
In less than a year since the launch of the cross-chain pull oracle, the network has secured over SEED_TVCODER77_ETHBTCDATA:1B in total value. The Pyth Network has been used by over 250 applications to secure $100B in trading volume. Integration with Pyth Price Feeds is permissionless. Let me know what you think about my analysis, and please hit boost and follow for more ideas. Trading is not hard if you have a good coach! Thank you, and I wish you successful trades.

Mask - ready to start an inrcedible uptrendMask is ready to start an incredible uptrend; at least, this is what my analysis suggests. We can see that the downtrend ended with the descending parallel channel, and now the whales are accumulating contracts in this rectangle pattern. You can either wait for a breakout or buy a small correction. 471% profit is the minimum you want, but I believe we are going to go much higher than that. Let me know what you think about my analysis, and please hit boost and follow for more ideas. Thank you, and I wish you successful trades!
Mask Network is a protocol that allows its users to send encrypted messages over Twitter and Facebook. It essentially acts as a bridge between the internet and a decentralized network running on top.
Mask Network was initially launched in July 2019, with its first use case of allowing Facebook and Twitter users to encrypt posts on the social media platforms. It then raised $2 million in a funding round in November 2020, co-led by HashKey and Hash Global, and a further $3 million funding round in February 2021 with participation from Digital Currency Group and Fundamental Labs.
Now, Mask Network offers the ability to fund Gitcoin grant campaigns directly from Twitter, as well as plans to offer peer-to-peer payments and decentralized storage functionality. It is a decentralized portal that also allows users to use DApps like crypto payments, decentralized finance, decentralized storage, e-commerce (digital goods/NFTs) and decentralized organizations (DAO) over the top of existing social networks without migrating, creating what is referred to as a decentralized Applet (DApplet) ecosystem. Let me know what you think about my analysis, and please hit boost and follow for more ideas. Thank you, and I wish you successful trades!

NZDCAD: Classic Bearish Reversal?!📉NZDCAD is currently in a long-term uptrend, but recently it has been consolidating in a horizontal range on the 4-hour chart after reaching a new high.
The support of this range was recently broken, signaling strength from sellers and suggesting a likely bearish correction.
It is possible that prices could drop to the 0.8275 support level.

NZDCAD: Local Bearish Reversal?! 🇳🇿🇨🇦
I see a nice bearish reaction to a key daily horizontal resistance on NZDCAD.
After a test of the underlined blue area, the price started to consolidate and formed
a horizontal range on a 4H time frame.
Its support was violated and for us, it is an import sign of strength of the sellers.
We can expect a bearish continuation now at least to 0.83
❤️Please, support my work with like, thank you!❤️

LINKUSD on a Neutral Analysis (a Little Long Biased) The coin is believed to end the corrective trend and getting heated for a reversal only if the rectangle pattern is broken up with decent volume. The penetration or breaking down the pattern is the confirmation of going either way.

NIFTY tuesday viewIndex witnessed a sideways to bearish day at the opening day of the week !
Resistance placed at 22250-22310
support at 22060 followed by 21930
the overall trend favours a bullish approach ie buy on decline approach

CRUDE OIL (WTI): Detailed Technical Analysis 🛢
Price action analysis for Crude Oil.
Important key levels.
Potential scenarios.
Trading plan explained.
❤️Please, support this video with like and comment!❤️

XVGUSDT - LONG SETUPXVGUSDT has given the clean breakout of long term consolidation. if this breakout holds the next upside targets will be 0.006922 followed by 0.009450
