RITESRITES showing good strength in recent session. And currently trading near strong hurdle. It has a strong resistance near 310-15 levels and rejected many times earlier. So if now closing above 315 may start new momentum rally in the counter which may continue for next 20-22% upwards. On lower side 270 seems very good support But closing above 315 is very crucial. I would avoid before that but surely keep a closer watch on it.
Rectangle

Types of Engulfing Candles!In trading, an Engulfing candle (or Engulfing pattern) is a two-candle reversal pattern that can indicate a potential change in market direction. It is commonly used in technical analysis in both bullish and bearish contexts.
Types of Engulfing Candles
1. Bullish Engulfing Pattern:
Occurs during a downtrend.
The first candle is bearish (red or black), showing continued selling pressure.
The second candle is bullish (green or white) and completely engulfs the body of the first candle (its open is lower and close is higher).
This pattern signals a potential reversal to the upside.
2. Bearish Engulfing Pattern:
Occurs during an uptrend.
The first candle is bullish.
The second candle is bearish and completely engulfs the first candle's body (its open is higher and close is lower).
This pattern signals a potential reversal to the downside.
Key Characteristics
The second candle’s body must fully engulf the first candle’s body (wicks/tails are not necessary to engulf).
The stronger the engulfing candle (in terms of size and volume), the more significant the signal may be.
Often more reliable when confirmed with volume or used in conjunction with other technical indicators (e.g., RSI, support/resistance levels).
Example:
Bullish Engulfing Example:
Day 1: Bearish candle opens at $100 and closes at $95.
Day 2: Bullish candle opens at $94 and closes at $101 — it completely engulfs Day 1's body.
This would suggest a potential shift from sellers to buyers.

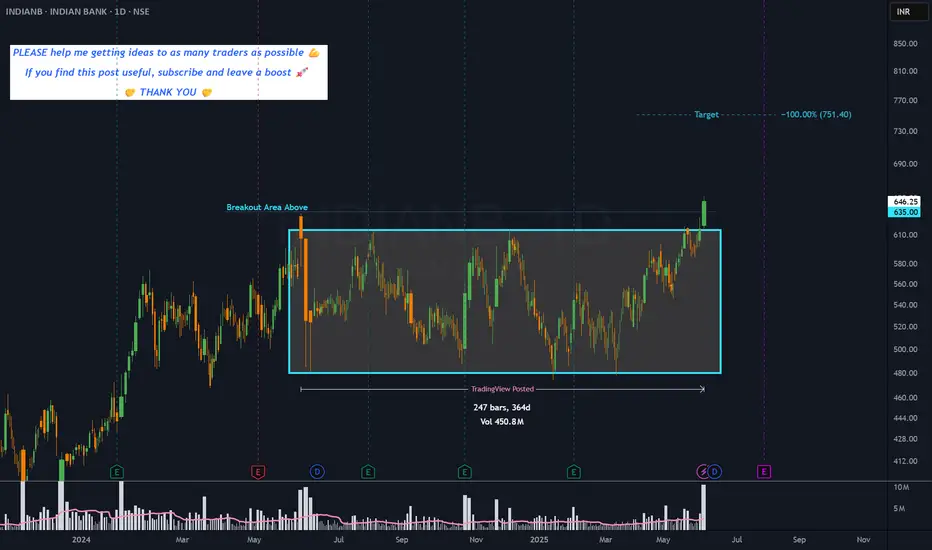
INDIANB - 1 year RECTANGLE══════════════════════════════
Since 2014, my markets approach is to spot
trading opportunities based solely on the
development of
CLASSICAL CHART PATTERNS
🤝Let’s learn and grow together 🤝
══════════════════════════════
Hello Traders ✌
After a careful consideration I came to the conclusion that:
- it is crucial to be quick in alerting you with all the opportunities I spot and often I don't post a good pattern because I don't have the opportunity to write down a proper didactical comment;
- since my parameters to identify a Classical Pattern and its scenario are very well defined, many of my comments were and would be redundant;
- the information that I think is important is very simple and can easily be understood just by looking at charts;
For these reasons and hoping to give you a better help, I decided to write comments only when something very specific or interesting shows up, otherwise all the information is shown on the chart.
Thank you all for your support
🔎🔎🔎 ALWAYS REMEMBER
"A pattern IS NOT a Pattern until the breakout is completed. Before that moment it is just a bunch of colorful candlesticks on a chart of your watchlist"
═════════════════════════════
⚠ DISCLAIMER ⚠
Breakout Area, Target, Levels, each line drawn on this chart and any other content represent just The Art Of Charting’s personal opinion and it is posted purely for educational purposes. Therefore it must not be taken as a direct or indirect investing recommendations or advices. Entry Point, Initial Stop Loss and Targets depend on your personal and unique Trading Plan Tactics and Money Management rules, Any action taken upon these information is at your own risk.
═════════════════════════════
Solana (SOL) Rectangle (4H)BINANCE:SOLUSDT appears to be forming a rectangle, clearly visible on the 4H chart.
Key Levels to Watch
• $160: Support
• $185: Resistance
Measured Targets
Activated, respectively, with a 4H close with good volume below support or above resistance.
• $135: Rectangle Short Target
• $210: Rectangle Long Target

TMGH's Current Peak ZoneTMG Holding trend has reached its peak zone at the resistance line 55.661. Historically, it is expected to rebound to the support line at 55.2, then the support line at 54.987 and 54.916. In conclusion, it increased by 0.09% due to TMGH signing a memorandum of understanding to develop a new large-scale mixed-use project on a 14 million sqm plot, as part of its regional expansion strategy focused on replicating its integrated city model in Middle Eastern markets, as per a disclosure, regarding negotiations with local Iraqi authorities, is expected to include approximately 46,000 mixed-use units. It will focus on high-quality housing, smart infrastructure, and sustainability.

EGX30 Increases by 0.62%EGX30 stock has jumped to an upper region, and it's apparent that this has been a gradual upward trend due to a mutual connection between positive fundamental news and the technical candlestick analysis. It has already breached the resistance line of 32,621.248 and reached the maximum at 32,695.736 points. On a personal level, I expect it to rebound not because of any negative news but because of taking into consideration the short-term history patterns. In case of rebounding, it may reach the support line 32,536.119, the support line 32,408.426, then the support line 32,376.503. In conclusion, EGX30 is increasing in the pink region by 0.62%.

Bitcoin Wave Analysis – 29 May 2025
- Bitcoin broke daily up channel
- Likely to fall to support level 105000.00
Bitcoin cryptocurrency recently broke the support trendline of the sharp daily up channel from the start of April intersecting with the 50% Fibonacci correction of the upward impulse from the middle of May.
The breakout of this up channel stopped the previous impulse wave 5 of the extended upward impulse wave (3) from April.
Bitcoin cryptocurrency can be expected to fall to the next support level 105,000.00, the breakout of which can lead to further losses toward 102150,00 (low of the previous minor correction 4).

Lam Research May Be Done ConsolidatingLam Research rallied sharply in late April and early May. Now, after a period of consolidation, some traders may expect a breakout.
The first pattern on today’s chart is the bullish price gap on May 12 after Treasury Secretary Scott Bessent lowered tariffs on China. LRCX spent the next two weeks in a range between $79.78 and $86.04, while holding above its March high. Did new support form above old resistance?
The maker of chip equipment established itself above the 200-day simple moving average (SMA) in the process. The 200-day SMA is also turning positive. Those signals may be consistent with longer-term bullishness.
Next, the 8-day exponential moving average (EMA) is above the 21-day EMA and MACD is rising. Those signals may be consistent with shorter-term bullishness.
Check out TradingView's The Leap competition sponsored by TradeStation.
TradeStation has, for decades, advanced the trading industry, providing access to stocks, options and futures. If you're born to trade, we could be for you. See our Overview for more.
Past performance, whether actual or indicated by historical tests of strategies, is no guarantee of future performance or success. There is a possibility that you may sustain a loss equal to or greater than your entire investment regardless of which asset class you trade (equities, options or futures); therefore, you should not invest or risk money that you cannot afford to lose. Online trading is not suitable for all investors. View the document titled Characteristics and Risks of Standardized Options at www.TradeStation.com . Before trading any asset class, customers must read the relevant risk disclosure statements on www.TradeStation.com . System access and trade placement and execution may be delayed or fail due to market volatility and volume, quote delays, system and software errors, Internet traffic, outages and other factors.
Securities and futures trading is offered to self-directed customers by TradeStation Securities, Inc., a broker-dealer registered with the Securities and Exchange Commission and a futures commission merchant licensed with the Commodity Futures Trading Commission). TradeStation Securities is a member of the Financial Industry Regulatory Authority, the National Futures Association, and a number of exchanges.
TradeStation Securities, Inc. and TradeStation Technologies, Inc. are each wholly owned subsidiaries of TradeStation Group, Inc., both operating, and providing products and services, under the TradeStation brand and trademark. When applying for, or purchasing, accounts, subscriptions, products and services, it is important that you know which company you will be dealing with. Visit www.TradeStation.com for further important information explaining what this means.

EURJPY: Move Up Ahead! 🇪🇺🇯🇵
EURJPY is going to rise more after breaking
a resistance line of a tiny horizontal consolidation range
that was formed on a retest of a recently broken daily structure.
Goal - 164.8
❤️Please, support my work with like, thank you!❤️
I am part of Trade Nation's Influencer program and receive a monthly fee for using their TradingView charts in my analysis.

Silver Wave Analysis – 28 May 2025
- Silver reversed from resistance level 33.70
- Likely to fall to support level 31.70
Silver recently reversed from the resistance level 33.70 (which is the upper border of the sideways price range inside which the price has been trading from April).
The resistance area near the resistance level 33.70 was strengthened by the upper daily Bollinger Band.
Silver can be expected to fall to the next support level 31.70 (lower border of the active sideways price, which reversed the previous waves a and 2).

Cardano (ADA) Rectangle + Internal Uptrend (1D)BINANCE:ADAUSDT has spent months ranging between ~$0.51 and ~$1.15, and the structure now clearly qualifies as a rectangle pattern.
After a 3rd touch on support in April, Cardano is showing strength with steady higher lows and a reclaim of a key High Volume Node (HVN).
Key Levels to Watch
• Main Demand: ~$0.51-$0.58
• Rectangle Support: ~$0.51
• Rectangle Resistance: ~$1.15
• Internal Uptrend Support: Rising diagonal from April
• HVN Zone: ~$0.75 — key volume cluster
• Rectangle Midline: ~$0.83 — also a previous S/R
• Main Supply: $1.10–$1.32
Measured Target
If price breaks above $1.15 with volume, the rectangle measured move points to ~$1.80.
Context
ADA has respected this range for nearly half a year. A breakout could mark the start of a macro bullish leg.
Triggers
• Bullish: Clean daily close above $1.15 with volume → $1.80 target activated. For a safer entry, it could be worth waiting a full breakout from the main supply above $1.32.
• Bearish: Breakdown of the ascending trendline and HVN → Potential return to ~$0.51. Failure to hold that level could lead to further downside to the previous ~$0.30 demand zone.

USDCAD: Bearish Outlook For This Week Explained 🇺🇸🇨🇦
USDCAD will likely continue a bearish trend that the market
established in February.
A bearish breakout of a support line of a horizontal parallel
channel on a daily provides a strong confirmation.
Next goal - 1.3655
❤️Please, support my work with like, thank you!❤️
I am part of Trade Nation's Influencer program and receive a monthly fee for using their TradingView charts in my analysis.

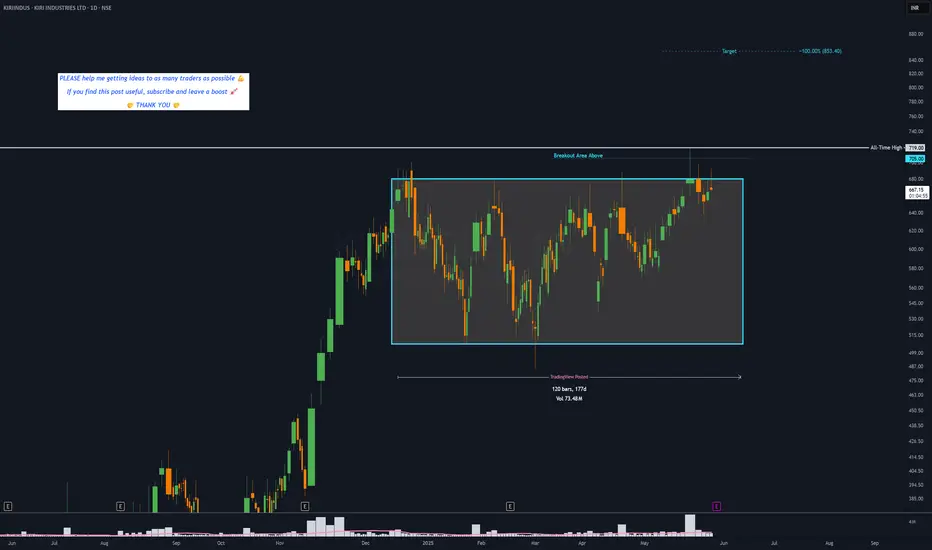
KIRIINDUS - 4 months RECTANGLE══════════════════════════════
Since 2014, my markets approach is to spot
trading opportunities based solely on the
development of
CLASSICAL CHART PATTERNS
🤝Let’s learn and grow together 🤝
══════════════════════════════
Hello Traders ✌
After a careful consideration I came to the conclusion that:
- it is crucial to be quick in alerting you with all the opportunities I spot and often I don't post a good pattern because I don't have the opportunity to write down a proper didactical comment;
- since my parameters to identify a Classical Pattern and its scenario are very well defined, many of my comments were and would be redundant;
- the information that I think is important is very simple and can easily be understood just by looking at charts;
For these reasons and hoping to give you a better help, I decided to write comments only when something very specific or interesting shows up, otherwise all the information is shown on the chart.
Thank you all for your support
🔎🔎🔎 ALWAYS REMEMBER
"A pattern IS NOT a Pattern until the breakout is completed. Before that moment it is just a bunch of colorful candlesticks on a chart of your watchlist"
═════════════════════════════
⚠ DISCLAIMER ⚠
Breakout Area, Target, Levels, each line drawn on this chart and any other content represent just The Art Of Charting’s personal opinion and it is posted purely for educational purposes. Therefore it must not be taken as a direct or indirect investing recommendations or advices. Entry Point, Initial Stop Loss and Targets depend on your personal and unique Trading Plan Tactics and Money Management rules, Any action taken upon these information is at your own risk.
═════════════════════════════
DEGO/USDT – Bullish Rectangle Breakout Setup | 1H Chart AnalysisDEGO is currently exhibiting a bullish rectangle formation on the 1-hour chart, a pattern often indicative of continuation in an existing uptrend. The price has been consolidating between clearly defined horizontal support and resistance levels, and it's now approaching a breakout zone.
🔹 Entry Price: $2.0883 (on breakout confirmation)
🔹 Stop Loss: $1.8216 (below support range)
🔹 Immediate TP Level: $2.2850
🔹 Potential Upside: +16.75%
✅ No bearish divergence or reversal signs are currently visible.
A breakout above the rectangle resistance could trigger a strong upward move. As always, traders should wait for confirmation with volume and can adjust take-profit levels based on their individual risk-reward preferences.
This setup remains bullish unless price rejects the breakout zone and closes below the support range.

USDCAD: Bearish Continuation Ahead 🇺🇸🇨🇦
USDCAD completed a consolidation within a horizontal range.
A violation of its support and a daily candle close below that
is a strong bearish signal.
I believe that the price may drop lower next week
and reach at least 1.3655 level.
❤️Please, support my work with like, thank you!❤️
I am part of Trade Nation's Influencer program and receive a monthly fee for using their TradingView charts in my analysis.

Curve (CRV) Structure Analysis (1D)BINANCE:CRVUSDT formed a rounded bottom (cup) and a minor rectangle, and it's currently attempting to break above the local $0.83 resistance.
Key Levels to Watch
• $0.64: Current support and minor rectangle lower boundary
• $0.83: Current resistance, cup and rectangle upper boundary
• $1.00: Measured target from the minor rectangle pattern
• $1.30: Measured target from the cup pattern (within a key supply zone)
Other Important Levels
• $0.20: Key demand zone, and 2024 low
• $0.40-$0.50: Key S/R dating back to November 2022, aligned with the cup bottom
• $1.20-$1.30: Main supply zone, dating back to February 2023
A daily close above $0.83 with volume would confirm the breakout and trigger the targets.

0.26 is a critical level for $DogeAfter spending about two months in the accumulation box Doge is trying to go on a journey of its own. $0.26 is a critical level. If CRYPTOCAP:DOGE manages to break it we might see the usual oscillations boom in the coming weeks.

Aud/Usd Short Idea on 30 min On the 30 min im seeing a range that came from a bearish Leg
Secondly we see the range the market broke currently out bearish
Im looking for a short for a 1:2

EXICOM - Exicom Tele-Systems Limited (Exicom) - BUY ACTIVEChart Insights : Day Chart
Stock closed at 180 on 22-May-2025
We can see stock breaks the resistance and looks retest also completed if its sustain at that level we can see good move upside.
Mentioned Support and Resistance levels on chart.
BUY only on RETEST level and this is pure positional player.
Drawn support and resistance levels on chart for entry and exit reference

DOG Rectangle + Structure AnalysisBITGET:DOGUSDT has been trading in a rectangle since June 2024, with well-defined boundaries.
After a downside deviation in March, it managed to reclaim the range and it's now attempting to break above $0.0040, a key S/R throughout its price history.
Key Levels to Watch
• $0.0018-$0.0020: Main demand zone
• $0.0040: Key S/R in place since May 2024
• $0.0058-$0.0060: Rectangle midline and previous S/R
• $0.0095-$0.0099: Main supply zone
• $0.0170: Measured rectangle target in case of a breakout
A successful daily close above $0.0040 should set the next target around ~$0.0060. Above that, there isn't much separating DOG from another retest of the main demand zone and ATH.

EVLV 1WEVLV — a rectangle pattern has formed, and the 100 MA has crossed above the 200 MA, signaling the start of a potential trend reversal. Targets: $8.29 and $12.94.
As of May 2025, the fundamental outlook for Evolv Technologies Holdings Inc. (ticker: EVLV) is as follows:
The company continues to show strong revenue growth and improving key financial metrics, despite remaining unprofitable. Revenue for 2024 reached $103.9 million, up 31% from 2023, while the net loss was halved to $54 million. EBITDA improved to -$21 million from -$51.8 million the year before. Annual recurring revenue (ARR) grew by 39% to $99.4 million. The company maintains a strong financial position with $51.9 million in cash and zero debt.
The stock is currently trading at $4.44, above its estimated intrinsic value of $2.76 according to AlphaSpread. Analysts remain optimistic, giving EVLV a “Strong Buy” rating and forecasting an average price target of $5.31, suggesting about 19.6% upside potential.
However, investors should keep in mind that the company is still unprofitable, and the current market valuation exceeds its fundamental value.

GOLD LONG VIEW
Hello Traders, here is the full analysis for this pair,
let me know in the comment section below if you have any questions,
the entry will be taken only if all rules of the strategies will be
satisfied. I suggest you keep this pair on your watch list and see if
the rules of your strategy are satisfied.
Dear Traders,
If you like this idea, do not forget to support it with a like and follow.
PLZ! LIKE COMMAND AND SUBSCRIBE

Convex Finance (CVX) Rectangle (1W)BINANCE:CVXUSDT has been trading in a rectangle with well-defined boundaries since January 2023, and it has recently reclaimed the 1-year EMA, potentially shifting the bias to bullish.
Key Levels to Watch
• $1.5-$2.0: Main demand zone and invalidation point for any bullish TA if broken
• $3.0: 1-year EMA, successfully reclaimed and retested as support
• $4.4: Rectangle midline, previously relevant as a S/R
• $6.1-$7.2: Main supply zone and upper boundary of the rectangle
• $13.0: Previous swing high and rectangle breakout target, which would be confirmed by a weekly close above $7.2 with good volume
