EURUSD Set for Breakout? Technical Patterns Point to Big UpsideEURUSD is showing signs of a breakout, with technical patterns pointing towards 1.22. Our analysts explains the setup, risk levels, and how traders can approach this opportunity.
This content is not directed to residents of the EU or UK. Any opinions, news, research, analyses, prices or other information contained on this website is provided as general market commentary and does not constitute investment advice. ThinkMarkets will not accept liability for any loss or damage including, without limitation, to any loss of profit which may arise directly or indirectly from use of or reliance on such information
Rectangle

EURCAD: Bullish Move From Support Confirmed 🇪🇺🇨🇦
EURCAD may continue growing after a strong bullish
reaction to a key daily support.
The market was accumulating for some time on that
within the intraday horizontal range.
Its resistance was broken with both 4H/1H candles.
Next goal - 1.5592
❤️Please, support my work with like, thank you!❤️
I am part of Trade Nation's Influencer program and receive a monthly fee for using their TradingView charts in my analysis.

Don't lose hope on the Thai banks!Staying range-bound over the past 4 years, SET:BANK is now showing a change in behavior. Hugging around the upper bound, SET:BANK looks ready to break out

UK100, Market Top UK 100
Currently Trading at top of 20 year weekly channel
Triple top formation
Currently in distribution phase
Weekly bearish matured divergence
This is expected top of market
Bearish Activity expected on break of distribution phase

EURCHF: One More Gap 🇪🇺🇨🇭
One more gap is going to be filled today.
EURCHF violated a resistance line of a narrow consolidation range
on an hourly time frame.
It looks like the price is heading towards a gap down opening level now.
Goal - 0.9429
❤️Please, support my work with like, thank you!❤️
I am part of Trade Nation's Influencer program and receive a monthly fee for using their TradingView charts in my analysis.

APT Way Down For Long LiqudationsAptos recently hunted lots of short positions during last crash. In February 2 most of the assets crashed a lot. And there is still remaining liquidity and imbalances within the last long wick.
APT has formed a bearish flag in it's consolidation rectangle. It's headed trough 4.5$.
Thanks for reading.

Silver futures trend directionSilver 87431 - Is at Last supply in Phase D. Based on channel pattern we shall expect Silver to drop to 76320 in coming days with resistance at 91850

USOIL - Bracketing A Breakout Opportunity As traders we want to be predictive in our analysis and reactive in our execution. And there is no easier way to follow through with this concept then on a bracketed breakout trading opportunity.
Oil has recently been on a short-term bullish run which has ended with price entering a period of consolidation. Consolidation leads to expansion so I do expect a future breakout to occur.
The question however is in which direction. If I knew the answer I would bet everything I have including the house and the kids on it but unfortunately I don't. (and my wife would kill me).
What I do know, is that there's a good chance that the market will give us a clue of what direction it wants to continue in and that's what I'm waiting for with this trading opportunity.
If you have any questions or comments please leave them below & be sure to show some love by hitting that LIKE button before you go.
Akil

S (Ex FTM) UpdateS has formed a mini bearish flag which will push S towards down.
It's target also lined up with an Orderblock left behind.
Reasonable entry would be 0.4760

GOLD (XAUUSD): 3100 soon?!
Gold closed on Friday, consolidating within the intraday range.
Probabilities are high that growth will resume next week.
Your signal to buy will be a breakout of the underlined resistance on the hourly time frame.
1H candle close above 3087 will confirm the violation.
A bullish continuation will be expected to 3100 level then.
❤️Please, support my work with like, thank you!❤️
I am part of Trade Nation's Influencer program and receive a monthly fee for using their TradingView charts in my analysis.

Pfizer Wave Analysis – 27 March 2025
- Pfizer broke support level 25.20
- Likely to fall to support level 24.70
Pfizer recently broke the pivotal support level 25.20 (lower border of the sideways price range inside which the price has been moving from November).
The breakout of the support level 25.20 accelerated the active impulse wave c of the higher impulse wave B from Janaury.
Given the clear daily downtrend, Pfizer can be expected to fall to the next support level 24.70 (former strong support from November and the target for the completion of the active wave B).

CRUDE OIL(WTI): Bullish Continuation Confirmed
One of the setups that we discussed on a today's live stream
was a bullish flag pattern on WTI Crude Oil on an hourly chart.
Its resistance breakout provides a strong bullish confirmation.
We can expect growth at least to 70 level.
❤️Please, support my work with like, thank you!❤️

BUY - BULLISH AB=CDBINANCE:XRPUSDT looks to be forming a bullish AB=CD pattern, after finding support at 0.618 fib level. Since AB=CD is a continuation pattern. I am expecting the price to reach our projections at point D!

NZDUSD BULLISH BREAKOUT AHEAD?! *NZD/USD: Bullish Breakout Ahead?*
A potential buying opportunity has emerged in the NZD/USD pair, with a key resistance level in focus.
*Trade Idea:*
The NZD/USD pair is poised to fly to 0.6000 from its current price, driven by:
1. *Bullish Technicals*: Technical indicators are flashing bullish signals, hinting at a potential upswing.
2. *RBNZ's Monetary Policy*: The Reserve Bank of New Zealand's decision to maintain its monetary policy stance may support the Kiwi Dollar.
3. *US Dollar Weakness*: A weakening US Dollar, driven by concerns over the US economy and monetary policy, may boost the NZD/USD pair.
*Trade Specifications:*
- *Buy Entry:* Current price (around 0.5850)
- *Target Level:* 0.6000 (150 pips above entry)
- *Stop-Loss:* 0.5750 (100 pips below entry)
*Market Outlook:*
The NZD/USD pair is experiencing a consolidation phase, with market participants awaiting key economic data releases and central bank decisions. A break above the 0.5900 resistance level could trigger a sharp rally.
*Trading Strategy:*
Buy NZD/USD at current price, with a stop-loss at 0.5750. Use the target level to take profits or adjust the stop-loss to break even.
*Risk Management:*
- *Risk-Reward Ratio:* 1:1.5
- *Position Sizing:* 2-3% of trading capital
*Your Feedback Matters:*
If this trade idea and analysis helped you, please:
- *Like* to show appreciation
- *Share* your opinions and feedback
- *Follow* for more trade ideas and market analysis
Keep share your valuable ideas to the Travis 💯

GOLDHello friends
We have created a good pattern, let's see if the price will work or not.
What do you think?
*Trade safely with us*

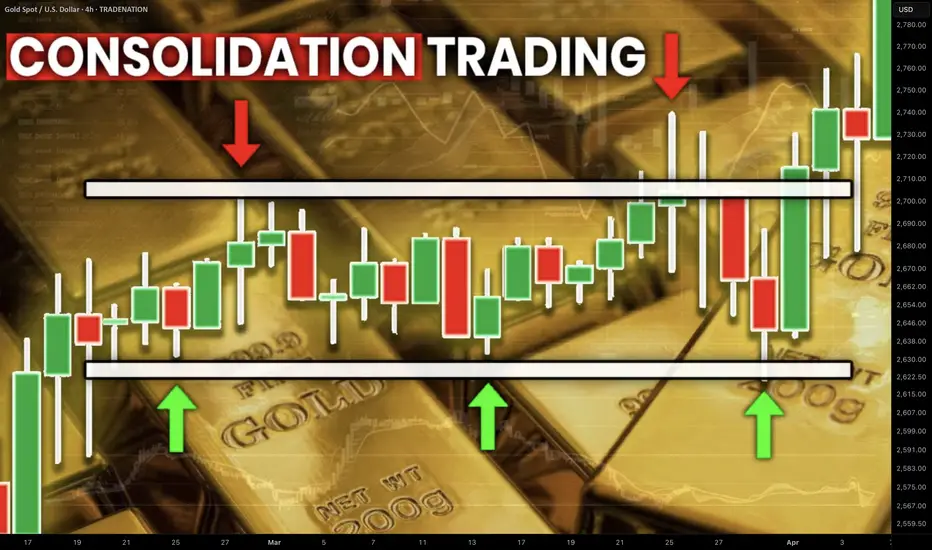
Best GOLD XAUUSD Consolidation Trading Strategy Explained
In article , you will learn how to identify and trade consolidation on Gold easily.
I will share with you my consolidation trading strategy and a lot of useful XAUUSD trading tips.
1. How to Identify Consolidation
In order to trade consolidation, you should learn to recognize that.
The best and reliable way to spot consolidation is to analyse a price action.
Consolidation is the state of the market when it STOPS updating higher highs & higher lows in a bullish trend OR lower lows & lower highs in a bearish trend.
In other words, it is the situation when the market IS NOT trending.
Most of the time, during such a period, the price forms a horizontal channel.
Above is a perfect example of a consolidation on Gold chart on a daily.
We see a horizontal parallel channel with multiple equal or almost equal highs and lows inside.
For a correct trading of a consolidation, you should correctly underline its boundaries.
Following the chart above, the upper boundary - the resistance, is based on the highest high and the highest candle close.
The lowest candle close and the lowest low compose the lower boundary - the support.
2. What Consolidation Means
Spotting the consolidating market, it is important to understand its meaning and the processes that happen inside.
Consolidation signifies that the market found a fair value.
Growth and bullish impulses occur because of the excess of demand on the market, while bearish moves happen because of the excess of supply.
When supply and demand find a balance, sideways movements start .
Look at the price movements on Gold above.
First, the market was rising because of a strong buying pressure.
Finally, the excess of buying interest was curbed by the sellers.
The market started to trade with a sideways range and found the equilibrium
At some moment, demand started to exceed the supply again and the consolidation was violated . The price updated the high and continued growth.
Usually, the violation of the consolidation happens because of some fundamental event that makes the market participants reassess the value of the asset.
At the same time, the institutional traders, the smart money accumulate their trading positions within the consolidation ranges. As the accumulation completes, they push the prices higher/lower, violating the consolidation.
3. How to Trade Consolidation
Once you identified a consolidation on Gold, there are 2 strategies to trade it.
The resistance of the consolidation provides a perfect zone to sell the market from. You simply put your stop loss above the resistance and your take profit should be the upper boundary of the support.
That is the example of a long trade from support of the consolidation on Gold.
The support of the sideways movement will be a safe zone to buy Gold from. Stop loss will lie below the support zone, take profit will be the lower boundary of the resistance.
AS the price reached a take profit level and tested a resistance, that is a short trade from that.
You can follow such a strategy till the price violates the consolidation and establishes a trend.
The market may stay a very extended period of time in sideways, providing a lot of profitable trading opportunities.
What I like about Gold consolidation trading is that the strategy is very straightforward and completely appropriate for beginners.
It works on any time frame and can be used for intraday, swing trading and scalping
❤️Please, support my work with like, thank you!❤️
I am part of Trade Nation's Influencer program and receive a monthly fee for using their TradingView charts in my analysis.
AUD/JPY Chart AnalysisAUD/JPY Chart Analysis
**Key Patterns Identified:**
1. **Rectangle Pattern (Range-bound Market)**
- The price traded within a horizontal range, forming a consolidation zone.
- Two clear support touches at the bottom of the range (labeled as Bottom 1 and Bottom 2).
- The price respected both support and resistance levels multiple times before breaking out.
2. **Double Bottom Formation**
- A classic reversal pattern, signaling potential bullish momentum.
- Bottom 1 and Bottom 2 indicate strong support, where buyers stepped in.
- The breakout above the rectangle confirms the pattern, suggesting further upside potential.
**Breakout Confirmation:**
- The price successfully **broke out** above the rectangle's resistance.
- Volume increased during the breakout, supporting bullish momentum.
- Moving Averages (EMA 7, 21, and 50) are aligned bullishly, confirming the uptrend.
**Target Projection:**
- The expected target is measured based on the rectangle’s height.
- The breakout suggests a potential move towards **97.00** as the next resistance zone.
**Key Levels to Watch:**
- **Support:** 94.50 (previous range support), 95.00 (psychological level).
- **Resistance:** 96.00 (current price zone), 97.00 (breakout target).
**Conclusion:**
- **Bullish Bias:** Price action and technical indicators favor more upside.
- **Watch for Retests:** A pullback to the breakout zone (around 95.00) could offer buying opportunities.
- **Risk Management:** If price re-enters the rectangle, the breakout may fail, requiring reassessment.

ETH, Consolidation and Bullish Divergence, Bullish move expectedLong Consolidation Sharp Downtrend
Trendline resistance broken
Bullish Divergence
Bullish move expected
FOMC meeting and rate cut can bring further rally this week
Take profit if no rate cut and exit
Buy on closing above 1970
Stoploss below 1820
TP at mentioned levels

AUDUSDIt is now going to be bullish when it breaks the previous high.
No divergence
bullish Rectangle
Symmetrical Triangle

NZD/USD: Last chance for USD bulls?NZD/USD is nearing a key resistance level, the last line of defense for the USD bulls. A break below could trigger further USD weakness, pushing NZD/USD higher. Where do you think the market is headed? Share your thoughts in the comments!
This content is not directed to residents of the EU or UK. Any opinions, news, research, analyses, prices or other information contained on this website is provided as general market commentary and does not constitute investment advice. ThinkMarkets will not accept liability for any loss or damage including, without limitation, to any loss of profit which may arise directly or indirectly from use of or reliance on such information

AAPL and MSFT Reading Charts For Better Entries and ExitsOptions Trading Strategy Using Ichimoku Cloud, 200 SMA & Monthly Contracts
(Following Your 3 Trading Rules)
This strategy adapts the Ichimoku Cloud & 200 SMA trend-following method for trading monthly options contracts with a focus on high-probability setups. It leverages time decay (theta), trend strength, and proper timing to maximize gains while reducing risk.
🔹 Strategy Overview
We will trade monthly options contracts using:
Trend confirmation via Ichimoku Cloud & 200 SMA
Directional bias based on price positioning
Entry timing rules to avoid low-probability setups
Theta-friendly positioning (avoiding weeklies to reduce time decay risks)
📈 Trading Rules & Setup
(My 3 Golden Rules)
🚫 No trading on Mondays → Avoids choppy market structure from weekend gaps.
🚫 No trading on Fridays → Avoids gamma risk and weekend time decay.
⏳ No trades before the first 15-minute candle closes → Ensures market direction is established.
📊 Selecting the Right Option Contract
For monthly expiration contracts, select options that:
Expire within 30 to 60 days (avoid weekly contracts to minimize rapid time decay).
Are slightly in-the-money (ITM) or at-the-money (ATM) for higher delta (0.55–0.70).
Have open interest >1,000 and a tight bid-ask spread to ensure liquidity.
Example: If today is June 11, trade the July monthly contract (third Friday of the month).
📉 Bearish Put Play (Short Trade)
200 SMA Bias: Price is below the 200 SMA
Ichimoku Cloud Confirmation:
Price is below the cloud
Tenkan-sen is below Kijun-sen (bearish momentum)
Chikou Span is below price from 26 candles ago
Future cloud is red
Entry Trigger (After First 15 Min Candle):
Price pulls back into the Kijun-sen but rejects it
OR price breaks below the cloud after a weak consolidation
Enter PUT contract (monthly expiration)
Stop Loss & Take Profit:
SL: Above Kijun-sen or recent swing high
TP: First at the cloud’s lower edge, second at a key support level
Exit before Theta decay accelerates (last 14 days before expiry)
📈 Bullish Call Play (Long Trade)
200 SMA Bias: Price is above the 200 SMA
Ichimoku Cloud Confirmation:
Price is above the cloud
Tenkan-sen is above Kijun-sen (bullish momentum)
Chikou Span is above price from 26 candles ago
Future cloud is green
Entry Trigger (After First 15 Min Candle):
Price pulls back into the Kijun-sen but holds
OR price breaks out above the cloud
Enter CALL contract (monthly expiration)
Stop Loss & Take Profit:
SL: Below Kijun-sen or recent swing low
TP: First at the cloud’s upper edge, second at a key resistance level
📊 Trade Management & Adjustments
Rolling: If trade is profitable near expiry but not at the full target, roll to the next monthly contract.
Closing Early: If the trade is at 70-80% max profit, close early to avoid decay risk.
Cutting Losses: If price closes inside the Ichimoku Cloud, consider exiting early (trend loss warning).
🛠 Why This Works for Monthly Options?
✅ Avoids time decay risks of weekly options by trading monthly contracts.
✅ Uses strong trend confirmation from Ichimoku & 200 SMA.
✅ Only trades at high-probability times, avoiding choppy Monday & Friday moves.
✅ Allows scaling into strong trends rather than short-term noise.

USDSEK could jump 5%, learn why. With many top markets trading sideways, we explore USDSEK, which has gained 11% in recent weeks. Is it sustainable given global risks? Probably not. But how can we trade it? Watch the video to find out.
This content is not directed to residents of the EU or UK. Any opinions, news, research, analyses, prices or other information contained on this website is provided as general market commentary and does not constitute investment advice. ThinkMarkets will not accept liability for any loss or damage including, without limitation, to any loss of profit which may arise directly or indirectly from use of or reliance on such information

Nikkei 225 Drops Below Key Levels – What’s Next? The Nikkei 225 has broken out of its previous range, and key levels suggest potential downside risk. With Japan raising interest rates and Trump commenting on the yen, market dynamics are shifting. Technical analysis indicates a possible move lower, targeting the September 6th low. Should traders expect further declines, or will the index recover alongside U.S. stocks? Share your thoughts below!
This content is not directed to residents of the EU or UK. Any opinions, news, research, analyses, prices or other information contained on this website is provided as general market commentary and does not constitute investment advice. ThinkMarkets will not accept liability for any loss or damage including, without limitation, to any loss of profit which may arise directly or indirectly from use of or reliance on such information
