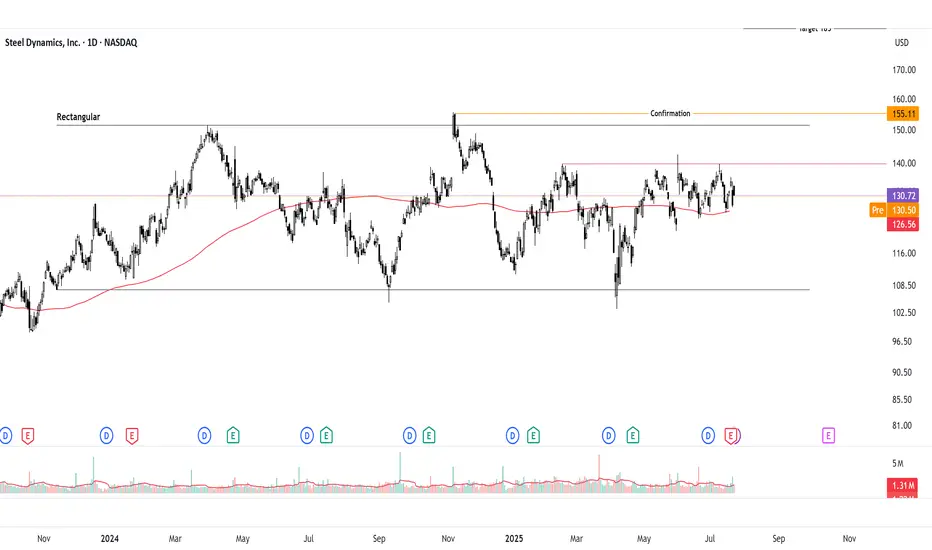
Bullish Breakout Watch on Inverted Head & ShouldersSteel Dynamics ( NASDAQ:STLD ) is consolidating on the daily chart but forming an inverted head and shoulders (IHS) pattern, signaling potential bullish reversal. Neutral until breakout above 140 pivot, but bias leans bullish with supportive steel fundamentals. Long idea on confirmation; current price ~132-135 (as of July 23, 2025). Upside targets offer strong risk-reward if triggered.
Thought Process Walkthrough:
Spotting the Setup: Scanned steel stocks amid sector rebound signals. STLD's daily chart shows a downtrend bottoming at 107, forming IHS: head at 107 support, shoulders higher, neckline ~140. Overlaid rectangular consolidation (107-151.5) adds confluence for breakout potential.
Technical Tools: Used trendlines (descending from highs, capping at 140-151.5), pivot points (140 key reaction level), and classic patterns. No indicators needed—price action clear: volume up on rallies, RSI neutral ~50. IHS target: measure 33-point head-to-neck, add to breakout → ~173 (adjusted to 185 for prior highs). Rectangular height ~44 points → 208 target.
Key Levels:
Support: 107 (IHS head, historical low—break invalidates bull case).
Resistance: 151.5 (rectangular top, past peaks—break above 155 confirms momentum).
These are significant due to repeated price reactions, providing high-probability zones.
Prediction: Consolidation now, but bullish breakout likely if 140 clears on volume, driven by pattern resolution and fundamentals. Without it, range-bound neutrality persists.
Fundamentals Supporting Thesis:
US steel outlook for 2025 shows moderate growth: CAGR ~2.4% through 2030, driven by automotive and construction demand. Economic moderation but robust drivers like infrastructure spending position the sector. For NASDAQ:STLD STLD, Q2 2025 EPS $2.01 missed estimates but operating income rose 39% despite challenges; revenue $4.57B, EBITDA $533M. Management eyes profitability acceleration into 2026 via efficiencies and demand While global capacity rises ~6.7%,US protections and STLD's strong balance sheet support upside.
Rectanglepatterns
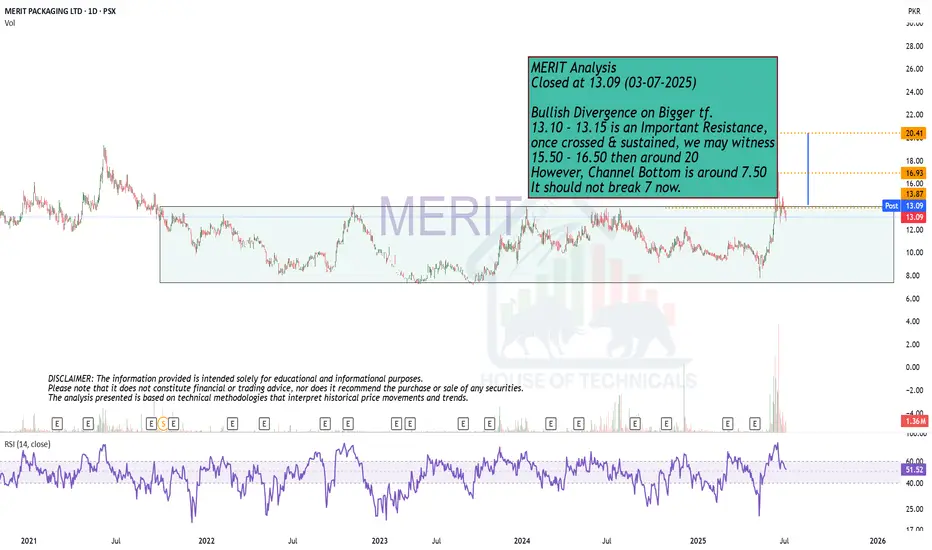
Bullish Divergence on Bigger tf.MERIT Analysis
Closed at 13.09 (03-07-2025)
Bullish Divergence on Bigger tf.
13.10 - 13.15 is an Important Resistance,
once crossed & sustained, we may witness
15.50 - 16.50 then around 20
However, Channel Bottom is around 7.50
It should not break 7 now.
CHFJPY - Bullish Continuation Pattern - Rectangle Pattern NO divergence on RSI - Market in is Bullish Trend forming Continuation Pattern- when market break the above support level - then we can take entry with SL and TP projected.

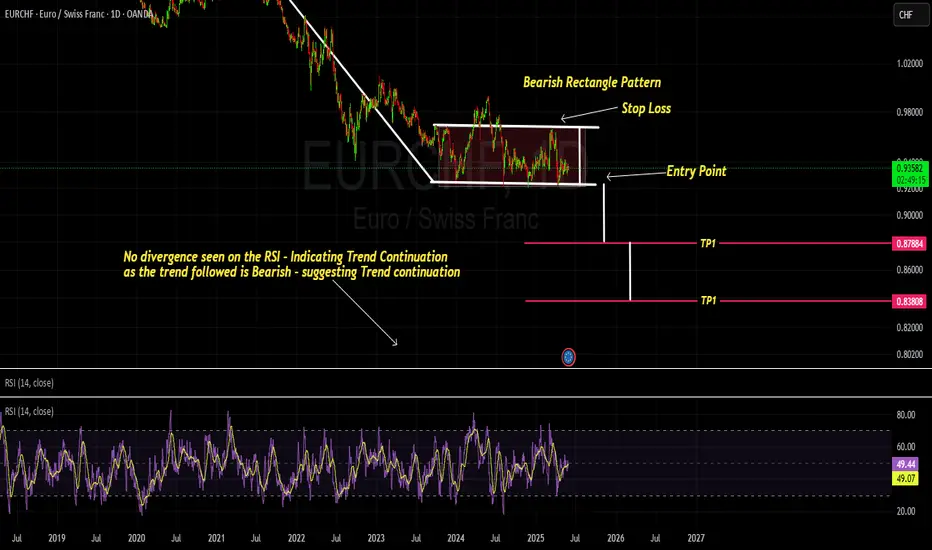
EURCHF - Bearish Rectangle Pattern Market is marking series of LH and LL and then consolidate, forming a rectangle pattern. Projected TP1 and TP2 are given below with the entry point marked with SL above the rectangle pattern.
EURJPY still to expect bearish for new week
OANDA:EURJPY strong bearish bounce from top line of price action, currently price in rectangle and on bottom line of price action.
EUR with all showing self the weakest in last periods and expectations are still to see weaknes, here expecting break of rectangle and trend line of PA and higher bearish continuation till res zone.
SUP zone: 163.300
RES zone: 160.600

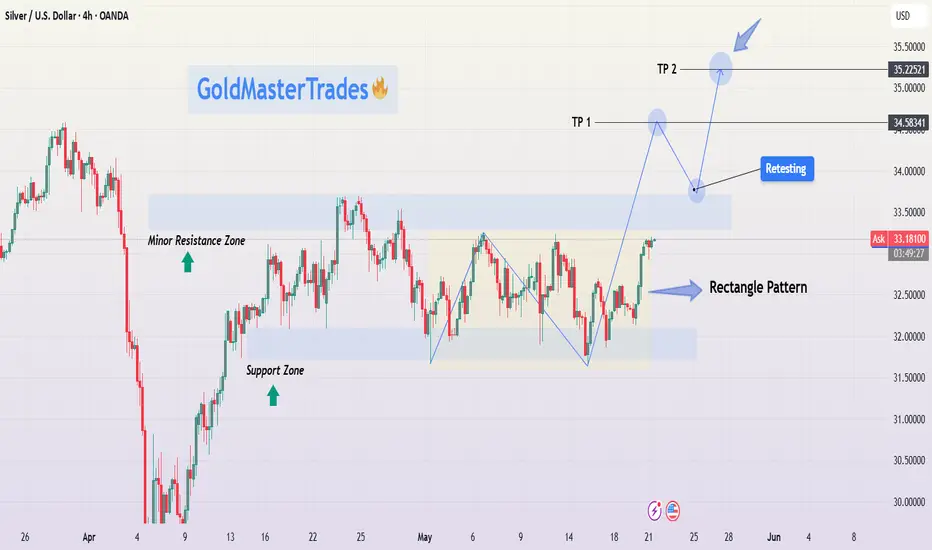
Silver Rectangle Pattern Breakout | XAGUSD Analysis + Target🔍 Technical Overview
Silver has been forming a textbook rectangle consolidation pattern over the past few weeks, bouncing between a clearly defined Support Zone (~$32.10) and Resistance Zone (~$33.40). This range-bound movement indicates accumulation, a phase where smart money typically builds positions before initiating a directional breakout.
Currently, price action shows a breakout attempt toward the upper resistance. If momentum continues, we could see a bullish breakout, followed by a potential retest of the broken resistance (now support). A successful retest would confirm a high-probability setup for a move to higher targets.
📌 Key Technical Zones
Support Zone: ~$32.10
This level has been tested multiple times, with price consistently bouncing higher, signaling strong buyer interest.
Minor Resistance Zone: ~$33.00
Acted as an intermediate ceiling within the rectangle. Once broken, this level became a signpost for bullish continuation.
Main Resistance Zone: ~$33.40
The top boundary of the rectangle; this is the key breakout level.
Target 1 (TP1): $34.58
A logical resistance level based on previous price structure and breakout projection.
Target 2 (TP2): $35.22
A more extended target derived from the height of the rectangle pattern projected from the breakout point (measured move).
⚙️ Price Action Insights
Rectangle Pattern Behavior: Price ranged within horizontal support/resistance, forming consistent highs and lows — a strong signal of accumulation.
Momentum Shift: Recent bullish candles and higher lows suggest buying pressure is increasing.
Breakout in Progress: Price is currently pushing above the upper rectangle boundary. A confirmed breakout candle close followed by a retest would provide a higher-probability entry opportunity.
Retest Strategy: Retests are critical for confirmation. A pullback to ~$33.40 with rejection signals (e.g., bullish engulfing, pin bar) would strengthen the case for further upside.
🧠 Mindset & Strategy Explanation
This setup represents patience, structure, and discipline in trading:
✅ Wait for the Pattern : Rectangle patterns often trap impatient traders. Waiting for a confirmed breakout and retest gives higher-quality entries.
✅ Risk Management is Key : Use the structure of the rectangle to define risk. Stops should be set just below the last swing low or inside the range.
✅ Targeting with Precision: TP1 and TP2 are not random — they’re derived from prior resistance levels and pattern projections. This keeps your trading logical, not emotional.
✅ Mind Over Market: Don’t chase breakouts. Wait for confirmation. The retest is often your friend in swing trading setups like this.
📋 Trade Idea (Not Financial Advice)
📍 Entry: On confirmed breakout above $33.40 or retest of this level with bullish confirmation.
🎯 Target 1: $34.58 (partial take profit suggested)
🎯 Target 2: $35.22 (measured move projection)
🛑 Stop Loss: Below $32.70 (under recent support structure)
🔁 Optional: Trail stop loss after TP1 to lock in profits as TP2 approaches.
🧠 Final Thoughts for Traders
This chart provides a clean example of how price consolidates before expansion. The rectangle pattern allows for easy identification of entry/exit zones and offers a solid risk-to-reward setup. Whether you're a new trader learning to spot consolidation patterns or a seasoned pro looking for low-risk, high-reward setups — this XAGUSD formation is one to watch.
Keep an eye on volume and candle structure around the breakout zone. Confirmation is key. Discipline is everything.
BTCUSD Rectangle Pattern Breakout + Bearish Retest & Target🧩 Chart Overview
This chart captures a well-defined rectangle continuation pattern forming within a rising channel on the 1-hour timeframe. This setup is a classic combination of horizontal and diagonal price structure interaction, offering valuable insights into potential market behavior and trade opportunities.
🧱 Structure Breakdown
Rectangle Pattern: Price action was trapped in a sideways consolidation phase between the resistance zone (~104,800 - 105,400) and the support zone (~101,200 - 101,800).
This rectangle followed a strong bullish rally, which often implies a continuation pattern. However, the lack of follow-through from bulls near the resistance led to repeated failures to break out, suggesting weakening momentum.
Rising Channel: Within this rectangle, price respected a rising trendline support and resistance structure, forming a parallel ascending channel.
Bearish Breakout: The significant event occurred when BTC broke down below both the horizontal support of the rectangle and the lower boundary of the rising channel, triggering a structural shift from bullish to bearish.
🔁 Retesting Phase – What’s Happening Now
After the breakdown:
Price pulled back toward the prior support zone, which is now acting as resistance (a classic example of the support-turns-resistance principle).
This is commonly referred to as a retest, which validates the breakout and offers a lower-risk entry point for traders looking to short.
The retest area (around 101,500 - 102,000) is crucial. If price fails to reclaim this level and prints bearish confirmation (e.g., rejection wick, bearish engulfing candle), it increases the probability of downward continuation.
🎯 Trade Setup (Short Bias)
Entry Zone: 101,500 – 102,000 (on retest rejection confirmation)
Stop Loss: Above 103,000 (above prior highs and invalidation point)
Target 1 (TP1): 99,347 – key psychological and horizontal support level from prior structure
Target 2 (TP2): 97,277 – measured move of the rectangle height projected downward, aligning with previous demand area
This setup offers an attractive risk-to-reward ratio, assuming proper trade management and confirmation-based entry.
📊 Additional Technical Confluences
Bearish Momentum: The aggressive breakdown candle shows strong seller interest and increased volatility.
Volume: If confirmed with high selling volume during the breakdown and low buying volume during the retest, the move gains more credibility.
Trend Reversal Signals: The break of the channel and the rectangle support indicates potential trend reversal from short-term bullish to bearish.
RSI & Momentum Indicators (optional): Traders may use tools like RSI or MACD to confirm momentum shifts during retest.
📉 Psychological and Price-Level Significance
101,500 was a strong intraday support zone throughout the consolidation phase. Once broken, it flips polarity and acts as resistance.
The round-number level of 100,000 is always a psychological magnet for BTC. It often acts as a bounce or breakout zone, so traders should watch price behavior near this area closely.
Deeper demand may emerge around 97,000 – 96,500, which can serve as an extended target or reaccumulation zone depending on broader market conditions.
⚠️ Risk Management & Final Thoughts
This setup is high-probability only if the retest confirms rejection. Avoid early entries or assumptions before confirmation.
Always use proper stop-loss placement to avoid whipsaws or fake-outs.
Manage position sizing based on account size and risk tolerance.
News events or macro data can override technicals, so be aware of upcoming economic releases or sentiment shifts.
🧵 Conclusion
Bitcoin is showing clear signs of short-term weakness following the breakdown of a long-standing consolidation range within a rising channel. The ongoing retest provides an ideal area for short positioning, with clearly defined invalidation and profit targets.
✅ If bears defend the retest zone, expect downside continuation toward 99.3K and possibly 97.2K.

Let the Resistance Cross & Sustain!Bullish Divergence on Weekly as well as Monthly TF.
Hidden Bullish Divergence on Daily TF.
Immediate Resistance is around 8.20 - 8.30
Important Resistance Zone 9.80 - 10.90
Crossing & Sustaining will expose 13 - 13.50 initially.

Watch for a breakout from the #BANKUSDT📍 The price of MEXC:BANKUSDT.P is approaching the apex of the pattern — a breakout from consolidation is expected soon. The main scenario favors a downward breakout, with a short opportunity if confirmed.
📍 Important note: ➡️ Don’t rush the entry! Wait for a clear breakout from the pennant and confirmation of the direction.
📍 Beware of fakeouts — the key to success lies in confirmation with candle closes and volume.
📉 SHORT MEXC:BANKUSDT.P from $0.04118
🛡 Stop loss: $0.04284
🕒 Timeframe: 1H
📢 Overview:
➡️ The main structure of MEXC:BANKUSDT.P remains bearish, showing consolidation after a drop.
➡️ A break below the $0.04118 support will trigger the Bearish Pennant pattern.
➡️ Volume increase on the breakout will confirm sellers' dominance.
🎯 TP Targets for SHORT:
💎 TP 1: $0.04010
💎 TP 2: $0.03900
💎 TP 3: $0.03815
📢 Entry conditions for MEXC:BANKUSDT.P :
Enter only after a clear breakdown and candle close below $0.04118, ideally with volume confirmation.
📢 If the price holds above $0.04588, the structure may be invalidated, and the short scenario should be reconsidered.
📈 LONG MEXC:BANKUSDT.P from $0.04652
🛡 Stop loss: $0.04501
🕒 Timeframe: 1H
📢 Overview:
➡️ Price is compressing inside a Bearish Pennant, but there is still potential for a fake breakout upward.
➡️ A breakout above the pennant on strong volume may lead to a bullish impulse.
➡️ The $0.04652 level is key for a long entry after confirmation.
🎯 TP Targets for LONG:
💎 TP 1: $0.04760
💎 TP 2: $0.04870
💎 TP 3: $0.04970
📢 Entry conditions:
Enter only after a confident breakout above $0.04652 and a solid candle close (preferably with high volume).
🚀 Watch for a breakout from the MEXC:BANKUSDT.P structure and trade only in the confirmed direction. Either way — there is good movement potential and the R/R ratio is solid in both directions!

Bearish Divergence on Weekly TF.Bearish Divergence on Weekly TF.
Resistance lies around 225 - 235
Currently moving in a Rectangular Channel.
Crossing 222 - 223 will trigger more positivity
towards 235 - 240 initially and then around 250-260.

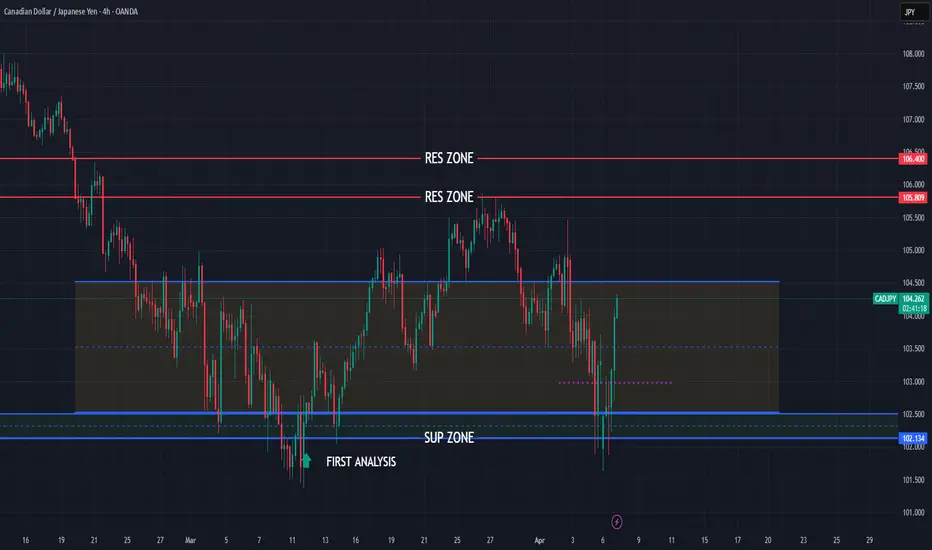
CADJPY still bullish expecting
OANDA:CADJPY first analysis highly accurate it's attached.
In first analysis i am share bullish view, having op we are not see some special big bullish move and based on PRICE ACTION analysis expecting here new bullish push.
SUP zone: 102.500
RES zone: 105.800, 106.400
Bitcoin (BTC/USD) 4H Chart Analysis – Professional BreakdownBitcoin (BTC/USD) 4H Chart – Detailed Professional Analysis
This chart presents a Rectangle Pattern, a common consolidation structure in technical analysis. The price has been oscillating between a well-defined resistance level near $88,000 - $89,000 and a support level around $80,000 - $81,000. This pattern suggests an upcoming breakout, with bearish continuation being the most probable scenario.
Understanding the Rectangle Pattern
A rectangle pattern forms when price moves sideways, trapped between two horizontal levels. Traders watch for a breakout in either direction to determine the next trend. In this case, Bitcoin has tested the resistance multiple times but failed to break above, indicating strong selling pressure. Meanwhile, support has been retested several times, which weakens its strength over time.
A bearish breakdown is likely because:
Buyers appear unable to push past resistance, showing exhaustion.
Support has been tested multiple times, which increases the chance of a breakdown.
The dotted black trendline is now being tested, and a break below it would further confirm bearish momentum.
Trade Setup for a Breakdown
A short trade becomes valid only if Bitcoin breaks below the $81,000 - $82,000 support zone with strong momentum. The price must close below this level to confirm the move.
How to Enter the Trade?
Look for a strong bearish candle close below the $81,000 - $82,000 range.
If Bitcoin retests this broken support (now acting as resistance), this can be a secondary short entry point.
Once confirmation is seen, open a short position.
Stop Loss Placement
To protect against false breakouts, a stop loss should be set above the $88,457 resistance zone. If the price moves back into the rectangle and surpasses this level, it means the bearish setup is no longer valid.
Profit Target and Trade Expectation
The expected take profit target is $73,541. This is calculated using the measured move projection, meaning the height of the rectangle is subtracted from the breakdown point. If Bitcoin reaches this level, the trade will have successfully captured the bearish momentum.
Market Psychology Behind This Move
The repeated failure to break above resistance ($88,000 - $89,000) signals weak buying interest. Buyers have been stepping in at support, but each retest of the $80,000 - $81,000 zone makes it more vulnerable.
Once support finally breaks, several factors will accelerate the move:
Long positions will be forced to sell, increasing selling pressure.
Breakout traders will enter new short positions, pushing price further down.
Liquidity below support will be triggered, causing Bitcoin to fall sharply toward the $73,541 target.
Invalidation Scenario (Bullish Case)
If Bitcoin breaks above $88,000 - $89,000 and holds, the bearish setup becomes invalid. In that case:
The price would shift into a bullish continuation pattern.
Traders should avoid shorting and instead look for buying opportunities above resistance.
Final Thoughts
This is a high-probability bearish setup, but patience is key—wait for confirmation before entering.
Risk management is crucial : The stop loss at $88,457 ensures that losses are minimized if the market moves against the trade.
If Bitcoin remains inside the rectangle, traders can buy at support and sell at resistance until a breakout occurs.

Bitcoin (BTC/USD) Rectangle Pattern Breakdown – Bearish Move1. Overview of the Chart & Market Context
The chart provided represents Bitcoin (BTC/USD) on the 1-hour timeframe, published on TradingView. This analysis highlights the rectangle pattern formation, key support and resistance levels, and a potential short trade setup with defined risk management.
The market structure suggests a bearish outlook, as Bitcoin attempted to break above a resistance level but failed, leading to a sharp decline. The price action now indicates further downside movement, aligning with a rectangle pattern breakdown.
2. Rectangle Pattern Formation
What is a Rectangle Pattern?
A rectangle pattern is a consolidation phase where price moves sideways within a defined range, forming multiple touches at resistance and support before a breakout occurs. It can serve as a continuation or reversal pattern, depending on the breakout direction.
In this case, the pattern has resulted in a bearish breakout, indicating that sellers have taken control of the market.
Key Characteristics of This Rectangle Pattern:
The upper boundary (resistance) is at 88,333 USD, where price repeatedly failed to break higher.
The lower boundary (support) is at 78,044 USD, which acted as a strong floor but is now under pressure.
The price moved within this range for an extended period, showing a balanced battle between buyers and sellers.
A failed breakout at resistance, followed by a sharp rejection, signals a bearish reversal.
3. Breakdown of Key Levels & Market Structure
A. Resistance Level – 88,333 USD
This level has been tested multiple times, but price failed to hold above it.
The recent failed breakout led to a strong bearish rejection, confirming resistance.
The price action formed a bearish engulfing candlestick, adding to the bearish bias.
B. Support Level – 78,044 USD
This zone has previously provided multiple bounces, showing strong buying interest.
However, with the recent break below this level, it may now act as resistance.
If the price retests this area and fails to break above, it confirms a bearish continuation.
C. Price Rejection and Market Structure Shift
The formation of lower highs and lower lows signals a transition from consolidation to a downtrend.
The price broke out of the rectangle pattern to the downside, confirming a bearish breakout.
If the support at 78,044 USD fails, the price may continue dropping toward 73,678 USD.
4. Trade Setup & Execution Plan
🔹 Entry Strategy
A short position is initiated after the bearish rejection at resistance (88,333 USD).
The breakdown of the rectangle pattern strengthens the short setup.
The price may briefly retest the broken support (78,044 USD) before continuing downward.
🔹 Stop-Loss Placement
The stop-loss (SL) is placed above 88,333 USD, ensuring that if price moves against the trade, risk is minimized.
This protects against any unexpected bullish reversal.
🔹 Profit Targets (Take Profit - TP)
TP1: 78,044 USD (previous support level) – A conservative target.
TP2: 73,678 USD (deeper support) – If bearish momentum continues, this is the extended target.
Trade Component Details
Entry Short after rejection at 88,333 USD
Stop-Loss (SL) Above 88,333 USD
Take Profit 1 (TP1) 78,044 USD
Take Profit 2 (TP2) 73,678 USD
Confirmation Breakout & retest of support
Risk-Reward Ratio Favorable (defined SL & TP)
5. Expected Price Action and Market Behavior
🔻 Bearish Scenario (Most Likely Outcome)
The price will continue to fall towards TP1 (78,044 USD) due to selling pressure.
If 78,044 USD fails to hold, Bitcoin is likely to test the next major support level (73,678 USD).
The structure of lower highs and lower lows supports the downtrend.
🔺 Bullish Scenario (Invalidation of the Short Setup)
If Bitcoin breaks above 88,333 USD, the bearish outlook is invalidated.
This could signal a potential trend reversal or bullish breakout.
6. Technical Indicators Supporting the Analysis
Several technical indicators can be used to confirm the bearish outlook:
📉 RSI (Relative Strength Index):
If RSI is below 50, it confirms bearish momentum.
If RSI is oversold (<30), a temporary bounce may occur.
📉 Moving Averages:
If the 50-period MA crosses below the 200-period MA, it confirms a bearish trend.
If price is below both MAs, it strengthens the bearish setup.
📉 Volume Analysis:
A high selling volume during the breakdown indicates strong bearish conviction.
If volume spikes near support levels, a potential bounce could happen.
7. Summary of Key Findings
Pattern Identified: Rectangle pattern with a bearish breakout.
Market Structure: Price formed lower highs and lower lows, signaling a downtrend.
Trade Setup:
Short trade after rejection at 88,333 USD.
Stop-loss above 88,333 USD to manage risk.
Profit targets at 78,044 USD (TP1) and 73,678 USD (TP2).
Risk Management:
Clear stop-loss and take-profit levels ensure a controlled risk-to-reward ratio.
If price moves against the trade, the stop-loss prevents excessive losses.
Technical Indicators:
RSI, Moving Averages, and Volume Analysis confirm the bearish outlook.
8. Final Thoughts & Trading Plan Implementation
This analysis presents a high-probability bearish trade setup using the rectangle pattern breakdown strategy. With proper risk management, traders can execute this short trade with a structured plan.
🔹 Actionable Trading Plan:
Wait for price confirmation – If BTC retests the broken support (78,044 USD) and rejects, this strengthens the trade idea.
Execute the short trade – Once confirmation occurs, enter a short position.
Manage risk appropriately – Stick to the stop-loss above 88,333 USD.
Monitor price action – Adjust take-profit levels based on momentum and support breaks.
If the price invalidates the setup by breaking above resistance, it is crucial to exit the trade and re-evaluate the market conditions.
Conclusion:
This Bitcoin (BTC/USD) rectangle pattern breakdown analysis provides a clear bearish trade setup, supported by market structure, technical indicators, and price action. The well-defined entry, stop-loss, and take-profit levels ensure a structured risk-reward ratio, making this a viable short trade opportunity.

BTC/USD Bullish Breakout from Rectangle PatternOverview:
The chart represents Bitcoin's price action against the US Dollar on the 1-hour timeframe, highlighting a Rectangle Pattern Breakout with a well-structured trade setup. This analysis will break down the pattern, key levels, and possible trading scenarios.
1️⃣ Chart Pattern Breakdown – Rectangle Consolidation
The price has been moving within a rectangle pattern (range-bound movement), where Bitcoin found support at lower levels and faced resistance at the upper boundary.
Rectangle Pattern: A continuation/consolidation pattern where price fluctuates between horizontal resistance and support before breaking out.
Curve Formation: The price action within the rectangle also forms a rounding bottom, indicating a potential shift from bearish to bullish sentiment.
Breakout Confirmation: BTC has broken out from the rectangle, suggesting bullish momentum.
2️⃣ Key Technical Levels
🔹 Support Level ($84,110)
This zone has acted as a strong demand area, preventing the price from falling further.
Buyers consistently stepped in at this level, making it a significant psychological floor for Bitcoin.
🔹 Resistance Level ($86,850 - $87,000 Zone)
This level had previously rejected upward movements, leading to multiple price pullbacks.
After the breakout, this area is expected to act as a new support level upon a retest.
🔹 Target Price ($89,931 – Next Resistance Zone)
If the breakout sustains, the next key target for bulls is around $89,931, based on prior resistance zones and technical projections.
🔹 Stop Loss ($84,110 – Below Support Zone)
A stop loss below the support zone ensures risk management in case of a false breakout.
3️⃣ Trading Strategy & Execution
📌 Entry Point – After price confirms the breakout above the rectangle’s resistance. Traders should wait for:
A pullback and retest of the broken resistance, which should now act as support.
A strong bullish candle confirming continuation.
📌 Take Profit (TP) – $89,931, based on historical resistance levels and price projection from the rectangle range.
📌 Stop Loss (SL) – Placed at $84,110, below the rectangle’s previous support zone to minimize downside risk.
📌 Risk-to-Reward Ratio (RRR) – The setup offers a favorable RRR, meaning potential profits outweigh the risks.
4️⃣ Market Sentiment & Additional Factors
✔ Bullish Outlook – The breakout signals strong buying interest and potential upside continuation.
✔ Volume Confirmation – Traders should monitor volume spikes during the breakout to confirm institutional participation.
✔ Economic Events & News – External factors like macroeconomic data or Bitcoin-related news can impact price action.
Conclusion – BTC/USD Trading Setup
Pattern Identified: Rectangle Pattern Breakout
Current Trend: Bullish breakout from consolidation
Trade Type: Long position (Buy setup)
Key Levels:
✅ Support: $84,110
✅ Resistance: $86,850 - $87,000
✅ Target: $89,931
✅ Stop Loss: $84,110
🔥 Final Thought : Bitcoin has broken out of a key consolidation range, signaling a bullish move towards $89,931. Traders should wait for confirmation and manage risk accordingly! 🚀📈

Bitcoin (BTC/USD) Trading Analysis – Rectangle Pattern Breakdown1. Market Overview
The BTC/USD chart (1-hour timeframe) illustrates a trendline-supported uptrend that eventually transitioned into a rectangle consolidation pattern before breaking downward. The market displayed signs of buyer exhaustion near the resistance level, leading to a rectangle pattern breakdown, confirming a bearish shift.
This analysis will break down the chart structure, key technical levels, potential trade setups, and risk management strategies for traders looking to capitalize on this move.
2. Breakdown of the Chart Structure
A. Trendline Breakout & Shift in Market Sentiment
The chart initially exhibits an ascending trendline, acting as dynamic support for Bitcoin’s price.
As long as BTC/USD remained above this trendline, the uptrend was intact.
However, once the price broke below the trendline with strong bearish momentum, it signaled a significant shift in sentiment from bullish to bearish.
The breakdown of the trendline also coincided with the rectangle’s lower boundary breakdown, confirming bearish strength.
B. Rectangle Pattern Formation (Consolidation Phase)
The price oscillated between resistance at $88,500 and support at $86,000, forming a rectangle consolidation pattern.
This pattern reflects a period of market indecision where buyers and sellers are in equilibrium.
Multiple failed breakout attempts at resistance signaled strong seller dominance, leading to eventual support failure.
The rectangle breakdown suggests that bears have gained control and a downward move is likely.
C. Breakdown Confirmation & Target Projection
The price broke below the lower support of the rectangle ($86,000) with increased selling pressure.
The bearish breakout was confirmed by strong red candles with high volume, reinforcing the downside move.
The height of the rectangle pattern provides a measured move target of around $83,797, aligning with previous support.
The momentum remains bearish, and price is likely to test this level before any reversal attempt.
3. Trade Setup & Risk Management
A. Ideal Trade Entry
Entry Point: After the price retested the broken rectangle support at $86,000, which now acts as resistance.
Confirmation: The rejection from this resistance with a bearish engulfing candle confirmed further downside.
Bearish momentum indicators, such as RSI and MACD crossovers, further validated the setup.
B. Stop-Loss Placement (Risk Management Strategy)
Stop Loss: Placed above the previous resistance zone at $88,969 to protect against false breakouts.
Rationale: If price moves back into the rectangle and surpasses resistance, the bearish setup becomes invalid.
C. Take-Profit Target & Risk-to-Reward Ratio
Target: $83,797, based on the rectangle pattern height projection and key support levels.
Risk-to-Reward Ratio: The setup offers a favorable risk-to-reward ratio, ensuring that potential gains outweigh potential losses.
4. Market Sentiment & Future Outlook
A. Bearish Continuation Outlook
The trendline failure, rectangle breakdown, and bearish candlestick patterns all suggest a continuation of the downtrend.
If price fails to reclaim support-turned-resistance ($86,000), further downside is expected.
Increased selling volume confirms bearish control.
B. Possible Bullish Reversal Scenarios
If BTC/USD bounces strongly from the $83,797 target zone, it could indicate buyer accumulation and lead to a bullish recovery.
A move back above $86,000 would invalidate the bearish outlook.
5. Conclusion
This BTC/USD analysis highlights a bearish rectangle pattern breakdown, reinforced by a trendline break and strong resistance rejections at $88,500. The breakout target is $83,797, where traders should monitor price action for further bearish continuation or potential reversal signs.
Traders should approach with caution, set appropriate stop-loss levels, and follow volume trends for confirmation of further price movements.

Will AUDJPY continue bearish trend? [Short Setup]Bearish rectangle is form on 1HR chart and there is no divergences. It's likely to continue bearish trend.
🔹When to Enter?
Enter in the trade when it retest it pervious day low which is 193.157. And target it to swing low, keep SL above pervious day low.
🔹 How to Take Trade?
- Only risk 1% of your portfolio
Like and subscribe to never miss a new idea! ✌🏼

BNB up trendBinance coin already braked out of the long time rectangle classic pattern, it is expected to to continue up trend to the targets which are mentioned in the charts.

AXSUSDT Rectangle PatternAXSUSDT Breaks Out of Rectangle PatternAXSUSDT Technical Analysis update
AXSUSDT has formed a rectangle pattern at the bottom near its major yearly support level. The price has broken the rectangle pattern resistance on the daily chart, indicating a potential bullish move from the current level. The price is trading above the 100 and 200 EMAs on the daily chart, with a noticeable rise in volume in recent candles is also considered strongly bullish.

UNITDSPR Breakout, Long for IntradayUNITDSPR Breakout closing in 15 Min. chart, Rectangle/Flag & Pole pattern breakout.
Daily Trend is also upwards
Wait for the retracement then can go for long position.
Question : Why wait for retracement?
Ans : Already made 8 green candles, there is a high probability that a red candle can be formed only then we can see the intensity and exact seller price.
If sellers are strong then it can be a breakout fail or if buyers are strong then that red candle will be act like a small stoploss/better price place for Buyers.
Note: This is just an analysis wait for the price to confirm.
Disclaimer :
Always follow Risk to Reward, because this is the key to success in this business, no matter how much good a trade is looking, we never know the future.

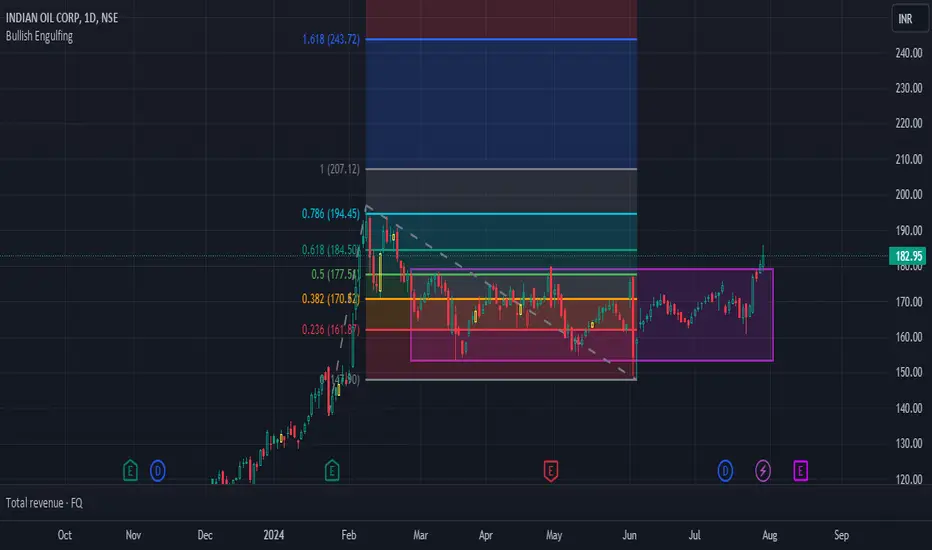
IOC BreakoutIOC NSE:IOC looking for a breakout after Consolidation. Buy above 184 and 1st target would be 207. The Next Target would be 240, however this can be achieved using GTT if you are ready to take Risk!
Reliance Industries: Could be great momentum trade!!Reliance recently raised its mobile tariff. So the stock is in news.
Stock was trading in a range (rectangle pattern, darvas box, accumulation stage.
After the announcement of the tariff hike by the company, its stock price broke out from the range.
This breakout could be the continuation of the uptrend of the stock, and in coming days we have see further rise in the stock price of reliance.
Pattern gets invalidated if it breaks down from the range.

PREMEXPLNGood Volume Buildup.
Rectangular Pattern.
Good for Short term and Long term.
Do Like ,Comment , Follow for regular Updates...
Disclaimer : This is not a Buy or Sell recommendation. I am not SEBI Registered. Please consult your financial advisor before making any investments . This is for Educational purpose only.

Legal & General new directionAfter creating a rectangle since Jan 2024, Legal and General has broken to the downside after lacklustre targets issued yesterday. Price is falling below 231 support.
Since March 2013, L&G has gone nowhere and it looks like it could eventually hit 161, if the stock market reverts to a downtrend or business is below expectations.
