Reddit’s Moons Breakout Soon!!!Hello guys,
Reddit Moons are in this downtrend and as you can see it respected the support resistance lines, Moons can be bought on MoonsSwap.
Moons MarketCap is about 3 Million $ which is literally nothing for a crypto community of 3 Million members .
I expect the Mainnet to come at EOY or early 2022, predicted market cap is about 600 Million to 3 Billion $ which is 100-500x !!!
DYOR.

BITCOIN ALERTHead and shoulders formed on bitcoin. With all the news and sceptics I see a bearish movement to $4000 for bitcoin before the next halving.

Express break out #BullishExpress has just broken out on friday June 25th, to an intraday high of 8.98 and a session close at 7.10 and an after-market close at 7.22. With this massive spike in volume, a mother candle, the nike break out, and all indicators pointing to more growth; I am fairly confident this retail stock play will run next monday. I have attached support and resistance lines, as well as a fibonacci retracement.
Thanks,
Benjamin

There is a beautiful event coming soonAs you can see now we have a symmetrical triangle that is breaking a huge flag inside a huge falling wedge. 10% in the near time, and 40% at the end

CLOV - let's squeezeGolden cross soon with a potential price target to 17 in short term and then more up.
indicators points upwards.
Apes are we ready? Let's squeeze the soul of the shorters.

$AMC Flag Breakout on Daily With High Acmltn PT $300+ Month TFAMC Entertainment Holdings ($AMC) Has been making incredible strides these last few weeks. The company has incredible cash on hand and is in the process of a shareholder vote that began on June 16th and set to be held until July 28th.
Shareholders will have the option of voting yes or no on an issuance of 25 Million shares for improving the company financials and expanding its business.
As an Ape I will be voting yes as I want to help the company grow and I see this as a long term investment at this point with the amount of cash on hand the company currently has. I do believe the 25 million shares (If they even sell them and which can't be sold until January of 2022) will be a good fall back on if needed.
On the technical side the chart is showing a massive bullish flag formation on the daily which could see a breakout today or Monday. I do believe the share price will more than likely appreciate and break the pivotal $100 mark, after which point the sky is the limit as far as how high this could go. Hedge funds (The good ones not the short ones) Could be looking to buy up millions of shares in order to make a decent profit not to mention billionaires who are interested and vested in helping to squeeze shorts.
The short % on the stock is still relatively decent and I do believe a squeeze will send it sky high. Right now they are battling to keep it under $65 but the stock continues to creep upwards to breaking that level.
I think we have a good chance of seeing the $100 break early next week.
Overall Personal Price target is around $300+

BLACK BERRY - BUY - SILVER BACKS - Incoming ^Well as many have seen lately these reddit stocks such as GME, AMC continue to surprise institutional investors
Reddit traders and people all round the world seem to have discovered a loop hole in the financial system
if it makes money, I'm in too seen the performance of these WSB stocks short squeezes and was amazed the moment it began to rise
BB
Expect to see many other reddit stocks behave unfamiliar, I'm buying into ( blackberry ) very soon you will see.
Black Berry continues to make enterprise grade mobile devices much like the infamous bb curve from May 3, 2007
BlackBerry provides enterprises and governments with the software and services they need to secure the Internet of Things.
BlackBerry has transformed itself from a smartphone company into a security software and services company.
NYSE:BB
TSX:BB
CAPITALCOM:BB
BCBA:BB
FTX:BBUSD
SWB:RI1
SIX:BB
FWB:RI1
BITTREX:BBBTC
FTX:BB0625
SWB:RI1
NYSE:AMC
CAPITALCOM:AMC
BMV:AMC
NYSE:GME
CAPITALCOM:GME
BMV:GME
FWB:GS2C
FTX:GMEUSD


Is AAPL Benefiting From The Reddit Rally?AAPL shares are starting to get thrown in the mix with Reddit's memestocks trend right now. I don't think it's a bad thing to be honest and longs (including myself) aren't opposed to the positive momentum in the market. The stock itself has held a great trend and now continues consolidating on the daily chart with the 236 fib acting as a support level. Maybe the meme momo helps get the stock outta this consoldtain trend and finally start making new highs again.
"Believe it or not, one of the increasingly popular meme stocks right now on Reddit is Apple (AAPL). One might say this is one of the OG memers over the last few decades. Known for its disruptions in tech, Apple's products are used by millions of people"
Original Quote Source: Looking For More Meme Stocks? Here Are 6 Gaining Popularity Right Now

$GME - Next FTD Reset or Bleed DatesHi ya'll,
By now i hope you all know what an FTD is and what an FTD Reset is and what the general cycle of these is. If not, that's too bad.
Anyway here's some dates on which i personally expect GME FTDs to be reset or to be let to bleed out as price increases.
Here's one of my few DD's explaining how i come to the conclusion for these dates amongst other things. I'd love to post these here but the format won't really paste well, so here's the link...
www.reddit.com


Ashford Hospitality Trust $AHT - Peak EUPHORIA - #PonziPog STONKReddit pumped #houseofcards. CEO immediately signs up for Twitter to pump the NEW "investor gang". LMAO. #theTell
#EpicEconomics

#reddit #stocks #meme #CLF# Seven year old resistance breached!!In this video, the discussion is about the #CLF (#Cleveland-Cliffs Inc), Price Action analysis, resistance, support, stop loss, risk to reward ratio.
Note: The discussion on the video is not financial advice and is purely for training and educational purpose.

Wendy - Burgers got reddit's recipe 💪-Nothing changed overnight’ to make Wendy’s a better bet, trader says as stock sees Reddit interest
-Shares of the fast-food chain surged about 26% to records on Tuesday after a post in Reddit’s popular WallStreetBets forum pitched Wendy’s as “the perfect stock” for the group on account of its signature products and “effective” social media presence.
-It’s the latest so-called meme stock that has captured the group’s interest. The growing list includes GameStop, AMC and Bed Bath & Beyond.
-“I think the reason the Reddit crowd is pushing it up today is because the retail share float is pretty small in Wendy’s, but I can guarantee you nothing changed overnight to change the fundamental story,” Gradient Investments President Michael Binger told CNBC’s “Trading Nation” on Tuesday.
-Though the company has a “decent business model” and can take advantage of the economic reopening, its stock is trading at a notably high price-earnings multiple for just 3% sales growth, he said.

#reddit #stocks #meme #CLNE #Clean Energy Fuels CorpIn this video, the discussion is about the #CLNE (#cleanenergyfulescorp), Price Action analysis, resistance, and support.
Note: The discussion on the video is not financial advice and is purely for training and educational purpose.

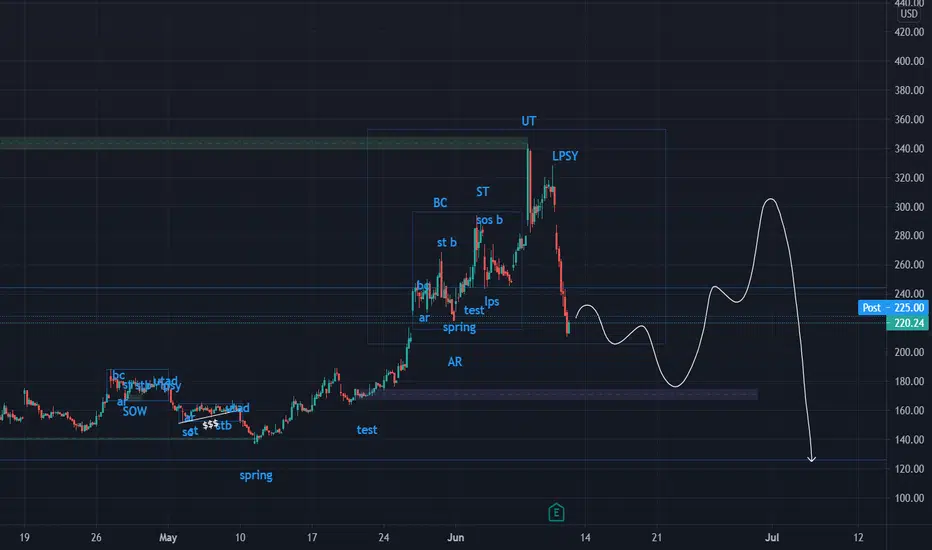
GME 3 possible Algo KeyCodes MatchI made a key code of the price action then found an exact match to this move in the past.... one that matched at lease 95% or better. That way if the move is that close to the same shape we have now it must mean the sentiment of the market was the same at that time. Therefore, the outcome should be the same coming out of the move. I then used PTP which is Past Trend Prediction by tracing the trend it made after this move in the past and projecting it forward on to the current move.
Then I took the same move on the Daily which is a different Time frame then the first..and found the same move with out a key and traced its path and projected it forward as well.
Sometimes I use about 5 other Price Action tricks I have have developed over the last 10 months or chart out the Curve and what Stage it is in. The Curve is my own brain child and I compare that to Wycoff method. Taking all of these into account You have several different approaches to confirming direction and intent of the institutional buyers and where Retail resides during this move.
If you would like to have more information or videos on Any of the ways I chart pls comment below. Like, follow, Subscribe...share.
Thank you,
iCantw84it
06.07.2021


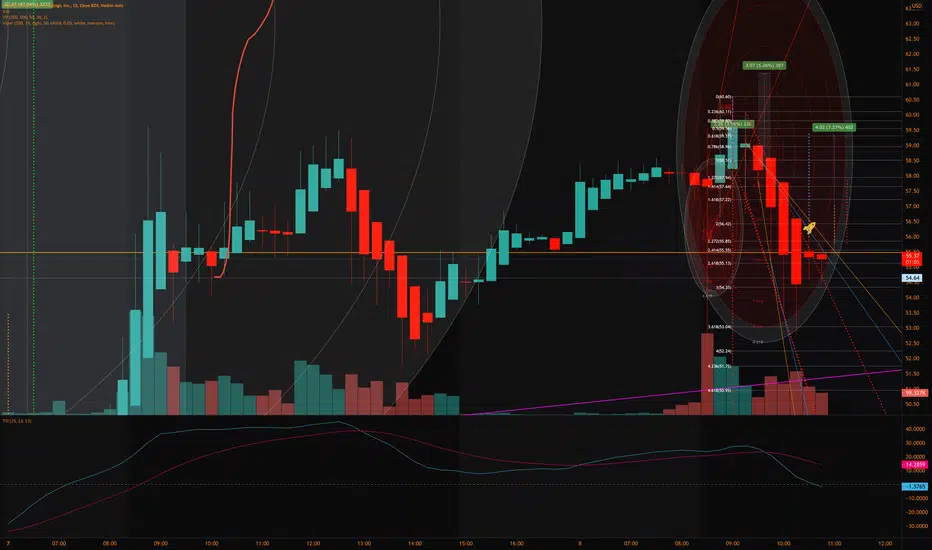
Trading Idea - #AMC (back to sh**)SHORT! What goes up, must come down! :-)
Entry: 54.35 USD
Target: 34.00 USD (% profit)
Stop: 62.79 USD

STREAM AT 6:30 PM EST!JOIN MY STREAM AT 6:30 PM EST! ALL QUESTIONS AND COMMENTS POSTED IN THE CHAT WILL BE ANSWERED!

$GME - Is it go time? (Not a DD post)Hey all,
Not a DD post as i think the rocket is on it's way up already, so what's the point right?
I think we're in fact trading on Max Pain even though many people (including myself previously) are now convinced that we're not. I've collected my own Option Flow data and compiled it and realized that the max pain for the OI of the past 2 days is $290. For the price to drop significantly today there must have been new excessive call/put buys or actually contracts being closed due to the new OCC-003 coming to effect today which increases market makers collateral requirements for options. This would mean it would be much harder for them to keep kicking the can down the road using deep ITM puts and married puts.
I speculated that there would be a sort of flash crash when wer'e near $300 on one of my reddit posts 1 day before the actual mini flash crash from $292 down to $260 happened. This assumption was based on the HUGELY uncommon amount of ITM puts at $300 purchased on the 23'rd of May for $61 million premium dated to expire in 2022 and 2023 January (lmao). My assumption was that somehow exercising these would flash crash GME, but i think that's completely wrong, i think what actually happened was that they dumped/closed those contracts yesterday with something like 95% loss which caused the other side of the trade (algo) to dump the shares it was hedged with and this was likely the reason behind the drop from $292 to $250 ish yesterday.
Today 3'rd of June i assume the reason why we're a bit down is that because more contracts are being dumped due to OCC-003 coming into effect today EOD. If they don't dump them, it'll mean insta-margin call tomorrow, so they have to dump them or at least that's the assumption i'm making. By dumping those contracts they're severly affecting the Max Pain point between call / put open interest for GME which is likely the reason why we're moving so erratically.
Jefferies has also restricted short sales on GME today which is quite funny because of it's timing with OCC-003's arrival today. It says a lot.
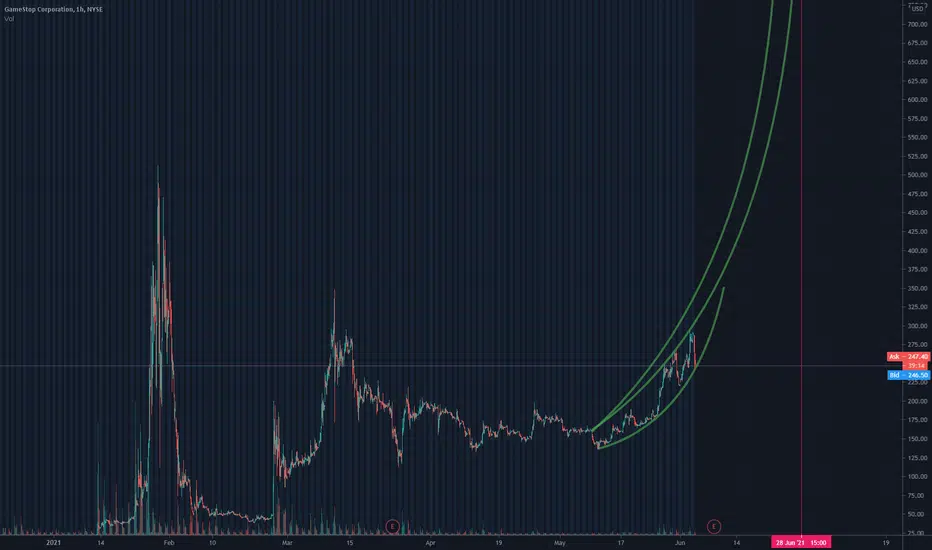
I think the rocket is off and is only a few meters/feet off the ground right now. If these levels at $240-$250 hold and we bounce off upwards from here then that's fantastic news because the GME chart is likely to be fully vertical by the end of June as the price is moving up logarithmically right now and that's bloody insane. ~$250 is the bottom of this logarithmic/exponential curve.
Let's see what happens, strap up, lay back and relax and prepare yourself for a generational wealth transfer.
I'll be doing a DD write-up later on as i have too many theories on how they've been able to game the system for this long and how it's coming to an end for them due to the recently introduced new regulations under the SEC, FICC, DTC, OCC, NSCC etc. I've contacted the SEC in regards to the deletion of regulation SR-DTC-2021-005 and requested a FOIA update on it. This should get the wheels turning and questions asked on who deleted this 1 regulation that literally kills share rehypothecation.