BTC updateBTC regardless of what has been said in news etc. has no power to push price higher.
Every attempt to go higher meets strong bearish candle.
BTC is still trading in channel. In my opinion the BTC will try to breach 30k again in near future. It might be short lived but whatever will happen it should established some more reliable support .
This chart for time being look like perfect example from the book, fully harmonic without any sudden spikes out of proportions
Rejection

Trade - short EURNZD low probability Trade - short EURNZD low probability - keep watching price action, if price tells that is going to keep pushing up, then i will be exiting way sooner.
be careful out there.

Silver Perfect signal for short Very simple setup for 2.6:1 Reward/Ratio. Let me point out the most important signals here and we have quite few on current chart:
• 200 Emma stopped further gains against dollar
• Followed by long bearish candle accompany with shooting star
• 50% of retracement after mayor drop.
The TP area is within the channel in which silver is traded for the last year.

GBPCAD - Trend Following Sell Setup Forming!Hello everyone, if you like the idea, do not forget to support with a like and follow.
GBPCAD is overall bearish trading inside the H4 blue channel, and since it is currently approaching the upper blue trendline, we will be looking for sell setups on lower timeframes.
on M30: GBPCAD is forming a trendline in red but it is not valid yet, so we will be waiting for a third swing to form around it. (projection in purple)
Trigger => Waiting for that swing to form then sell after a momentum candle close below it. (gray area)
Until the sell is activated, GBPCAD would be overall bullish and can still trade higher.
Good luck!
All Strategies Are Good; If Managed Properly!
~Rich

200 MA acts as Support?Hello again, Traders!
This is my second post on this website. Last week was a success which is a big motivation for me in my trading journey. This time I used the 200 MA to analyze USD/CAD on the 4h time frame. It acted as a support before and might be rejected another time, which could be an indicator for a bullish movement. In this case I'll wait for confirmation to make sure I buy at the right time. Also the 1h time frame shows an uptrend which might continue after the confirmation.
I'd be happy for any feedback.
Thanks in advance.

BITCOIN - My Trading Plan in a video!Hello everyone, if you like the idea, do not forget to support with a like and follow.
Here is the top-down analysis for BTC, feel free to request any pair/instrument or ask any questions in the comment section below.
Best of luck!

XAUUSD - M15 - REJECTION - SHORT/SELLGold has retraced back to its yesterday's level.
Today we can expect it to drop till the next support level.
IF 1H or M15 timeframe give bearish engulfing, we'll
be planning to take short.
Happy trading.!
Best Regards,
The MorningStar Forex

PALANTIR - price rejection as expected Possible targets based on fibo retracement.
In the last post I mentioned this important level of resistance // possible end of this impule:

EURCHF - Potential Bearish Reversal!Hello everyone, if you like the idea, do not forget to support with a like and follow.
As per my previous idea (attached below) we were waiting for EURCHF to approach our upper red daily trendline to look for sell setups.
NOW WHAT?
on H1: EURCHF is forming a trendline in orange but it is not valid yet, so we will be waiting for a third swing to form around it. (projection in purple)
Trigger => Waiting for that swing to form then sell after a momentum candle close below it. (gray area)
Until the sell is activated, EURCHF would be overall bullish and can still trade higher.
and of course, as it approaches the lower blue daily support, we will be looking for trend-following buy setups.
Good luck!
All Strategies Are Good; If Managed Properly!
~Rich

AMAZON - Potential Bearish Reversal!Hello everyone, if you like the idea, do not forget to support with a like and follow.
AMZN is trading inside that big range from Daily timeframe and it is currently sitting around the upper bound / resistance so we will be looking for sell setups on lower timeframes.
on H4: AMZN is forming a trendline in red but it is not valid yet, so we will be waiting for a third swing to form around it. (projection in purple)
Trigger => Waiting for that swing to form then sell after a momentum candle close below it. (gray area)
Until the sell is activated, AMZN would be overall bullish and can still trade higher.
If it breaks above the blue resistance with many big bullish daily candles, then the resistance would become support and we will be looking for buy setups on its retest.
Good luck!
All Strategies Are Good; If Managed Properly!
~Rich

AUDJPY - Looking For Sell Setup!Hello everyone, if you like the idea, do not forget to support with a like and follow.
AUDJPY is approaching a demand zone (in red) so we will be looking for sell setups on lower timeframes.
Before we sell, we want the sellers to prove that they are taking over again.
You don't want to sell a bullish market right?
We will be looking for sell setups on lower timeframes now.
HINT: we have a head and shoulders and trendline forming on M30.
Meanwhile, until the sell is activated, AUDJPY can still test the upper red resistance 85.0 before going down.
In this case, we will be looking for new sell setups to form there.
Good luck!
All Strategies Are Good; If Managed Properly!
~Rich

FLL Rejection or Flag?Rejection on this line here. Maybe a flag formation as well? I feel bearish about this so I bought puts a bit ago, however I didn't really look into that much. Seems bullish to me more. However the rejection makes me think its bearish. Could go either way.

BTC BULLISH BAT PATTERNBitcoin has been consolidating around the 88.6 fib level of the bat pattern. If you notice it has hit that area 5 times and every time it gets rejected(BULLISH) it is currently printing a higher low. For better confirmation wait for price to brake $42k . Good luck!

CHFJPY - War Zones - My Trading Plan!Hello everyone, if you like the idea, do not forget to support with a like and follow.
CHFJPY traded lower aggressively due to FOMC last week. NOW WHAT?
CHFJPY is approaching our long-term red trendline acting as non-horizontal support.
Moreover, the area 118-119 in green is a "Resistance turned into Support".
So the highlighted purple circle is a very strong area to look for buy setups as it is the intersection of support in green and the red trendline.
As per my trading style:
I will be waiting for it to approach the highlighted purple circle (area) to look for possible buy setups (like a double bottom, trendline break , and so on...)
Unless CHFJPY breaks the 118-119 zone downward aggressively with many big bearish candles, then it will become resistance again and we will be looking for sell setups on its retest.
Always follow your trading plan regarding entry, risk management, and trade management.
Good luck!
All Strategies Are Good; If Managed Properly!
~Rich

So You're Saying There Is A Chance....Bitcoin Head & Shoulders rejection target would line up with the Bitcoin Power Law Corridor resistance line at about 100k....

EURCHF - Purple War Zones! Update!Hello everyone, if you like the idea, do not forget to support with a like and follow.
As per my previous idea (attached below) we were waiting for EURCHF to approach one of our Purple War Zones to look for setups.
EURCHF rejected our lower red trendline and traded higher. NOW WHAT?
Since EURCHF is still overall bearish trading inside the red channel, we will be looking for Trend-Following Sell Setups as it approaches the upper purple circle.
Zone 1: (around 1.10)
This highlighted purple circle is a strong area to look for sell setups as it is the intersection of the green resistance and upper red trendline. (acting as non-horizontal resistance)
As per my trading style:
As EURCHF approaches the upper purple circle, I will be looking for reversal bearish setups (like a double top pattern, trendline break, and so on...)
Always follow your trading plan regarding entry, risk management, and trade management.
Good luck!
All Strategies Are Good; If Managed Properly!
~Rich

GBPJPY ANALYSIS LONGThis Pair is a overall sell, because price rejected a strong weekly resistance. And is making Lower Lows on H4.
But As you can see here price failed two times to break the support level.
Price formed bullish engolfing on key support level two times, this indicates that buyers are here. This pattern also formed at our 50% and 61.80% fibb levels I see this pair going up and rejecting our trendline before heading down.
Target is the previous High, and SL is below the Bullish Engolfing pattern.
Good luck!

XAUUSD SHORTOn friday we a massive sell, price broke below support level. Now this support level is resistance, price came back up and could not break this level.
We saw a PIN BAR rejecting our resistance level on the 4H chart.
Sl above the upper wick of the pin bar, and TP is the next support.
Good Luck.

IBM S/R Battle!!Hello Community!
When looking at IBM we can see it clearly trading at the top of the triangle shown on the weekly TF. This has been a powerful rejection area in the past. We have to also take into consideration the more a S/R zone is tested the weaker it gets. The MACD is beginning to tick down and the RSI is showing overbought. I can see a rejection happening from here, which would be a great place to start a short with a tight stop-loss. If entering a trade don't forget to use a stop-loss. Don't trade with what you're not willing to lose.
Love it or hate it, hit that thumbs up and comment. It'll be greatly appreciated!
This is not financial advice.
Safe Trading. Calculate Your Risk/Reward & Collect!
Simplicity Wins (

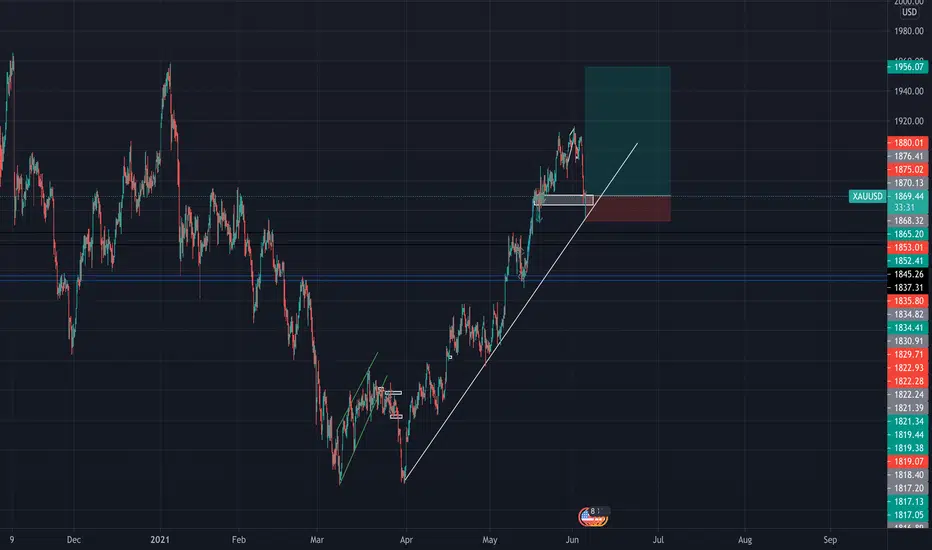
Hit trend line, done with the retest. Back up bullish. The price did the move as we all anticipated, a beautiful 400 pips move down where we just target about 150.
However, after the major retest, we can see the price has made a rejection candle in the 4H time frame and hit trendline which is a good sign of continuing back up. The price may be back up to the 1950 golden zone as we all know.
Allow some beautiful confirmation in your trading and go for a good RR.
Never risk more than 0.5% risk on a single trade.
Good luck everyone.
BTC: Last chance for survival.Every time a death cross happened (200/50MA cross) BTC has entered into a bearish cycle.
During JULY 2017 bullrun, BTC was close to complete a deathcross, 50 and 200MA were getting closer, but after the "dip" a strong rejection happened and price recovered.
That was BTC hope for nowadays price action once we fell from 64k, but then 30k flash crash happened and 200MA 1D (39k) was pierced.
Can we go push prices above 200MA 1D massively and quick so 50MA moves higher quickly and draws away from 200MA avoiding a massive death cross?
It's last BTC hope for resuming the bullrun, otherwise BTC will complete a wyckoff distribution following by an accumulation which may take months.
Marketbuy or crash.
NFA.

ETH - My Trading Plan in 5 mins!Hello everyone, if you like the idea, do not forget to support with a like and follow.
Here is the top-down analysis for ETHUSD, feel free to request any pair/instrument or ask any questions in the comment section below.
Best of luck!

AUDJPY - LongLook for bullish rejection at:
- Previous resistance (84.60)
- Rejection at Fibonacci level 78.6
- Bullish rejection at the support trend line
- Bullish confluence among technical indcators
Also, trend following!
