NZDUSD video top-down AnalysisHello everyone, if you like the idea, do not forget to support with a like and follow.
Here is the top-down analysis for NZDUSD, feel free to request any pair/instrument or ask any questions in the comment section below.
Best of luck!
Rejection

AUDNZD video top-down AnalysisHello everyone, if you like the idea, do not forget to support with a like and follow.
Here is the top-down analysis for AUDNZD, feel free to request any pair/instrument or ask any questions in the comment section below.
Best of luck!

AUDCAD video top-down AnalysisHello everyone, if you like the idea, do not forget to support with a like and follow.
Here is the top-down analysis for AUDCAD, feel free to request any pair/instrument or ask any questions in the comment section below.
Best of luck!

CADJPY video top-down AnalysisHello everyone, if you like the idea, do not forget to support with a like and follow.
Here is the top-down analysis for CADJPY, feel free to request any pair/instrument or ask any questions in the comment section below.
Best of luck!

CADJPY 120 pips SHORTa clear rejection of resistance.
stoch.rsi indicating top.
massive downtrend for 3 years.
2 resistance rejections.
I think it will go down.
use good R:R
This is IDEA not ADVICE.
Happy Trading!

AUDUSD video top-down AnalysisHello everyone, if you like the idea, do not forget to support with a like and follow.
Here is the top-down analysis for AUDUSD, feel free to request any pair/instrument or ask any questions in the comment section below.
Best of luck!

AUDCHF video top-down AnalysisHello everyone, if you like the idea, do not forget to support with a like and follow.
Here is the top-down analysis for AUDCHF, feel free to request any pair/instrument or ask any questions in the comment section below.
Best of luck!

EURNZD video top-down AnalysisHello everyone, if you like the idea, do not forget to support with a like and follow.
Here is the top-down analysis for EURNZD, feel free to request any pair/instrument or ask any questions in the comment section below.
Best of luck!

EURCAD video top-down AnalysisHello everyone, if you like the idea, do not forget to support with a like and follow.
Here is the top-down analysis for EURCAD, feel free to request any pair/instrument or ask any questions in the comment section below.
Best of luck!

EURAUD video top-down AnalysisHello everyone, if you like the idea, do not forget to support with a like and follow.
Here is the top-down analysis for EURAUD, feel free to request any pair/instrument or ask any questions in the comment section below.
Best of luck!

GBPNZD video top-down AnalysisHello everyone, if you like the idea, do not forget to support with a like and follow.
Here is the top-down analysis for GBPNZD, feel free to request any pair/instrument or ask any questions in the comment section below.
Best of luck!

DOW JONES video top-down AnalysisHello everyone, if you like the idea, do not forget to support with a like and follow.
Here is the top-down analysis for DOW JONES, feel free to request any pair/instrument or ask any questions in the comment section below.
Best of luck!

ALO Bearish in 2021The low made in the march will be breached before the mid- 2021
Because of the multiple rejection from the HTF-Monthly and weekly chart
The short term market will bet in cycles but the bearish momentum is in play !
We can only frame the the short-selling positions in the #ALO

GBPCHF Buy SetupIf you like the idea, do not forget to support with a like and follow.
on DAILY: GBPCHF is approaching a support in green so we will be looking for buy setups on lower timeframes.
on M30: GBPCHF is forming a trendline in red (not valid yet) so we will be waiting for a third swing to form around it to consider it valid and then buy on its break upward.
Good Luck!

GBPAUD Buy SetupIf you like the idea, do not forget to support with a like and follow.
on DAILY: GBPAUD is approaching a support in green so we will be looking for buy setups on lower timeframes.
on M30: GBPAUD formed an inverse head and shoulders pattern so we are waiting for a momentum candle close above its neckline (and above the red trendline) to buy.
Conservative traders should wait for a third swing to form around the red trendline to consider it valid, and then buy on its break upward.
Good Luck!

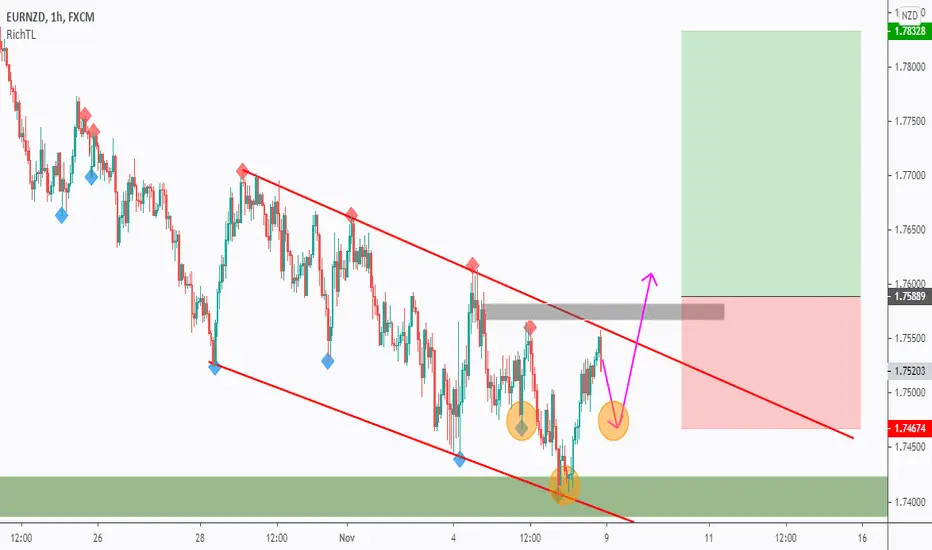
EURNZD Buy SetupIf you like the idea, do not forget to support with a like and follow.
on DAILY: EURNZD is approaching a demand zone in green so we will be looking for buy setups on lower timeframes.
on H1: EURNZD is forming a trendline in red so we will be waiting for a new swing to form around it and then buy on its break upward.
Moreover, this one is forming an inverse head and shoulders pattern (still an idea) which adds more confluence to our setup.
Good Luck!
NZDCHF setting a new high?NZDCHF is currently in a good short-term uptrend, with the price that is just breaking another area of resistance, setting a new 12-day high.
If we have a closer look at the price action, we can see that the setup of the moving averages is slowly turning bullish and the price is also breaking last moving average, the long term one.
There is still a possible key-level to monitor, a downtrend line that already had 2 touches and may work as a potential level of resistance.
In this case, you can enter the trade now and then keep an eye on that level, evaluating the option to exit your trade if we have a rejection, or you can wait for a breakout of that level.
I decided to enter now, with a convenient risk to reward ratio and I will monitor the action around the downtrend line.
Good luck!

NZDJPY Sell SetupIf you like the idea, do not forget to support with a like and follow.
on DAILY: NZDJPY is approaching a resistance in blue so we will be looking for sell setups on lower timeframes.
on M30: NZDJPY is forming a trendline in red (not valid yet) so we will be waiting for a third swing to form around it to consider it valid and then sell on its break downward.
Moreover, this one is forming a head and shoulders pattern (still an idea) which adds more confluence to our setup.
Good Luck!

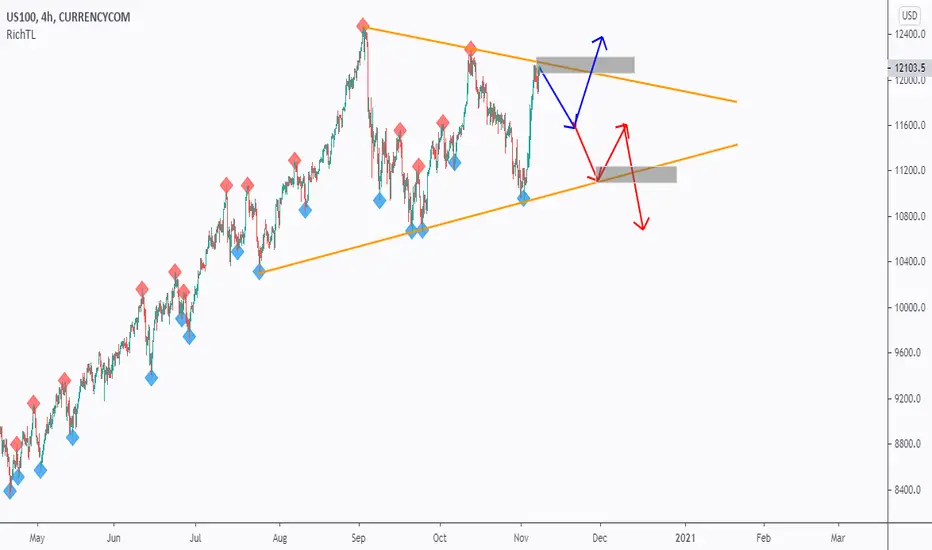
NASDAQ - US100 two possible scenariosIf you like the idea, do not forget to support with a like and follow.
on H4: NASDAQ is currently trading inside this giant symmetrical triangle in orange.
SHORT-TERM: this one is now sitting around the upper orange trendline so we will be looking for sell setups on lower timeframes (M30 and H1)
and we will be looking for buy setups as price approaches the lower orange trendline.
LONG-TERM: we will be waiting for price to form a third swing around the upper orange trendline to consider it valid and then enter buy after a momentum candle close above it.
and we will be waiting for a new swing to form around our lower orange trendline and then sell on its break downward.
Good Luck!
GBPNZD Buy SetupIf you like the idea, do not forget to support with a like and follow.
on DAILY: GBPNZD is approaching a support in green so we will be looking for buy setups on lower timeframes.
on M30: GBPNZD formed a double bottom pattern so we are waiting for a momentum candle close above its neckline (and above the red trendline) to buy.
Conservative traders should wait for a third swing to form around the red trendline to consider it valid, and then buy on its break upward.
Good Luck!

CADJPY video top-down AnalysisHello everyone, if you like the idea, do not forget to support with a like and follow.
Here is the top-down analysis for CADJPY, feel free to request any pair/instrument or ask any questions in the comment section below.
Best of luck!

EURUSD video top-down AnalysisHello everyone, if you like the idea, do not forget to support with a like and follow.
Here is the top-down analysis for EURUSD, feel free to request any pair/instrument or ask any questions in the comment section below.
Best of luck!

NZDCAD video top-down AnalysisHello everyone, if you like the idea, do not forget to support with a like and follow.
Here is the top-down analysis for NZDCAD, feel free to request any pair/instrument or ask any questions in the comment section below.
Best of luck!
