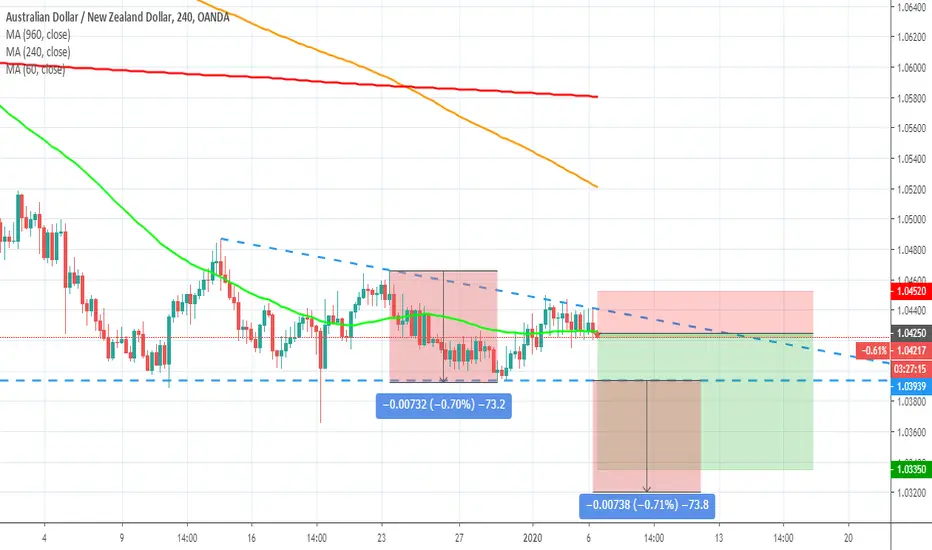
AUDNZD rejection + breakout on a descending triangleAUDNZD action, in the past 20 trading days, seems to be represented very well on the H4 chart by this descending triangle.
Right now, we are having some important upper shadows on the upper part of the triangle, showing that sellers might be interested in getting that range of prices for their short positions.
This is a standard trade for traders who have watched my course on Swing Trading. There is something unusual though. Since the price is already in the last part of the triangle, we don't really have room to trade a rejection with a take profit at the bottom of the chart pattern, because we would have a very bad risk to reward ratio. In this case, I will also consider a possible breakout of the pattern, placing my take profit below it. Regarding the take profit, standard measured move applied to breakouts.
Setup of moving averages is in favor.
Risk to reward ratio better than 1:3, it is a good chance to trade.
Rejection
USDJPY rejection on the Ichimoku cloudUSDJPY is in a short term downtrend that is highlighted very well by the Ichimoku indicator, with the two fundamental conditions that are in favor of a bearish scenario.
At the moment, we don't really have a concrete reason to open a short position:
1. There's no sign of sellers. Just a few bearish candles, but nothing special. Two weak bearish engulfing patterns and one strong red candle that has been immediately matched by a strong green candle;
2. Chikou span just crossed the price, going above. This is usually a buy signal;
3. Price above the kijun sen;
4. Tenkan sen above the kijun sen
For these reasons, I would like to propose a sell stop entry order, instead of a market order.
Trading a rejection here makes sense because the price is not only approaching the Ichimoku cloud, but also two key-levels. A first key level is shown in red, it is the horizontal line that starts from last important swing high (red arrow). It is obvious that, if the price goes above it, we need to question the existence of a downtrend, since we would have a higher high, that is a characteristic of an uptrend.
Another important level is highlighted in light blue, with the horizontal line showing a recent short-term resistance, with the price clearly struggling to go above it.
So, if from one side, trading a rejection makes sense, from the other side, we also need to wait for a confirmation, since we still have 4 points (mentioned above) that are not clear or not in favor of a short position.
I placed a sell stop entry order at 108.24, waiting for the price to go down, leaving this short term congestion phase.
At 108.24, we will also have the price very close to the blue line, the red line heading down again and the Chikou span about to cross the price from above.
I decided to place the stop loss above the resistance analyzed before, that would also be above the cloud about 20 candles from the current price.
Regarding the take profit, standard measured move with a small discount, that would give a risk to reward ratio that is better than 1:2.

USDJPY - SHORT price has rejected off the descending trend line with a shooting star on the weekly chart also a bearish engulfing candle indicates alot of selling pressure in this pair. wait for a retest of support and look for clear signs of rejection before entering a short position

XAUUSD 4hr - At 5 Month highs. Awaiting breakout or rejection.Gold is currently sitting around the resistance zone at a 5 month highs.
We are expecting breakout here for continuation or rejection and for gold to fall. If the rejection happens this is a great opportunity to catch a lot of pips on the downfall.
This is one we are watching closely at the moment.
We will be looking very closely for rejection here or a possible breakout to the upside.
Big things coming for Gold over next week guys.

HK33HKD (Hong Kong Index) D1Price has reached the top of the long term channel, rejecting the supply zone (blue level) with a rejection candle. From here, will be watching for price to make its way back towards the bottom of the channel to the highlighted zoned below..

USDJPY - SHORT price is showing signs of rejection of the resistance level, also the dollar is looking weak across the board DXY

GBPUSD- TRENDLINE BOUNCE SOON-LONGDuring this couple weeks, #GBP pairs were very dodgy, being influenced a lot by major news, but as i said, trading is 90% technical, the price started fixing the huge volatility and gave us a new perspective of a new channel. The rejecton was very beautiful and now the price is preparing to touch the current trendline, touching also and intra support&resistance. the stochastic RSI looks good. Now all we have to do is to wait !
Follow me here and on instagram too @samurai.trader

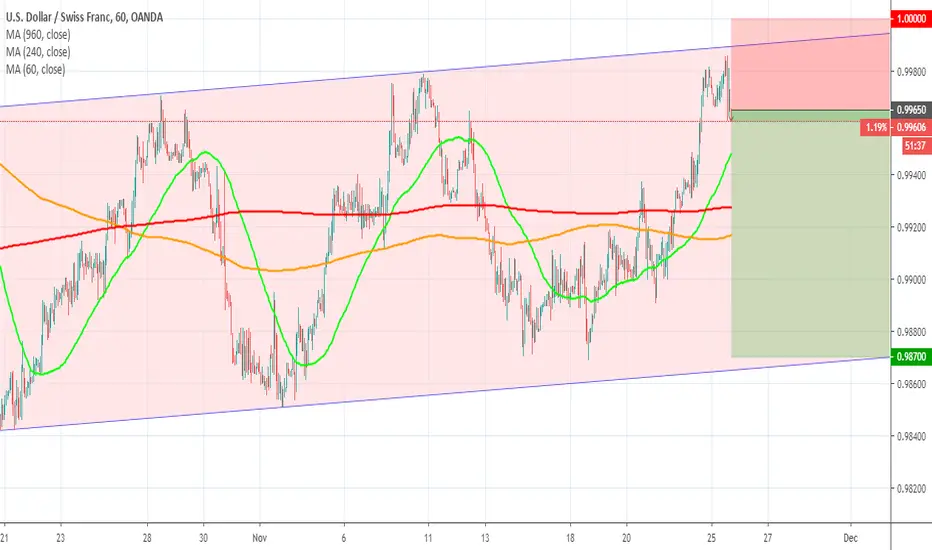
USDCHF rejection on the up-channelUSDCHF reached the top of an ascending channel that we've been monitoring for the past 2 weeks.
Sellers had a nice reaction, with a shooting start, followed by a bearish engulfing pattern.
Risk to reward ratio is very good for this trade, so it's worth a try.
A complete analysis of it is available on my last video on my YouTube channel.
Short GBPUSDPrice made a huge bullish move into May 2019 High Region.
On 1HTF, price made a few rejection candles in this area.
Price made HH, about to retrace to make HL

200 EMA says BTC will drop to 5k in 2 weeks.The chart is showing up 200EMA indicator .
This idea displays an unavoidable scenario which bulls are doing their best to stop it. BTC will drop to $5000 in the following weeks (2).
On the other hand the volume is decreasing, which supports the idea about sideway trading = further price crash .
Open shorts whenever you got a profit (even if that's less than 1%) while you can do it. Stop losses = 1%.

EURGBP trading an ordinary pennant with an unusual tradeOk, this is not an ordinary trade, so let's start from the analysis of what is standard in this chart.
There is a very standard pennant, with the price that is forming lower highs and higher lows.
Elements for a short positions:
1. Pennant after a down-movement, breaking a tight range that lasted for nearly one month (bearish chart pattern, in this case);
2. I expect GBP to be strong during this first half of the month. I talked a lot about it in a video on my YouTube channel;
3. Last reaction at the top of the pennant, has been quite strong. To be fair, even last reaction by buyers at the bottom of the pennant, has been very strong. This was mainly due to a strong EUR with a positive Economic Calendar at the beginning of this trading week. Certainly not due to a weak GBP, that is actually behaving quite well against other currency pairs.
Why do I say that this is an unusual trade? Because I'm not trading any rejection, since the price is in the middle of the pennant, but I'm trading a breakout before this is actually happening. The two main reasons for this are: I see GBP starting the trading week with low volatily, as in the previous month, but getting momentum today, with some strong candles at the opening of the London session. The second reason is that I can take advantage of a very good risk to reward ratio, better than 1:3.
Not an ordinary trade, probably the first exotic idea that I publish here on TradingView, but still following what I believe is the best, without deviating much from my trading strategy.
I took some time to write this, I see that the price is meanwhile at 0.8534, I hope you can still plan your trade carefully and wisely :)

HOW MANY TIMES U WILL FALL FOR THIS BTC SAME SCENARIO EVERYDAY, LOOK HOW MANY TRENDLINES EVERYDAY, IF YOU DRAW ALL THESE LINE YOU CAN TRADE WITH A WORKING STRATEGY.
PEOPLE THINK THE CME GAP AT 7.8K WILL BE FILLED BEFORE MORE DOWN, TECHNICALLY THIS IS NOT NEEDED, SOME GAPS CAN TAKE MONHTS, SO IN CASE WE GO HERE PLACE YOUR SHORT AT THAT LEVEL.
indicator used:
DIP DETECTOR (RED DOTS, ALERTS WHEN DURING STRONG DIP, IN CASE YOU WANT LONG)

SHORT MEAN SHORT EVERY BOUNCE.People really was longed the breakdown of trend line at 7.3? REALLY?
HERE THE SHORT SIGNAL, NICE PROFITS.
Indicator used:

BSE:SENSEX is at ATH but got rejected by a year old trendlineBSE:SENSEX has recorded a All Time High today(26-Nov-19) but it was rejected by a trendline that extends from August 2018 till today. If this trendline is broken on a daily closing basis then I am expecting SENSEX to continue to the upside.


BTC 2 OPTIONSS1 AND S2, CURRENT PLAYING THIS TIGHT RANGE 7.1K TO 7.3K, I PREFER A BOUNCE FROM 6.9K AREA, I THINK WE WILL TAP IT BEFORE UPWARDS AND WILL CLOSE LIKE HAMMER CANDLE ON HOURLY AND H4.
LET SEE.
Indicator used


GBPCHF out of a 5-week congestion period!GBPCHF seems to have the necessary strength to get out of a 5-week congestion phase. that is quite unusual for such a volatile currency pair.
Buyers seem to push the price higher, already attempting once to break the resistance formed by the sideways trend. Bad news is that the price is currently also forming lower highs, showing a very tight pennant on the chart.
In this case, we need to have a second confirmation by buyers, so we will wait for a stronger action that would push the price out of the long term sideways trend and the short term pennant.

USDCAD on a triple possible level of support!USDCAD is on a support formed by a very important swing high that we had before. In addition, right on the same level, there are the red and the orange moving averages that could work as dynamic key-levels.
Normally, we wait for a sign of rejection, but we can get an extraordinary risk-to-reward ratio structuring our trade like this, so I'm going to reduce a little my risk per trade and try to go the distance with it :)

EURUSD rejection on the Ichimoku CloudEURUSD is a currency pair that we were already monitoring in our daily analysis on YouTube. As I mentioned yesterday, I wanted to wait for a better signal because the blue line of the Ichimoku Indicator was heading up for the first time in a while, so not a good sign for a possible short position. We finally had a good rejection on the cloud, with some strength by sellers. In addition, we had a breakout of the previous swing low, even though the price didn't have any strong acceleration, mainly due to lack of volatility during the last period.
Overall, this is a good chance to open a trade with the Ichimoku, having also a nice risk to reward ratio.


LINK WEAKLINK SEEM WEAK, 3 TOUCH OF RESISTANCE H4 FORMING A POSSIBLE "HEAD AND SHOULDER" TARGETING RANGE LOW.
THIS IS A TEST, COULD BE WRONG.
Indicator used:
KEANU REEVES
BERA RSI

EURAUD continuation of the downtrendI know, I know. You are not very happy about the 1:1.9 risk to reward ratio :)
I want to start the analysis from there. The risk to reward ratio is not very appealing and we usually trade with a ratio that is at least 1:2.
The reason I still like this trade is that the down-channel is very steep, this offers the possibility to easily adjust the stop loss and the take profit if the trade proceeds in a favorable direction. This is one of those few opportunities I like to trade with a trailing stop order, since it makes sense to move the stop loss as the trade proceeds, as long as the stop loss remains above the down-channel.
Regarding the logic of the trade, right now, there is no action by sellers, so I think it doesn't make sense to open a trade immediately. I will wait for more action by sellers, placing a stop entry order at 1.6050.
With the price going above the channel, we will cancel our trade.
