GBPJPY - Video Top-Down Analysis!Hello TradingView Family / Fellow Traders. This is Richard, as known as theSignalyst.
Here is a detailed update top-down analysis for GBPJPY .
Which scenario do you think is more likely to happen? and Why?
Always follow your trading plan regarding entry, risk management, and trade management.
Good Luck!.
All Strategies Are Good; If Managed Properly!
~Rich
Rejection

XRP technical analyze | posibility for long position on XRPUSDThello guys
we have a very good opportunity for XRP long position
As you can see in the chart, there is 2 way for XRP movement, and its up to Bitcoin movement in the next few days, so you should wait for a break out or confirmation of rejection
all you need to know is in the chart
good luck
The information provided on this Page does not constitute investment advice, financial advice, trading advice, or any other sort of advice and you should not treat any of the website's content as such. this page does not recommend that any cryptocurrency should be bought, sold, or held by you. Do conduct your own due diligence and consult your financial advisor before making any investment decisions

Selloff IncomingWe've been rejected at every previous swing low for the past 14 months. There's no logical reasoning to assume that 17k won't act as brick wall resistance. 10k would mark a full 80% drop from the ATH, which historically speaking is in line with past sell offs.

EURNZD - Trend-Following Buy Setup!Hello TradingView Family / Fellow Traders. This is Richard, as known as theSignalyst.
EURNZD is overall bullish from a long-term perspective trading inside the blue rising broadening wedge, and it is currently retesting the lower blue trendline.
Moreover, the zone 1.615 - 1.630 is a strong support zone .
So the highlighted purple circle is a strong area to look for buy setups as it is the intersection of the green support zone and lower blue trendline. (acting as non-horizontal support)
As per my trading style:
As EURNZD approaches the purple circle zone, I will be looking for bullish reversal setups (like a double bottom pattern, trendline break , and so on...)
Always follow your trading plan regarding entry, risk management, and trade management.
Good luck!
All Strategies Are Good; If Managed Properly!
~Rich

BTC Detailed Top-Down Analysis - Day 108Hello TradingView Family / Fellow Traders. This is Richard Nasr, as known as theSignalyst.
108 out of 500 days done.
I truly appreciate your continuous support everyone!
Let me know if you like the series, and if you would like me to change or add anything.
Always follow your trading plan regarding entry, risk management, and trade management.
Good Luck!.
All Strategies Are Good; If Managed Properly!
~Rich

Downtrend May BreakWatching out for the possible downtrend/200 SMA false break.
Upon breaking the downtrend & 200 SMA, I will be watching 410-440 area for a possible rejection for entry short.

BTC Detailed Top-Down Analysis - Day 107Hello TradingView Family / Fellow Traders. This is Richard Nasr, as known as theSignalyst.
107 out of 500 days done.
I truly appreciate your continuous support everyone!
Let me know if you like the series, and if you would like me to change or add anything.
Always follow your trading plan regarding entry, risk management, and trade management.
Good Luck!.
All Strategies Are Good; If Managed Properly!
~Rich

AUDNZD - Strong Rejection Zones!Hello TradingView Family / Fellow Traders. This is Richard, as known as theSignalyst.
AUDNZD is overall bearish trading inside the red channel, however, it is now approaching the lower red trendline acting as a non-horizontal support zone .
Moreover, the zone 1.07 is a strong support zone .
So the highlighted purple circle is a strong area to look for buy setups as it is the intersection of the green support zone and lower red trendline. (acting as non-horizontal support)
As per my trading style:
Since AUDNZD is around the lower purple circle zone, I will be looking for bullish reversal setups (like a double bottom pattern, trendline break , and so on...)
and of course, as AUDNZD approaches the upper red trendlines, we will be looking for trend-following sell setups.
Always follow your trading plan regarding entry, risk management, and trade management.
Good luck!
All Strategies Are Good; If Managed Properly!
~Rich

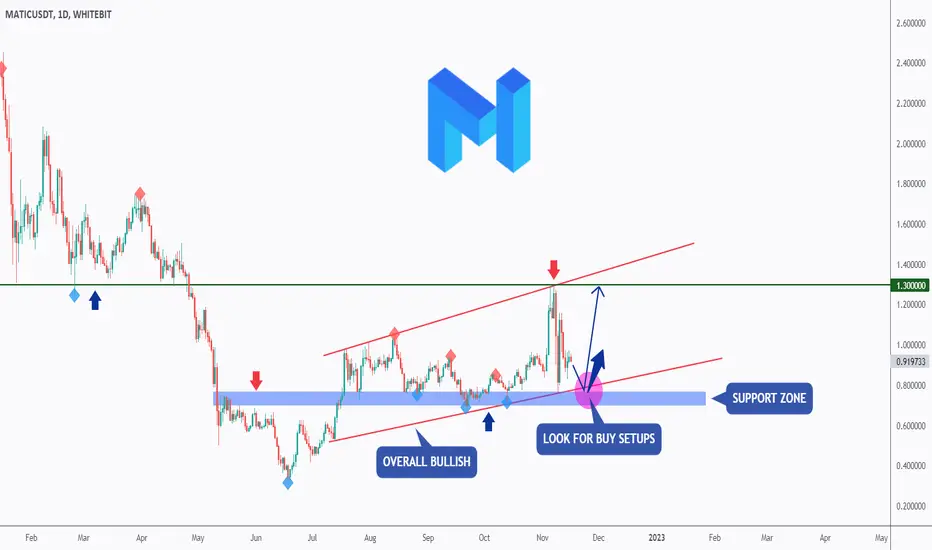
MATIC - Standing Strong!Hello TradingView Family / Fellow Traders. This is Richard, as known as theSignalyst.
MATIC is overall bullish trading inside the red channel and now approaching the lower trendline.
Moreover, the blue zone around 0.7 is a strong support zone .
So the highlighted purple circle is a strong area to look for buy setups as it is the intersection of the blue support zone and lower red trendline. (acting as non-horizontal support)
As per my trading style:
As MATIC approaches the purple circle zone, I will be looking for bullish reversal setups (like a double bottom pattern, trendline break , and so on...)
Always follow your trading plan regarding entry, risk management, and trade management.
Good luck!
All Strategies Are Good; If Managed Properly!
~Rich
USDJPY - Trend-Following Buy Setup!Hello TradingView Family / Fellow Traders. This is Richard, as known as theSignalyst.
As per my last analysis (below) we were looking for sell setups on USDJPY around an over-bought zone.
USDJPY rejected our upper brown trendline and traded lower. Now What?
USDJPY is overall bullish from a medium-term perspective trading inside the orange rising broadening wedge, and it is currently around the lower orange trendline.
Moreover, the green zone is a previous major high.
So the highlighted lower purple circle is a strong area to look for buy setups as it is the intersection of the green support zone and lower orange trendline. (acting as non-horizontal support)
As per my trading style:
Since USDJPY is around the purple circle zone, I will be looking for bullish reversal setups (like a double bottom pattern, trendline break , and so on...)
Meanwhile, if we break the orange trendline downward, USDJPY can still trade lower to test the lower support.
Always follow your trading plan regarding entry, risk management, and trade management.
Good luck!
All Strategies Are Good; If Managed Properly!
~Rich

AUDUSD - Trend-Following Sell Setup!Hello TradingView Family / Fellow Traders. This is Richard, as known as theSignalyst.
AUDUSD is still overall bearish from a long-term perspective trading inside the brown channel, and it is currently retesting the upper brown trendline.
Moreover, the zone 0.675 - 0.685 is a strong resistance zone .
So the highlighted purple circle is a strong area to look for sell setups as it is the intersection of the green resistance zone and upper brown trendline. (acting as non-horizontal resistance)
As per my trading style:
Since AUDUSD is approaching the purple circle zone, I will be looking for bearish reversal setups (like a double top pattern, trendline break , and so on...)
and of course, as it retests the blue support, I will be looking for buy setups.
Always follow your trading plan regarding entry, risk management, and trade management.
Good luck!
All Strategies Are Good; If Managed Properly!
~Rich

Whats next for SPY? This is a trendline I am watching going into the weekend on $SPY
The fact we did not test the bottom trendline before retesting the upper, suggest the next leg down will be more aggressive than the previous bear sessions.
Also, based on previous bear sessions, we head down -17.50 after rejection within a 50 day window. If we use the same price action, we can anticipate SPY to be at AROUND $330 by New Years. (Assuming it is not more aggressive. But I believe the next leg down will be)

DOW JONES INDUSTRIAL Major Level here! The Dow Jones Industrial Average Indice is seeing a major runup the past few weeks since the beginning of October.
The Dow has seen record gains of 17% since its bottom in Early October.
The Dow is now running into some big-time resistance... That is our focus today to dive in to.
The 30 companies pushing the Dow up may be becoming overbought indicated from RSI and other oscillators.
TrendLine 1
But what we're looking at is the Dow's trendline analysis. We are seeing a Long Time Resistance Line Dating back actually all the way to 2008 guiding as a mean resistance point being touched now again! This marked 'Blue' Line represents that resistance and the Dow is approaching and testing that level now. A Rejection could lead to a selloff, if History Repeats and Dow does not want to head higher at this time.
OPINION : Dow will only break this trendline if looking to really meltup or erase losses and hit All Time Highs. If this is not the case yet, I do not see this breaking upwards at this level.
TrendLine 2
This Trendline has lasted and been intact since the kickoff of the 2022 Bear Market.
We have seen numerous Retests and Rejections of this Resistance Line, and we are now testing this again.
We have YET to break through this barrier, as it guides the market lower & lower.
Again The Dow will need major buying to break thru these levels, as massive resistance is present.
OPINION : Same as above, I can only see a break upwards if buyers really believe Dow is going back to ATH or erase gains in a massive market melt-up
Contrarian to my Writing : This article mainly features idea of a rejection, but one thing that particularly makes me more bullish on Technicals here is that the S&P / NASDAQ have yet hit their own bear market trendlines and this could rally the market up higher to those areas. If this happens, it is likely the Dow follows this movement somewhat, and could see a break above.
Something to keep note of!!!

Four big rejections at resistence this YearENR showing three big rejections at resistance YTD.
Dip coming again. ↘

GMT hard down .gmt is currently testing on both daily trend line which is really strong and the previous daily resistance too.so we can see a potencial rejection the it will fall till previous broken resistance which become the support

AUDCAD Short term buy from support Welcome back! Let me know your thoughts in the comments!
**AUDCAD - Listen to video!
We recommend that you keep this pair on your watchlist and enter when the entry criteria of your strategy is met.
Please support this idea with a LIKE and COMMENT if you find it useful and Click "Follow" on our profile if you'd like these trade ideas delivered straight to your email in the future.
Thanks for your continued support!
Brian & Kenya Horton, BK Forex Academy

BTC Detailed Top-Down Analysis - Day 92Hello TradingView Family / Fellow Traders. This is Richard Nasr, as known as theSignalyst.
92 out of 500 days done.
I truly appreciate your continuous support everyone!
Let me know if you like the series, and if you would like me to change or add anything.
Always follow your trading plan regarding entry, risk management, and trade management.
Good Luck!.
All Strategies Are Good; If Managed Properly!
~Rich

EURCAD - Trend-Following Setup!Hello TradingView Family / Fellow Traders. This is Richard, as known as theSignalyst.
EURCAD is overall bearish trading inside the brown channel, and it is currently retesting the upper brown trendline.
Moreover, the zone 1.37 - 1.38 is a strong resistance zone .
So the highlighted purple circle is a strong area to look for sell setups as it is the intersection of the green resistance zone and upper brown trendline. (acting as non-horizontal resistance)
As per my trading style:
Since EURCAD is approaching the purple circle zone, I will be looking for bearish reversal setups (like a double top pattern, trendline break , and so on...)
and of course, as it retests the blue support, I will be looking for buy setups.
Always follow your trading plan regarding entry, risk management, and trade management.
Good luck!
All Strategies Are Good; If Managed Properly!
~Rich

GBPAUD BIG UPSIDE MOVE COMING!?!Nice risk reward trade idea off this current 1hr resistance which also lines up with the other pairs I'm looking at (AUDUSD pullback). Morning star formation on the 1hr so we should see price push up from current price!

AUDJPY - Video Top-Down Analysis!Hello TradingView Family / Fellow Traders. This is Richard, as known as theSignalyst.
Here is a detailed update top-down analysis for AUDJPY
Which scenario do you think is more likely to happen? and Why?
Always follow your trading plan regarding entry, risk management, and trade management.
Good Luck!.
All Strategies Are Good; If Managed Properly!
~Rich

EURCHF - Video Top-Down Analysis!Hello TradingView Family / Fellow Traders. This is Richard, as known as theSignalyst.
Here is a detailed update top-down analysis for EURCHF
Which scenario do you think is more likely to happen? and Why?
Always follow your trading plan regarding entry, risk management, and trade management.
Good Luck!.
All Strategies Are Good; If Managed Properly!
~Rich

Down Side Playing Out?After yesterday's candle, downside is looking more probable now. Bulls had a chance to stay above the 20 EMA, but were not successful. At the time of writing, Futures are trading at about 3645ish down 0.82%. Do we visit 3600 today? May 3580? We could dip down to 3570 and recover by EOD to finish back at 3645 or 3600. That would tell me that the market wants to wait for earnings next week before it continues to sell more. The last 4 or 5 Fridays we've had, were all down days. So, will today be different? The Purple line is the Feb. 20th 2020 high right before we had the COVID drop. That is one of my target points that I would anticipate to come by next week. Possibly by the beginning of November. Next week could give us a clearer picture as to what's to come.
At the beginning of the month, I thought we were going to come down hard to 3400 fast. But after watching what's been happening the last couple weeks, this is looking more like a slow grind down to 3400. Yesterday I said that we could finish the year at around 3600ish, after our Santa Clause Rally. How? I looked at the monthly chart, and as of now, it's a DOJI. So let's say we finish the month at 3400. That would give us a similar candle like we had in August. Then look how September played out. If we close the month at 3400ish, and volatility continues to creep up, then 2900 is a possibility late November or maybe even beginning of December? That would be more enticing for a Santa Clause Rally come the start of December. Again, I'd need to see the VIX get between 40-50 first before I consider any upside in the market. Be patient, react, trade the market in front of you and stay disciplined. Happy trading everyone!

AUDUSD trading the consolidation zone!Will be looking for rejections on either side of each support and resistance within this consolidation zone we have created on the 4hr.. Possible rejection for a reversal? we never know and id rather be positioning myself for entry's to try catch it if we see that scenario.. but also as always never forget overall downside direction the the different time zones!
