Deep Dive Into Relative Strength Index (RSI)The Relative Strength Index (RSI) is a momentum oscillator developed by J. Welles Wilder Jr. that measures the speed and magnitude of price changes.
Introduction
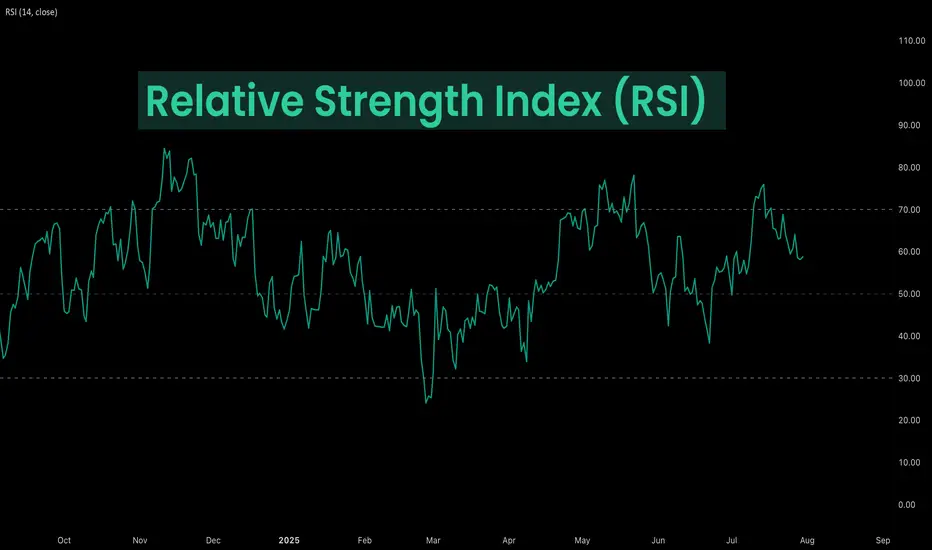
In the world of trading, timing is everything — and few indicators have stood the test of time like the Relative Strength Index (RSI). Introduced by J. Welles Wilder in 1978, the RSI is a momentum oscillator that helps traders evaluate the strength and speed of price movements. Whether you're trading stocks, forex, or crypto, understanding how RSI is calculated and how to interpret its signals can give you a critical edge.
In this article, we’ll break down exactly how the RSI works, explore its formula, and dive into practical ways you can incorporate it into your trading strategies. From spotting potential reversals to identifying overbought and oversold conditions, the RSI remains a cornerstone of technical analysis — but only if you know how to use it properly.
Let’s explore the mechanics and the mindset behind this powerful indicator.
What Is RSI and How Is It Calculated?
The Relative Strength Index (RSI) is a momentum oscillator that measures the speed and change of price movements over a defined period. It outputs a value between 0 and 100, which helps traders determine whether an asset is overbought or oversold.
The default RSI setting uses a 14-period lookback window and is calculated with the following steps:
🔷Calculate the average gain and loss over the last 14 periods:
Average Gain = Sum of all gains over the past 14 periods / 14
Average Loss = Sum of all losses over the past 14 periods / 14
🔷Compute the Relative Strength (RS):
RS = Average Gain / Average Loss
🔷Apply the RSI formula:
RSI=100−(100/(1+RS))
The result is a single number between 0 and 100 that indicates the asset's momentum.
How to Use RSI in Trading Strategies
⚡️Overbought and Oversold Conditions Strategy
RSI > 70 typically signals that an asset may be overbought and due for a pullback.
RSI < 30 suggests the asset might be oversold, potentially primed for a bounce.
However, these levels aren’t absolute sell or buy signals. In strong trends, RSI can stay overbought or oversold for extended periods.
📈Long Trading Strategy Example:
1. Identify the major trend, to find the long trades it shall be uptrend. On the screen below you can see 1D time frame for BITMART:BTCUSDT.P .
2. Move to lower time frame (in our case 4h) and find the moment when RSI falls below 30. This is our oversold condition and we are going to look for long trade.
3. Find the local support zone and open long trade.
4. Take profit when price reaches resistance level next to the previous swing high
5. Don’t forget to put initial stop loss when enter position. The best stop loss which will give you 3:1 risk to reward ratio.
📉Short Trading Strategy Example
1. Identify the major trend, to find the short trades it shall be downtrend. On the screen below you can see 1D time frame for BITMART:ETHUSDT.P .
2. Move to lower time frame (in our case 4h) and find the moment when RSI grows above 70. This is our overbought condition and we are going to look for short trade.
3. Find the local resistance zone and open short trade.
4. Take profit when price reaches support level next to the previous swing low
5. Don’t forget to put initial stop loss when enter position. The best stop loss which will give you 3:1 risk to reward ratio.
⚡️RSI Breakout Strategy
RSI is breaking through 60 indicating bullish momentum shift if the long-term trend is bullish can be the potential long signal
RSI is breaking down 40 indicating bearish momentum shift if the long-term trend is bearish can be the potential short signal
This strategy works great only on the trending market, don’t use it on the range bounded market to avoid whiplashes.
📈Long trading strategy example:
1. Make sure that long-term trend is bullish. Use 200 period EMA as its approximation. If price remains above it we can look for potential long trade setup.
2. If RSI crossed above the level 60 open long trade.
3. Put the initial stop-loss under the signal candle’s low.
4. Take profit when price reached 3:1 risk-to-reward ratio.
📉Short trading strategy example
1. Make sure that long-term trend is bearish. Use 200 period EMA as it’s approximation. If price remains below it we can look for potential short trade setup.
2. If RSI crossed below the level 40 open short trade.
3. Put the initial stop-loss above the signal candle’s high.
4. Take profit when price reached 3:1 risk-to-reward ratio. In our case we received very fast and profitable trade
⚡️RSI Divergence Strategy
RSI can be used also as a trend reversal indicator if we are looking for divergences. This is very reliable sign of current trend weakness and great opportunity open trade against the trend. Usually it’s not recommended, but in case if divergence can be applicable.
Bullish divergence is the situation when price created the lower low, while RSI made the lower low. Usually, it indicates that current downtrend is weakening and we can look for long trades
Bearish divergence is the situation when price created the higher high, while RSI made the lower high. Usually, it indicates that current uptrend is weakening and we can look for short trades
😎Important hint: it’s rarely covered in textbooks about technical analysis, but in our opinion it’s better to used divergences when RSI was able to cross level 50 between two lows/highs.
📈Long trading strategy example
1. Find at the chart situation, when the price made the lower low
2. At the same time RSI shall set the higher low
3. RSI shall break level 50 between these lows indicating shift to the bullish momentum
4. If price failed to set the clean breakdown open long trade on the candle which set the lower low. Put stop loss under it’s low
5. Take profit at 3:1 RR. When you master this concept, you will be able to have much more RR trades, even 10:1. This is possible because when trend finish you have the highest potential upside
📉Short trading strategy example
1. Find at the chart situation, when the price made the higher high
2. At the same time RSI shall set the lower high
3. RSI shall break level 50 between these highs indicating shift to the bearish momentum
4. If price failed to set the clean breakout open short trade on the candle which set the higher high. Put stop loss above it’s high
5. Take profit at 3:1 RR. When you master this concept, you will be able to have much more RR trades, even 10:1. This is possible because when trend finish you have the highest potential upside
Conclusion
The Relative Strength Index (RSI) remains one of the most powerful and flexible tools in a trader’s technical arsenal — but its real value lies in how you use it.
We’ve explored three key RSI strategies:
✅ Overbought/Oversold setups offer simple entry signals in ranging markets, where price tends to revert to the mean.
✅ Breakout strategies unlock RSI’s momentum-tracking potential, helping you ride strong directional moves with confidence.
✅ Divergence detection reveals hidden shifts in market sentiment, giving you an early warning of possible reversals or trend continuations.
Each approach has its strengths — and its risks — but together, they offer a complete framework for using RSI across different market conditions
🔑 Key Takeaways:
RSI is not just a “buy low, sell high” tool — it’s a multi-dimensional indicator that adapts to trends, momentum, and market structure.
The best RSI signals come from confluence: combining RSI with price action, support/resistance, volume, or trend filters like moving averages.
Patience and discipline are essential — RSI signals are only effective when paired with proper risk management and confirmation.
By mastering RSI beyond the basics, you'll be better equipped to make timely, confident, and informed trading decisions — whether you're entering a pullback, chasing a breakout, or spotting the early signs of reversal.
Relative
Fibonacci Retracement: The Hidden Key to Better EntriesIf you’ve ever wondered how professional traders predict where price might pull back before continuing... the secret lies in Fibonacci Retracement.
In this post, you’ll learn:
What Fibonacci retracement is
Why it works
How to use it on your charts (step-by-step)
Pro tips to increase accuracy in the market
🧠 What Is Fibonacci Retracement?:
Fibonacci Retracement is a technical analysis tool that helps traders identify potential support or resistance zones where price is likely to pause or reverse during a pullback.
It’s based on a mathematical sequence called the Fibonacci Sequence, found everywhere in nature — from galaxies to sunflowers — and yes, even in the markets.
The Fibonacci sequence is a series of numbers where each number is the sum of the two preceding ones, starting with 0 and 1. The sequence typically begins with 0, 1, 1, 2, 3, 5, 8, 13, and so on. This pattern can be expressed as a formula: F(n) = F(n-1) + F(n-2), where F(n) is the nth Fibonacci number.
The key Fibonacci levels traders use are:
23.6%
38.2%
50%
61.8%
78.6%
These levels represent percentages of a previous price move, and they give us reference points for where price might pull back before resuming its trend and where we can anticipate price to move before showing support or resistance to the trend you are following.
💡Breakdown of Each Fib Level:
💎 0.236 (23.6%) – Shallow Pullback
What it indicates:
Weak retracement, often signals strong trend momentum.
Buyers/sellers are aggressively holding the trend.
Best action:
Aggressive entry zone for continuation traders.
Look for momentum signals (break of minor structure, bullish/bearish candles). Stay out of the market until you see more confirmation.
💎 0.382 (38.2%) – First Strong Area of Interest
What it indicates:
Healthy pullback in a trending market.
Seen as a key area for trend followers to step in.
Best action:
Look for entry confirmation: bullish/bearish engulfing, pin bars, Elliott Waves, or break/retest setups.
Ideal for setting up trend continuation trades.
Stop Loss 0.618 Level
💎 0.500 (50.0%) – Neutral Ground
What it indicates:
Often marks the midpoint of a significant price move.
Market is undecided, can go either way.
Best action:
Wait for additional confirmation before entering.
Combine with support/resistance or a confluence zone.
Useful for re-entry on strong trends with good risk/reward.
Stop Loss 1.1 Fib Levels
💎 0.618 (61.8%) – The “Golden Ratio”
What it indicates:
Deep pullback, often seen as the last line of defense before trend reversal.
High-probability area for big players to enter or add to positions.
Best action:
Look for strong reversal patterns (double bottoms/tops, engulfing candles).
Excellent area for entering swing trades with tight risk and high reward.
Use confluence (structure zones, moving averages, psychological levels, Elliott Waves).
Wait for close above or below depending on the momentum of the market.
Stop Loss 1.1 Fib Level
💎 0.786 (78.6%) – Deep Correction Zone
What it indicates:
Very deep retracement. Often a final “trap” zone before price reverses.
Risk of trend failure is higher.
Best action:
Only trade if there's strong reversal evidence.
Use smaller position size or avoid unless other confluences are aligned.
Can act as an entry for counter-trend trades in weaker markets.
Stop Loss around 1.1 and 1.2 Fib Levels
⏱️Best Timeframe to Use Fibs for Day Traders and Swing Traders:
Day trading:
Day traders, focused on capturing short-term price movements and making quick decisions within a single day, typically utilize shorter timeframes for Fibonacci retracement analysis, such as 15-minute through hourly charts.
They may also use tighter Fibonacci levels (like 23.6%, 38.2%, and 50%) to identify more frequent signals and exploit short-term fluctuations.
Combining Fibonacci levels with other indicators such as moving averages, RSI, or MACD, and focusing on shorter timeframes (e.g., 5-minute or 15-minute charts) can enhance signal confirmation for day traders.
However, relying on very short timeframes for Fibonacci can lead to less reliable retracement levels due to increased volatility and potential for false signals.
Swing trading:
Swing traders aim to capture intermediate trends, which necessitates giving trades more room to fluctuate over several days or weeks.
They typically prefer utilizing broader Fibonacci levels (like 38.2%, 50%, and 61.8%) to identify significant retracement points for entering and exiting trades.
Swing traders often focus on 4-hour and daily charts for their analysis, and may even consult weekly charts for a broader market perspective.
🎯 Why Does Fibonacci Work?:
Fibonacci levels work because of:
Mass psychology – many traders use them
Natural rhythm – markets move in waves, not straight lines
Institutional footprint – smart money often scales in around key retracement zones
It's not magic — it's structure, and it's surprisingly reliable when used correctly.
🛠 How to Draw Fibonacci Retracement (Step-by-Step):
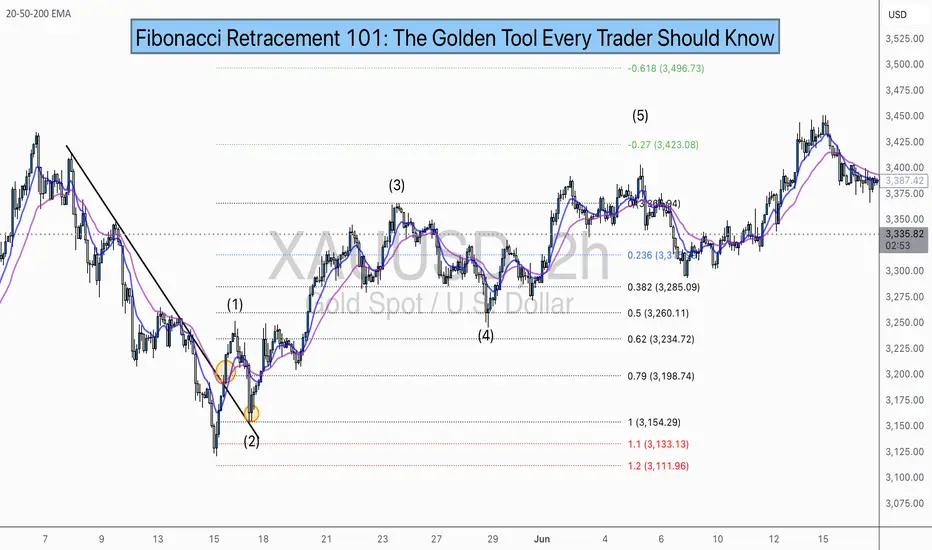
Let’s say you want to trade XAU/USD (Gold), and price just had a strong bullish run.
✏️ Follow These Steps:
Identify the swing low (start of move)
Identify the swing high (end of move)
Use your Fibonacci tool to draw from low to high (for a bullish move)
The tool will automatically mark levels like 38.2%, 50%, 61.8%, etc.
These levels act as pullback zones, and your job is to look for entry confirmation around them.
🔁 For bearish moves, draw from high to low. (I will show a bearish example later)
Now let’s throw some examples and pictures into play to get a better understanding.
📈 XAU/USD BULLISH Example:
1.First we Identify the direction of the market:
2.Now we set our fibs by looking for confirmations to get possible entry point:
Lets zoom in a bit:
Now that we have a break of the trendline we wait for confirmation and look for confluence:
Now we set our fibs from the last low to the last high:
This will act as our entry point for the trade.
3. Now we can look for our stop loss and take profit levels:
Stop Loss:
For the stop loss I like to use the fib levels 1.1 and 1.2 when I make an entry based upon the 0.618 level. These levels to me typically indicate that the trade idea is invalid once crossed because it will usually violate the prior confirmations
Take Profit:
For the take profit I like to use the Fib levels 0.236, 0, -0.27, and -0.618. This is based upon your personal risk tolerance and overall analysis. You can use 0.236 and 0 level as areas to take partial profits.
Re-Entry Point Using Elliott Waves as Confluence Example:
This is an example of how I used Elliott Waves to enter the trade again from the prior entry point. If you don’t know what Elliott Waves are I will link my other educational post so you can read up on it and have a better understanding my explanation to follow.
After seeing all of our prior confirmations I am now confident that our trend is still strongly bullish so I will mark my Waves and look for an entry point.
As we can see price dipped into the 0.38-0.5 Fib level and rejected it nicely which is also in confluence with the Elliott Wave Theory for the creation of wave 5 which is the last impulse leg before correction.
🔻 In a downtrend:
Same steps, but reverse the direction — draw from high to low and look to short the pullback.
XAU/USD Example:
As you can see the same basic principles applied for bearish movement as well.
⚠️ Pro Tips for Accuracy:
✅ Always use Fib in confluence with:
Market structure (higher highs/lows or lower highs/lows)
Key support/resistance zones
Volume or momentum indicators
Candle Patterns
Elliott Waves, etc.
❌ Don’t trade Fib levels blindly — they are zones, not guarantees.
📊 Use higher timeframes for cleaner levels (4H, Daily)
💡 Final Thought
Fibonacci retracement doesn’t predict the future — it reveals probability zones where price is likely to react.
When combined with structure and confirmation, it becomes one of the most reliable tools for new and experienced traders alike.
🔥 Drop a comment if this helped — or if you want a Part 2 where I break down Fibonacci Extensions and how to use them for take-profit targets.
💬 Tag or share with a beginner who needs to see this!
Understanding Elliott Wave Theory with BTC/USDIntroduction to Elliott Wave Theory:
Elliott Wave Theory is a popular method of technical analysis that seeks to predict the future price movement of financial markets. Developed by Ralph Nelson Elliott in the 1930s, the theory is based on the idea that market movements follow a repetitive pattern, driven by investor psychology.
At the core of Elliott’s theory is the idea that markets move in a 5-wave pattern in the direction of the trend, followed by a 3-wave corrective pattern. These waves can be seen on all timeframes and help traders identify potential entry and exit points in the market.
Key Concepts of Elliott Wave Theory:
1. Impulse Waves (The Trend)
2. These are the waves that move in the direction of the overall trend. They are labeled 1, 2, 3, 4, 5 and represent the price movement in the main direction of the market.
* Wave 1: The initial move up (or down in a bearish market). I like to mark up the first wave how I do my Fibs, from the point where price showed a major impulse.
* Wave 2: A correction of Wave 1 (it doesn’t go lower than the starting point of Wave 1).
* Wave 3: The longest and most powerful wave in the trend.
* Wave 4: A smaller correction in the direction of the trend.
* Wave 5: The final push in the direction of the trend, which can be shorter and weaker than Wave 3.
3. Corrective Waves (The Pullbacks)
4. After the five-wave impulse, the market enters a corrective phase, moving against the trend. This corrective phase is generally a 3-wave pattern, labeled A, B, C:
* Wave A: The initial correction, typically smaller than Wave 3.
* Wave B: A temporary move against the correction (it often confuses traders who think the trend has resumed).
* Wave C: The final move against the trend, usually the strongest and most aggressive.
How to Implement Elliott Wave on BTC/USD:
Let’s break down how you can apply the Elliott Wave Theory to BTC/USD using a simple example.
1. Identify the Trend
2. Start by identifying the current market trend for BTC/USD. Are we in an uptrend or downtrend? This will determine whether you’re looking for a 5-wave impulse up (bullish) or down (bearish).
3. Locate the Waves
4. Look for the five-wave structure in the trend direction. Once you identify a potential impulse move, label the waves accordingly:
* Wave 1: A new uptrend starts.
* Wave 2: A small pullback (usually less than the size of Wave 1).
* Wave 3: A significant surge in price, often the most volatile.
* Wave 4: A smaller pullback or consolidation.
* Wave 5: The final push higher, which might show signs of exhaustion.
5. Corrective Phase
6. After completing the 5-wave impulse, expect a corrective 3-wave pattern (A, B, C). These corrections typically last longer than expected and can often confuse traders.
* Wave A: Price starts to reverse.
* Wave B: A retracement that may confuse traders into thinking the trend is resuming.
* Wave C: A strong pullback that brings the price even lower.
7. Use Fibonacci Levels as confluence
8. One of the most powerful tools in Elliott Wave analysis is Fibonacci retracement levels. You can use these to predict potential levels where Wave 2 and Wave 4 could end, or where Wave C might complete the correction. Common retracement levels are 38.2%-50% for Wave 4, and 50-61.8% For Waves 2 and B but keep in mind, these wave can retrace up to 100% before the wave analysis becomes invalid. But ideally these points are where you look to make an entry.
Wave 2 Example:
This one hit the golden spot (0.5-0.618) perfectly and continued to push upward.
Wave B and C Example:
This example hit closer to the 0.786 level which is also a key level for retracement.
Wave 4 Example:
This one hit the golden spot (0.382-0.5) for Wave 4 perfectly before continue the bullish momentum.
I try to use the RED levels below (1.1 and 1.2) as my invalidation (Stop Loss) levels and the GREEN levels (-0.27 and -0.618) as my Take Profit levels. Depending on your goals you can also use Fib Levels 0.236 and 0 as partial Take Profit levels.
9. Confirm with Indicators
10. To validate your Elliott Wave counts, use other indicators like the RSI (Relative Strength Index), MACD, or Moving Averages. For example, a Wave 3 might occur when the RSI is above 50, indicating strength in the trend.
In this example you can see the RSI cross the 50 threshold and the 3rd Wave form.
Continuation after the Wave is complete:
Tips for Trading with Elliott Wave Theory:
* Stay Flexible: Elliott Wave Theory is not set in stone. If the market doesn’t follow the expected pattern, adjust your wave counts accordingly.
* Don’t Rely on One Timeframe: A 5-wave structure on one timeframe may be part of a larger wave pattern on a higher timeframe. Always analyze multiple timeframes.
* Wave Personality: Waves don’t always look the same as stated earlier. Wave 2 can retrace up to 100% of Wave 1 and Wave 4 should generally not overlap Wave 1 or this may invalidate the Wave structure.
* Risk Management: Always use proper risk management techniques. No theory is perfect, so make sure you have a stop-loss in place to manage your risk.
Conclusion: Using Elliott Wave Theory on BTC/USD:
The Elliott Wave Theory can be a powerful tool for analyzing and forecasting price movements. By identifying the 5-wave impulse and 3-wave corrective patterns, you can gain insights into potential market direction. Just remember to use it alongside other tools and indicators for confirmation, and don’t forget to manage your risk.
As you apply it to BTC/USD or any other asset, remember that the market doesn’t always follow the "ideal" patterns, and flexibility is key. Practice on different timeframes, refine your skills, and use the theory as a part of your overall trading strategy.
Final Thoughts:
If you're just starting, don't get discouraged if you miss a wave or two. Trading is a journey, and with patience and practice, you'll begin to spot these patterns more naturally. Whether you’re analyzing Bitcoin's price action or any other asset, Elliott Wave Theory can give you a deeper understanding of market psychology.
Good Luck and Happy Trading!

Mastering the RSI - How to use it in trading?What will be discussed?
- What is the RSI?
- RSI overbought
- RSI oversold
- RSI divergences
- How to use the RSI
- How to trade with the RSI
What is the RSI?
The Relative Strength Index (RSI) is a popular momentum oscillator used in technical analysis to measure the speed and change of price movements. Developed by J. Welles Wilder Jr., it ranges from 0 to 100 and helps traders evaluate whether a security is overbought or oversold. The RSI typically uses a 14-period timeframe and is calculated based on the average gains and losses over that period. A rising RSI suggests increasing buying momentum, while a falling RSI indicates growing selling pressure.
RSI overbought
When the RSI rises above 70, the asset is generally considered overbought. This condition indicates that the price may have risen too quickly and could be due for a correction or pullback. However, being overbought doesn't automatically mean a reversal will occur, it signals that bullish momentum is strong, and traders should be cautious of potential trend exhaustion.
RSI oversold
Conversely, an RSI reading below 30 is typically seen as a sign that the asset is oversold. This condition suggests the price may have fallen too sharply and could be primed for a rebound. Just like with the overbought condition, an oversold RSI doesn’t guarantee an immediate reversal but serves as a warning that bearish momentum may be overextended.
RSI divergences
Divergences occur when the RSI and the price of the asset move in opposite directions. A bullish divergence happens when the price makes a lower low, but the RSI forms a higher low, potentially signaling a reversal to the upside. A bearish divergence occurs when the price makes a higher high, but the RSI creates a lower high, possibly indicating a downward reversal. Divergences are often used to spot early signs of trend changes.
How to use the RSI?
To use the RSI effectively, traders typically look for overbought and oversold conditions to time entries and exits, combine it with other technical indicators for confirmation, and watch for divergences as a sign of potential reversals. RSI can also be adapted for different timeframes or strategies, depending on whether the trader is looking for short-term swings or long-term trend analysis. While it’s a powerful tool, RSI should not be used in isolation, it works best as part of a broader trading plan that considers market context and risk management.
How to trade with the RSI?
The RSI can be a powerful tool for identifying potential trade setups. When the price approaches a key support zone while the RSI remains in overbought territory, this may signal an early warning of a possible market reversal. However, rather than acting immediately, it's wise to wait for confirmation. A clear candlestick reversal pattern, such as a bullish engulfing candle or a pin bar, a provide stronger evidence that momentum is shifting. By combining RSI readings with price action and support levels, traders can improve the accuracy and timing of their entries.
Disclosure: I am part of Trade Nation's Influencer program and receive a monthly fee for using their TradingView charts in my analysis.
Thanks for your support.
- Make sure to follow me so you don't miss out on the next analysis!
- Drop a like and leave a comment!

A Follow up to: “Adjustments for Better Readings & VSA vs BTC"When a trend approaches its end, we typically observe the formation of a buying or selling climax. That was certainly the case during Wyckoff’s era. Everything he described—market manipulation, signals, footprints—remains relevant today. But you know what that also means: if it's out there, it’s old news.
Yes, this is still happening, but we need to acknowledge that this information is no longer exclusive. And when a method becomes well-known—especially among retail traders—it can be used against them. Wyckoff himself hinted at this: the manipulators can and do use these same technical patterns to deceive. His real message?
“Keep an open mind.”
📉 In our current BTC chart, we’re seeing a textbook example of potential manipulation. A selling climax is visible—normally a sign of trend exhaustion and a bullish reversal. But is that really the case here? Did the downtrend truly end?
On the 1-Hour timeframe, both the RSI and volume indicators suggest otherwise: a bearish continuation seems more likely.
🧱 We're also witnessing a real-time formation of a Double Top pattern, taking shape since June 6. Measured by body candle spreads (excluding wicks), we observe four touches within a key price rectangle. These align with a known candlestick pattern: the Tweezer Top, commonly associated with bearish reversals.
What’s more, all of this is happening within a supply zone—actually three marked zones on the chart. The most recent zone shows signs of offloading pressure, amplified by both the Double Top and bearish candlestick formations.
And I haven’t even touched on the rejection wicks or how bearish volume spikes are gaining strength. That’s where the principle of Effort vs. Result comes in—remember, nothing in the market is free.
📊 In line with our past two posts, note how price action (PA) shows equal highs while RSI diverges, reinforcing earlier signals. The signs are stacking up.
So, the critical question now is:
Are we heading below the $100.718 level for a confirmed Head & Shoulders pattern?
Or is this just a retest before another move?
If this way of reading the market resonates with you and you want to go deeper—whether it’s building confidence or spotting signals before they play out—I work with a small circle of traders sharing TA privately on a daily basis. Feel free to reach out.
Till next time be well and trade wisely!

Adjustments for Better ReadingsMany traders rely on technical indicators to identify opportunities for profit—that's the whole point of this game. Whether it’s scalping, day trading, swing trading, or shorting the market, most trading decisions are based on indicator readings—be it a single indicator or a combination of several.
But here’s the truth: not all traders truly understand what an indicator is. They don’t grasp its nature—let alone the fact that this nature can be adjusted.
Those who don’t understand how or why an indicator works often find themselves in stressful and uncomfortable situations. It’s no coincidence that we often hear the common phrase: “Only 1% of all traders succeed, while 80% blow their accounts, and the remaining 19% barely break even.”
Why? Because the elite traders understand something most don’t:
Whether an indicator is leading or lagging, it can be customized to behave differently across different timeframes.
These adjustments can be found in the settings section of every indicator.
Let’s take the Relative Strength Index (RSI), which I’ve mentioned in previous ideas. Some of you may have noticed that my RSI plot looks different from yours. That’s because I don’t use the default 14-period RSI, which averages out the last 14 candles.
RSI is naturally lagging by default—but that doesn’t mean it can’t be trusted. In fact, with the right adjustments, that lagging nature can become leading. Learn how to do this. Push yourself. Educate your mind. Master this, and you might just find yourself among the top 1%.
Markets react to signals—signals that are often hidden in plain sight, created by the big players who always leave behind footprints. This is the trader’s true skill: seeing the whole picture.
A good friend once told me: Be a detective.
Now let’s go to the chart.
We clearly see a bearish strength unfolding.
Not only is the 9-period RSI plot trending below the yellow 28-period Weighted Moving Average (WMA), but we also observe a healthy continuation of the downtrend, confirmed by the WMA itself.
Using a 9-period RSI gives faster signals, while the 28 WMA offers smoother confirmations. This combo is applied on the daily timeframe—but every timeframe has its own ideal settings.
Now, when the RSI plot trends above the WMA, this can act as a potential reversal signal or even a confirmation of a trend change, depending on the broader market structure and volume context. It's not just about the crossover—it’s about what follows next. That’s where the detective work begins.
What do we see today?
Looking solely at the daily timeframe, the downtrend seems far from over. But to analyze it professionally, we must wait for the candle of Friday, June 6th, 2025 to close.
Switching to the lower timeframes, we see something interesting—a sort of bullish dominance unfolding during this incomplete trading day. But the real question is: Is it actual dominance?
Let’s break it down:
We have a clearly formed Head & Shoulders pattern.
The bearish Marubozu candle from June 5th made a new lower low (LL).
But—it did not close below the key swing low at 100.718.
Therefore, the Head & Shoulders pattern is not confirmed—it hasn’t broken and closed below that swing level.
So what’s happening in the lower timeframes?
In the 4-hour timeframe, we’re seeing a real-time crossover above the WMA (though the session isn’t closed yet).
In the 1-hour timeframe, the crossover has already occurred.
Now, such a crossover—where the RSI plot moves above the WMA—can often act as an early signal for a reversal, or at the very least, indicate a strong pullback. But don’t take it at face value—context is king. This is why we pair it with other signals like divergence, price action, and volume behavior for confirmation.
Across the 4H, 3H, and 1H timeframes, we’re observing this bullish pullback, yet it’s accompanied by an RSI Hidden Bearish Divergence (see: Macro Noise vs Micro Truth: The Art of Hidden Divergences).
Is this pullback a true reversal?
According to Volume Spread Analysis (VSA) (read: VSA vs BTC: Into a Bearish Scenario or Not?), a new narrative is emerging—but not without contradiction.
Price is climbing, yes.
But bullish volume spikes are declining, supporting our RSI hidden divergence. This volume-price disagreement is a clue.
What will reveal the truth?
Today's closing candle.
If price action (PA) creates a higher high (HH) but RSI creates a lower high (LH) → Bearish Divergence
If RSI makes a HH but PA creates a LH → Hidden Bearish Divergence
And for those of you who truly understand market structure:
The 100.718 level was a buy opportunity to secure profits.
If you caught that—congratulations. You’ve done your homework.
Now, you can sit back, relaxed, and wait for the next signal.
The market is a breathing organism. If you’re in sync with it—you’ll feel it.
And for those who believe there’s more to learn—but are struggling to find answers—there’s no shame in asking questions.
Till next time, take care—and trade wisely.
P.S. RSI plot, WMA, candlestick patterns, and Volume Spread Analysis (VSA)—when combined and used properly—can become a powerful toolset. For those willing to go deeper, they’re more than enough.

Bullish Setup
Closed at 141.02 (21-05-2025)
Beautiful Bullish Divergence +
Inverse H&S in progress.
As mentioned earlier, 144 - 146 is
an immediate resistance; once crossed
& sustained, we may witness 152 - 155
& then 175 - 180.

GBP/USD Symmetrical Triangle Setup: Bullish Breakout?Here's an analysis based on the chart:
Key Observations :
1. **Bullish Triangle Pattern:**
- A symmetrical triangle or wedge is forming, suggesting potential consolidation before a breakout.
- The upward trendline indicates possible bullish momentum as price approaches a breakout point.
2. **Price Levels:**
- Resistance: 1.24860 (shown as the 1.13 Fibonacci extension level).
- Support: Around 1.24100, where price is currently hovering near the trendline.
3. **RSI (Relative Strength Index):**
- The RSI is above 50, which leans toward bullish momentum.
- Divergence may be forming as price action creates higher lows while RSI doesn't show the same strength.
4. **Candlestick Patterns:**
- Multiple rejections around support suggest buying pressure near the trendline.
Trading Implications:
1. **Bullish Breakout Setup:**
- If price breaks above 1.24860, it could signify a continuation to higher levels, potentially targeting a Fibonacci extension level beyond 1.25.
2. **Reversal or Bearish Setup:**
- If price fails to hold the ascending trendline, expect a move downward, potentially testing 1.23900 or lower.

XRP - Bull FlagXRP looks to break out soon. A channel (flag) formed after XRP's uptrend (flag pole), signaling a rally to resistance levels. The Relative Strength Index (RSI) is overbought, signaling a dip before a possible breakout. A dip in the upcoming days will follow the bull flag signal, with market price striking key resistance levels.
Chart - 12hr
Resistance - $2.90
Support - $1.96
F & G Index - 61 Greed

What Indicators Do Traders Use for Scalping? What Indicators Do Traders Use for Scalping?
Scalping is a fast-paced trading style where traders aim to take advantage of small price movements within short timeframes. Such traders often rely on technical indicators to make quick decisions. This article explores some of the most popular scalping indicators, providing insights into how they can help traders spot opportunities in fast-moving markets.
Understanding Scalping Indicators
As you know, scalping is a trading strategy where traders aim to take advantage of small price movements by executing numerous trades within short timeframes, often closing trades within a few minutes. This approach requires swift decision-making and precise timing.
Technical indicators are essential tools in this context, as they provide real-time data and insights into market trends, momentum, and volatility. Using these indicators, traders can identify optimal entry and exit points, potentially enhancing their ability to navigate the rapid pace of the market.
Below, we’ll break down five indicators for scalping. You’ll find these scalping indicators in MT4 and MT5, TradingView. Also, you can get started in seconds with FXOpen’s free TickTrader trading platform.
Moving Averages
Moving averages (MAs) are considered by some to be the best indicator for scalping, smoothing out price data to help identify trends by calculating the average price over a specific period. In scalping, where quick decisions are crucial, certain types of moving averages can be useful.
Exponential Moving Average (EMA)
Unlike the Simple Moving Average (SMA), which assigns equal weight to all data points, the EMA gives more significance to recent prices, making it more responsive to current market movements. This responsiveness is advantageous for scalpers. For instance, a 9-period EMA reacts swiftly to recent price changes, potentially providing timely signals for entry and exit points.
Hull Moving Average (HMA)
Developed by Alan Hull, the HMA further reduces lag and enhances smoothness compared to traditional moving averages. It achieves this by weighting recent prices more heavily and using a unique calculation method. The HMA's ability to closely follow price action while minimising lag makes it a valuable indicator for scalpers.
Applying Moving Averages in Scalping
- Crossover Strategy: Scalpers often use two EMAs of different lengths to identify potential trading opportunities. A common approach involves a fast EMA (e.g., 5-period) and a slow EMA (e.g., 15-period). When the fast EMA crosses above the slow EMA, it may indicate a bullish trend, suggesting a potential buying opportunity or a chance to close a short trade. Conversely, when the fast EMA crosses below the slow EMA, it may signal a bearish trend, indicating a potential selling opportunity or moment to close a long trade.
- Trend Confirmation: The EMA and HMA can be used to confirm trends identified by other indicators. For example, if the moving average is sloping upwards, it may confirm an uptrend, supporting decisions to enter long positions. If it's sloping downwards, it may confirm a downtrend, supporting decisions to enter short positions.
You can find these scalping indicators in TradingView and FXOpen’s TickTrader platform.
Relative Strength Index (RSI)
The Relative Strength Index (RSI) is a well-known scalping indicator that measures the speed and change of price movements, oscillating between 0 and 100. Traditionally, an RSI above 70 indicates overbought conditions, while below 30 suggests oversold conditions.
In scalping, traders often adjust the RSI from its typical length of 14 to shorter periods, such as 7 or 9, to capture rapid price swings occurring over minutes. This adjustment makes the RSI more sensitive to recent price changes, providing timely signals for quick trades.
Applying RSI in Scalping
- Overbought/Oversold Levels: When the RSI moves beyond 70 or drops below 30, traders watch for potential reversal points. However, scalpers may focus on the RSI’s movement back into the 30-70 range as an early sign of momentum shifting.
- Divergences: Scalpers also look for divergence between price movement and the RSI. For example, if the price reaches a new high but the RSI does not, it may signal a weakening trend and possible reversal. This divergence can be an effective tool for anticipating quick market shifts.
- Midpoint (50 Level): The 50 level serves as a midpoint, indicating the balance between gains and losses. An RSI crossing above 50 may suggest bullish momentum, while dropping below 50 can indicate bearish momentum. Scalpers use this midpoint to assess the prevailing market trend.
Bollinger Bands
Bollinger Bands are a technical analysis tool comprising three lines: a simple moving average (SMA) in the middle, with upper and lower bands set at a specified number of standard deviations from the SMA. These bands expand and contract based on market volatility, providing a visual representation of price fluctuations.
In scalping, traders often adjust Bollinger Bands to shorter timeframes, such as 1-minute or 5-minute charts, to capture quick price movements. A common approach involves setting the SMA period to 7-10 and the standard deviation to 1.5-2, potentially enhancing sensitivity to short-term market changes.
Applying Bollinger Bands in Scalping:
- Bollinger Squeeze: When the bands contract, indicating low volatility, it often precedes significant price movements. Scalpers watch for a breakout above or below the SMA to identify potential trading opportunities.
- Reversal: Price breaching the upper band may suggest overbought conditions, while below the lower band may indicate oversold conditions. Scalpers use these signals to anticipate potential price reversals.
Stochastic Oscillator
The Stochastic Oscillator is a momentum indicator that compares an asset’s closing price to its price range over a specific period, typically 14. It includes the %K line, the current closing price relative to the range, and the %D line, a moving average of %K. The scale runs from 0 to 100, where readings over 80 suggest overbought levels, and those under 20 point to oversold levels.
In scalping, traders may adjust the Stochastic Oscillator to shorter settings, such as 5,3,3, to increase sensitivity to rapid price movements. This adjustment can help in capturing short-term market fluctuations.
Applying the Stochastic Oscillator in Scalping:
- Overbought and Oversold Conditions: When the %K line crosses the %D line in the overbought (above 80) or oversold (below 20) zones, it can signal a potential reversal. Scalpers use these crossovers as quick alerts for shifts in momentum, helping them to act swiftly in volatile markets.
- Crossovers: Besides extreme conditions, traders also monitor crossovers between %K and %D. A %K line crossing above %D from a lower level can suggest an upward move, while a downward crossover may hint at a short-term price decline.
- Divergence: If the price makes a new high/low but the Stochastic Oscillator does not, it may signal a weakening trend, indicating a potential reversal.
Moving Average Convergence Divergence (MACD)
The Moving Average Convergence Divergence (MACD) is considered one of the top forex indicators for scalping. It’s a momentum indicator that reflects the relationship between two moving averages. It comprises the MACD line (the difference between the 12-period and 26-period exponential moving averages), the signal line (a 9-period EMA of the MACD line), and a histogram, which illustrates the gap between the two lines.
Scalpers prefer to adjust these settings to 3, 10, and 16, respectively, to make the MACD more responsive to rapid price movements.
Applying MACD in Scalping:
- Crossovers: When the MACD line crosses above the signal line, it may indicate bullish momentum; a crossover below suggests bearish momentum. Scalpers monitor these crossovers to identify potential entry and exit points.
- Histogram Analysis: The histogram represents the difference between the MACD and signal lines. An expanding histogram indicates strengthening momentum, while a contracting histogram reflects weakening momentum. Scalpers use these changes to gauge the intensity of price movements.
- Divergences: A divergence occurs when the price moves in one direction while the MACD line moves in the opposite. For example, if the price reaches a new low but the MACD does not, it may reflect a potential upward reversal. Scalpers watch for such divergences to anticipate shifts in market direction.
Combining Indicators for Scalping Strategies
Combining multiple indicators can enhance scalping strategies by providing a more comprehensive view of market conditions. Each indicator offers unique insights, and their combined use can help filter out false signals and confirm trading opportunities. Here are some pairings:
- EMA and RSI: Utilising the Exponential Moving Average to identify trend direction alongside the Relative Strength Index to gauge momentum can help traders confirm the strength of a trend before making decisions. For instance, if the EMA indicates an uptrend and the RSI is above 50, it may suggest strong bullish momentum.
- Bollinger Bands and Stochastic Oscillator: Bollinger Bands measure volatility, while the Stochastic Oscillator identifies overbought or oversold conditions. When prices touch the upper or lower bands and the Stochastic Oscillator reflects overbought or oversold conditions, it may indicate potential reversal points.
- MACD and RSI: The Moving Average Convergence Divergence (MACD) highlights momentum changes, and the RSI indicates overbought and oversold conditions. Using them together can help confirm potential entry or exit points. For example, if the MACD shows bullish momentum and the RSI is rising but not yet overbought, it may signal a buying opportunity.
Common Challenges When Using Indicators in Scalping
Scalping with indicators offers valuable insights, but there are some challenges traders should be aware of:
- False Signals: Rapid market movements can trigger misleading signals, causing traders to act prematurely.
- Overtrading: Relying too heavily on short-term indicators can lead to excessive trades, increasing transaction costs.
- Market Noise: High volatility and frequent price fluctuations can make it difficult to distinguish genuine trends from random market "noise."
- Lagging Indicators: Some indicators may react too slowly, causing traders to miss opportunities.
The Bottom Line
Scalping requires quick decisions and the right tools, and indicators like the EMA, RSI, and MACD can help traders navigate fast-moving markets. Found the best scalping indicator that suits your style? Open an FXOpen account to access four advanced trading platforms and start building your scalping strategy today with low-cost, high-speed trading conditions.
FAQ
What Is the 1-Minute Scalp Strategy?
The 1-minute scalp strategy involves making rapid trades on a 1-minute chart. Traders look for small price movements and enter multiple trades within a short period, often using scalp trading indicators like the EMA or RSI for quick signals.
What Is the 5-Minute Scalping Strategy?
The 5-minute scalping strategy focuses on capturing short-term price movements on a 5-minute chart. Traders typically combine trend and momentum indicators, like the MACD and Bollinger Bands, to make fast, informed decisions.
Which Stocks Are Good for Scalping?
The choice depends on the trader’s risk tolerance, trading approach, experience, and toolkit. However, according to theory, stocks with high liquidity, tight spreads, and significant daily volume are good for scalping. Popular choices include tech giants like Apple (AAPL) and Tesla (TSLA), as they offer frequent price fluctuations. But at the same time, they bear higher risks.
What Is the Best EMA for Scalping?
There is no best exponential moving average for scalping. However, traders often use a pair of EMAs, such as a 9- or 5-period and 21- or 15-period, to quickly respond to price changes in scalping. These EMAs help identify trend direction and momentum.
How Can You Use RSI for Scalping?
In scalping, the RSI is often set to shorter periods, like 7 or 9, to catch signals quickly. Traders watch for the RSI to cross key levels (30 or 70) and form a divergence with a price chart to spot potential reversals.
This article represents the opinion of the Companies operating under the FXOpen brand only. It is not to be construed as an offer, solicitation, or recommendation with respect to products and services provided by the Companies operating under the FXOpen brand, nor is it to be considered financial advice

What Those Peaks and Valleys on Your Chart Are Telling You (RSI)Hello, Traders! 👋🏻
Have you ever noticed those peaks and valleys at the bottom of your trading charts? Like tiny mountains rising and falling, they seem to reflect the market’s heartbeat 🩺. But what do they actually mean? Think of them as the market’s thermometer — showing you when it’s overheated or cooling down. This tool is none other than the Relative Strength Index (RSI).
RSI meaning? RSI is one of the simplest indicators traders use to time their moves. It tells you when an asset is overbought or oversold, helping you spot potential reversals and entry points.
In this article, we’ll break down how RSI works, why it’s such a powerful tool, and how you can use it to read the market.
What Is RSI?
What is the Relative Strength Index/RSI? RSI isn’t just a random line on your chart. It’s a momentum oscillator that measures how quickly prices are moving up or down. Think of it as a score for how strong the market’s mood is right now. Let’s dive into how to use the RSI indicator effectively.
1. Overbought and Oversold Levels. The most common way to use RSI trading is to look for these levels.
If RSI rises above 70, ➡️ the market might be overbought . This could be a good time to think about locking in profits or avoiding new buys.
If RSI falls below 30, ➡️the market might be oversold . This could signal a buying opportunity.
But don’t jump in blindly. These levels are just a starting point. Always check for confirmation from other indicators or chart patterns.
2. Spotting Divergences. Divergences happen when the RSI and the price move in opposite directions—a powerful signal that something is about to change.
Bullish Divergence: The price makes a lower low, but RSI makes a higher low. This suggests that selling pressure is weakening, and a reversal to the upside may be coming.
Bearish Divergence: The price makes a higher high, but the RSI makes a lower high. This indicates that buying momentum is fading, and a downturn could be near.
Divergences often occur before major reversals, giving you a chance to prepare for your next move.
Why RSI Deserves a Place in Your Toolkit
The Relative Strength Index is more than just a line on your chart—it’s a window 🪟 into the market’s psychology. It helps you see when traders are getting too greedy or too fearful, giving you the edge to act decisively.
But remember, no indicator works in isolation. Pair RSI with other tools, adapt it to different market conditions, and always trade with a plan.
So, traders, how do you use RSI in your strategy? Do you rely on it for entries and exits, or do you combine it with other tools? Let’s discuss it!

1-Minute Scalping Trading Strategies With Examples1-Minute Scalping Trading Strategies With Examples
Scalping is a popular trading style capitalising on rapid, small price movements within minutes. 1-minute scalping strategies are often used by traders but require precise execution and solid understanding of technical indicators. This article explores four 1-min scalping strategies, detailing the indicators used alongside specific entries and exits.
Understanding 1-Minute Scalping
1-minute scalping is a fast-paced trading style focusing on taking advantage of small price movements within a minute timeframe. Traders using this approach rely on 1-minute charts to make quick, multiple trades throughout the trading session. The primary goal is to accumulate potential small gains that might add up to larger returns over time.
A scalp trading strategy requires a solid understanding of technical analysis and market conditions. Scalpers typically use indicators, price action patterns, and trend analysis to identify short-term market movements and potential entry and exit points. The rapid nature of 1-minute scalping demands precision and discipline, as even a slight delay can impact the trade outcome.
One of the key advantages of 1-minute scalping is the ability to generate frequent trading opportunities, which can be particularly appealing during volatile market conditions. However, it also comes with higher risks due to the speed and frequency of trades, meaning risk management plays a significant role.
Scalpers must also be aware of transaction costs, as frequent trading can lead to significant fees, which can erode potential returns. Choosing a broker with low commissions, tight spreads, and fast execution speeds is essential to maximise a scalping forex strategy’s potential. FXOpen provides an ideal environment for scalping trading strategies, with commissions from $1.50 per lot, spreads from 0.0 pips, and ultra-fast execution. Open an account!
Four 1-Minute Scalping Strategies
Now, let’s take a closer look at four 1-minute trading strategies. To apply these strategies, see how they work in practice, and access each of these 1-minute scalping indicators, consider following along in FXOpen’s free TickTrader trading platform.
Strategy 1: VWAP + MACD
Indicators Used
- VWAP (Volume Weighted Average Price): VWAP calculates the average price a security has traded at throughout the day, based on both volume and price. It helps traders understand the trend and identify potential support and resistance levels.
- MACD (Moving Average Convergence Divergence): MACD is an indicator that visualises the relationship between two moving averages. MACD settings for a 1-minute chart are standard: the MACD line is derived from the difference between the 12-period and 26-period exponential moving averages (EMA), while the signal line is a 9-period EMA of the MACD line.
VWAP and MACD work well together by providing both trend and momentum analysis. VWAP helps identify the overall trend and significant price levels, while MACD offers insights into momentum changes. This combination can help traders determine entries by confirming trends and potential reversals.
Entry
- Traders typically look for the price to close through the VWAP, with the MACD turning from positive to negative or vice versa. This coincides with the signal line crossing over the MACD line.
- Alternatively, another common entry point is when the price uses the VWAP as a level of support or resistance, confirmed by the MACD turning from positive to negative or vice versa.
These triggers will likely occur within a few candles of each other, typically within 4 or 5 candles.
Stop Loss
- Stop losses are often set just beyond a recent high or low swing point, which helps potentially protect against losses if the market moves unexpectedly.
Take Profit
- Traders commonly take profits when the signal line crosses the MACD line in the opposite direction, and the histogram switches from positive to negative or vice versa. This approach allows traders to take advantage of momentum shifts and potentially lock in gains as the trend changes.
- However, some may prefer to exit at a significant support or resistance level in order to maximise potential gains.
Strategy 2: Keltner Channels + RSI
Indicators Used
- Keltner Channels: A volatility-based envelope set above and below an exponential moving average. The channels are typically set to two average true range (ATR) values away from the EMA. They help identify overbought and oversold conditions and potential breakouts.
- RSI (Relative Strength Index): A momentum oscillator that gauges the rate and extent of price changes. It ranges between 0 and 100, where readings above 70 signal overbought conditions, and readings below 30 indicate oversold conditions. RSI can also indicate bullishness when it crosses above 50 and vice versa.
The Keltner Channels and RSI strategy leverages volatility and momentum to identify effective trading opportunities. By combining the channels, which offer insights into breakouts, with the RSI, which gauges momentum, traders can uncover trading opportunities on the 1-minute chart.
Entry
- Traders often look for two or more closes outside of the Keltner Channel and ideally strong and/or consecutive green (bullish) or red (bearish) candles.
- This is confirmed by the RSI recently breaking above 50 for bullish signals or below 50 for bearish signals.
The combination of strong price action and momentum change helps traders identify potential trend continuations.
Stop Loss
- Stop losses are commonly set beyond the opposite side of the Keltner Channel to potentially protect against adverse price movements.
- For a higher risk-reward ratio, traders might place stop losses beyond a nearby swing candle.
Take Profit
- Traders typically take profits when the price crosses back beyond the Keltner Channel's midpoint or reaches the opposite side of the channel, indicating a potential exhaustion of the current move.
- Alternatively, profits may be taken when RSI moves beyond 70 (overbought) or below 30 (oversold), signalling potential reversals in price direction.
Strategy 3: ALMA + Stochastic
Indicators Used
- ALMA (Arnaud Legoux Moving Average): ALMA is a moving average that aims to smooth price data while reducing lag. The settings used are 21 for the window size, 0.85 for the offset, and 6 for the sigma. This combination helps in identifying the trend with greater precision.
- Stochastic Oscillator: The Stochastic measures the location of the close relative to the high-low range over a set period. Settings of 21, 1, 3 are used to capture momentum and potential reversal points. A figure above 80 signals overbought conditions, while below 20 indicates the opposite.
Combining ALMA with the Stochastic Oscillator allows traders to identify potential reversals in trends. ALMA provides a smoothed view of the price trend, while the Stochastic Oscillator offers momentum-based signals, helping to confirm the strength of a move.
Entry
- Traders look for the price to close through the ALMA, ideally with a strong close, which suggests a potential trend change.
- This is confirmed by the Stochastic Oscillator crossing below 80 for a bearish signal or above 20 for a bullish signal, indicating momentum alignment with the trend.
Note that price may fluctuate above and below the ALMA in ranging conditions and produce false signals.
Stop Loss
- Stop losses are typically set beyond the nearest swing point, which helps to potentially protect against adverse price movements.
Take Profit
- Traders typically take profits when the Stochastic reaches the opposite territory (e.g., from above 80 to below 20 for a bearish move), indicating a potential exhaustion of the current trend.
- Alternatively, profits may be taken at identified areas of support or resistance, where price action historically reacts, providing a logical exit point.
Strategy 4: RSI + Bollinger Bands
Indicators Used
- RSI (Relative Strength Index): For this strategy, RSI setting for a 1-minute chart is a length of 4, with overbought and oversold boundaries at 80 and 20, respectively. These RSI settings for the 1-minute chart help in identifying short-term overbought and oversold conditions.
- Bollinger Bands: Bollinger Bands settings for a 1-minute chart are a 20-period simple moving average (middle band) and two outer bands set at a standard deviation level of 2 from the middle band. They help identify periods of high and low volatility as well as potential reversal points.
The combination of RSI and Bollinger Bands allows traders to identify potential short-term reversals in the market. The Bollinger Bands provide a dynamic range for price action, while the RSI helps confirm overbought or oversold conditions, improving the accuracy of entry and exit points.
Entry
- Traders often enter when the RSI crosses below 80 from above or above 20 from below, signalling an exit from potential overbought or oversold conditions.
- This entry is confirmed when the price is also touching or breaching the Bollinger Band, indicating the likelihood of a short-term reversal.
Stop Loss
- Stop losses are typically set beyond a nearby swing point or just outside the Bollinger Band, providing potential protection against significant adverse price movements and giving the trade room to develop.
Take Profit
- Traders commonly take profits when the price touches the opposing Bollinger Band, suggesting a potential end to the current price move.
- Alternatively, some may take profits when the RSI crosses into the opposing overbought or oversold territory, indicating a shift in momentum.
The Bottom Line
Mastering a 1-minute scalping strategy can potentially enhance your trading performance. To take advantage of these techniques, consider opening an FXOpen account. As a regulated broker, FXOpen offers access to over 600 markets for scalping, supported by commissions as low as $1.50 and spreads from 0.0 pips. With the right tools and strategies, you can navigate today’s fast-paced trading environment effectively.
FAQ
What Is the 1-Minute Timeframe Trading Strategy?
The 1-minute timeframe trading strategy involves making multiple trades within a single minute, aiming to capture small price movements. Traders use a 1-min scalping strategy to identify quick trading opportunities and rely heavily on technical indicators for entry and exit points.
Which Indicator Is Best for 1-Minute Scalping?
There is no single best 1-minute scalping strategy indicator; it comes down to preference and experience. However, popular choices include the Moving Average Convergence Divergence (MACD), Relative Strength Index (RSI), Bollinger Bands, and the Volume Weighted Average Price (VWAP). Combining several indicators can potentially provide more reliable signals.
What Is the Best Timeframe for Scalping Crypto*?
The best timeframe for scalping crypto* depends on the trader's preference and strategy. While a 1-minute crypto* scalping strategy offers rapid trades and numerous opportunities, some traders prefer slightly longer frames like the 5-minute or 15-minute charts to balance speed and cryptocurrency* market noise.
What Is the Stochastic Setting for 1-Minute Scalping?
For 1-minute scalping, the Stochastic Oscillator is typically set to the standard settings of 14, 1, 3. These settings help capture short-term momentum changes, providing timely signals for entry and exit points. Adjustments can be made based on the trader's specific strategy and market conditions.
*At FXOpen UK, Cryptocurrency CFDs are only available for trading by those clients categorised as Professional clients under FCA Rules. They are not available for trading by Retail clients.
This article represents the opinion of the Companies operating under the FXOpen brand only. It is not to be construed as an offer, solicitation, or recommendation with respect to products and services provided by the Companies operating under the FXOpen brand, nor is it to be considered financial advice.

S&P500 Weekly - Toppy SituationDivergence between price and the RSI oscillator, and between price and the MACD oscillator indicate that the current situation going into 2025 is a toppy one. One might consider watching these oscillators and being on the lookout for a shorting opportunity or a bullish resolution of the divergence (less likely) through Q1.

How Can You Use a Break and Retest Strategy in Trading?How Can You Use a Break and Retest Strategy in Trading?
Trading strategies help traders navigate the financial markets with greater confidence. One such approach is the break and retest strategy, which focuses on key support and resistance levels. This article explores the break and retest strategy in detail, providing insights and practical examples to help traders apply it in their trading activities.
Understanding the Break and Retest Strategy
The break and retest strategy is popular among traders who aim to capitalise on clear market movements. At its core, this strategy revolves around identifying key support and resistance levels on a price chart.
Here’s how it works: When the price breaks through a support or resistance level, it signals a potential shift in market sentiment. For example, if a stock breaks above a resistance level, it suggests increasing buying interest. Traders then watch for the price to return to this newly broken level—known as a retest in trading. During the retest, the former resistance now acts as support, providing a potentially more attractive entry point for traders looking to join the trend.
This strategy aligns well with trending markets, where prices move consistently in one direction. It allows traders to take advantage of momentum while managing their entries potentially more effectively.
The Mechanics of Break and Retest Trading
Implementing the break and retest strategy involves a clear sequence of steps that traders follow to identify and act on potential market moves. Here’s a breakdown of how this strategy typically operates:
1. Identifying Key Levels
Traders begin by pinpointing significant support and resistance levels on their charts. Accurate identification is crucial, as these levels form the foundation of the strategy.
2. Monitoring for a Breakout
Once the key levels are established, traders watch for the price to break through one of these barriers, in line with a broader trend. A breakout occurs when the price moves decisively above resistance or below support, often accompanied by increased trading volume. This surge in volume indicates stronger market interest and can validate the breakout’s legitimacy.
3. Waiting for the Retest
After the breakout, the price typically retraces to test the broken level. For instance, if the price breaks above a resistance level, it may pull back to that same level, which now acts as support. This retest phase is critical as it offers a second confirmation of the breakout’s strength.
4. Confirming the Retest
During the retest, traders look for confirmation signals to ensure the breakout is genuine. These signals can include specific candlestick patterns, such as pin bars or engulfing candles, and continued high trading volume. Successful confirmation suggests that the new support or resistance level will hold, increasing the likelihood of a sustained trend.
5. Entering the Trade
With confirmation in place, traders often enter the market, aiming to ride the new trend. They may set stop-loss orders slightly below the new support (in the case of a breakout to the upside) or the new resistance (in case of a breakout to the downside) to manage potential risks.
6. Managing the Trade
Effective trade management involves setting target levels based on previous price action and adjusting stop-loss orders as the trade progresses. This helps to lock in potential returns and potentially protect against unexpected market reversals.
Break and Retest Example Strategy
Consider this EURUSD 15-minute chart, which displays a clear bearish trend. This trend is highlighted by the 50-period Exponential Moving Average (EMA) sloping downward, with the price generally staying below it. Recently, the price broke below a key support level on higher-than-average volume, signalling a potential opportunity for traders to apply the break and retest strategy.
In this scenario, there are two support levels to monitor. The first is a more significant support level. Trading at this level can allow traders to enter the market quickly, though it comes with a less favourable risk-reward ratio.
The second support level is found within the recent brief retracement. This level offers a better risk-reward ratio, but there's a chance the price may not retrace deeply enough, potentially causing traders to miss the trade.
The entry point is identified by a candle with a wick longer than its body (a pin-bar on the 30m chart), indicating rejection of higher prices as the market retests the second broken support level. Once this candle closes, traders can enter a market order.
Stop losses would typically be placed either above the last major swing high or above the 50-period EMA, depending on individual risk tolerance. Take-profit targets could be set at a 1:3 risk-reward ratio or at the next significant support level, where a price reversal may be anticipated.
Improving the Break and Retest Strategy
Enhancing the break and retest strategy involves integrating additional tools and techniques to refine trade decisions. Here are several methods to consider:
1. Incorporating Additional Indicators
Using break and retest indicators like the Relative Strength Index (RSI) or the Moving Average Convergence Divergence (MACD) can provide valuable insights. For instance, an RSI crossing below 70 during a bearish breakout may indicate weakening momentum, supporting the retest. Similarly, the MACD crossing above its signal line or the MACD histogram rising above 0 can confirm the uptrend’s strength, aiding in more precise entry points.
Explore these indicators and more than 1,200+ trading tools in FXOpen’s free TickTrader trading platform.
2. Multi-Timeframe Analysis
Examining charts across different timeframes helps in gaining a broader market perspective. A breakout observed on a 4-hour chart gains additional confirmation when a strong trend is also visible on a daily chart. This alignment across timeframes increases the reliability of the trade setup.
3. Utilising Fibonacci Retracements
After a breakout, prices often retrace deeper into the previous high-low range—not always to the most extreme point. Applying Fibonacci retracements to the high/low of the breakout (high in a bearish breakout and low in a bullish scenario) and the new low or high can help identify optimal retest points, particularly at the 38.2%, 50%, and 61.8% levels. These levels typically offer better risk-reward ratios compared to the extreme points.
4. Incorporating Fundamental Analysis
Supporting technical breakouts with fundamental factors, such as economic reports or news events, strengthens the strategy. For example, a breakout aligned with positive economic data may have a higher probability of sustaining the new trend, providing traders with greater confidence in their decisions.
Advantages of the Break and Retest Strategy
The break and retest strategy offers several advantages that can enhance a trader’s approach to the markets:
- Increased Confidence through Confirmation: The retest serves as an additional validation of the breakout, boosting trader confidence in their entry decision and reducing hesitation.
- Better Risk Management: Setting stop-loss orders based on the retest level provides a clear risk boundary. This structured approach aids in potentially managing losses.
- Alignment with Market Trends: This strategy naturally aligns trades with the prevailing market trend. By trading in the direction of the breakout, traders can take advantage of sustained movements.
- Versatility Across Markets: The breakout and retest strategy can be applied to various financial instruments, including forex, stocks, and commodities. Its adaptability makes it a valuable tool in diverse trading environments.
- Scalability and Flexibility: This strategy can be adapted to different timeframes and trading styles, making it suitable for both short-term and long-term traders seeking to implement a consistent approach.
Potential Challenges and Considerations
While the break and retest strategy can be a powerful tool, traders may face several challenges when implementing it:
- False Breakouts: Not every breakout leads to a sustained trend. Sometimes, the price moves beyond a support or resistance level only to reverse shortly after. Recognising these false signals is crucial to avoid entering trades that may quickly turn against expectations.
- Market Conditions: According to theory, this strategy performs best in trending markets. In sideways or highly volatile environments, breakouts can be less reliable, making it harder to distinguish genuine opportunities from random price movements.
- Timing the Retest: Accurately determining when the price will retest the broken level can be challenging. Entering too early may expose traders to unnecessary risk, while waiting too long might result in missed opportunities if the retest doesn't occur as anticipated.
- Reliance on Confirmation Signals: While additional indicators like RSI or MACD can enhance the strategy, over-reliance on these tools can complicate decision-making. Traders need to balance multiple signals without becoming overwhelmed or confused.
- Emotional Discipline: Maintaining discipline during retests is essential. Traders might feel pressured to act quickly if the market moves unexpectedly, leading to impulsive decisions that deviate from their trading plan.
The Bottom Line
The break and retest strategy offers a structured approach to navigating market movements, combining precise entry points with effective risk management. By understanding and applying this method, traders can potentially enhance their trading decisions and align with prevailing trends. To put this strategy into practice across more than 700 markets, consider opening an FXOpen account and gain access to four advanced trading platforms, low trading costs, and rapid execution speeds.
FAQ
What Is a Retest in Trading?
A retest occurs when the price returns to a broken support or resistance level after an initial breakout. It serves to confirm the strength of the breakout, helping traders decide whether the new trend will continue or if the breakout was false.
What Is the Break and Retest Strategy?
The break and retest strategy involves identifying a breakout of a key support or resistance level and then waiting for the price to return to that level. Traders use this retest as a confirmation to enter the market, aiming to follow the new trend with reduced risk.
What Is the Win Rate of the Break and Retest Strategy?
The win rate of the break and retest strategy varies depending on market conditions and how the strategy is applied. Consistent application and effective risk management are crucial for achieving better results.
How Many Times Should I Backtest My Strategy?
Backtesting should be done extensively across different market conditions and timeframes. According to theory, traders need to test a strategy on at least 100 trades to ensure its reliability and to understand how it performs in various scenarios.
Does the Market Always Retest?
No, the market does not always retest broken levels. While retests are common, they are not guaranteed. Traders should use additional confirmation signals and be prepared for both possibilities when applying the break and retest strategy.
This article represents the opinion of the Companies operating under the FXOpen brand only. It is not to be construed as an offer, solicitation, or recommendation with respect to products and services provided by the Companies operating under the FXOpen brand, nor is it to be considered financial advice.

What Are Leading Trading Indicators, and How Can You Use ThemWhat Are Leading Trading Indicators, and How Can You Use Them in Trading?
Leading indicators are essential tools for traders aiming to analyse market movements. This article explains what leading indicators are, how they work, and their practical application across different asset classes. Read on to discover how tools like RSI, Stochastic Oscillator, On-balance Volume, and Fibonacci retracements can enhance your trading strategy.
What Are Leading Technical Indicators?
Technical indicators are divided into leading and lagging. Leading indicators in trading are tools used to identify potential price movements before they occur. Lagging indicators confirm trends after they begin, helping traders validate price movements. The difference between leading and lagging indicators is that leading indicators aim to give traders an edge by signalling when a new trend or reversal might be on the horizon while lagging indicators confirm trends after they've developed.
Leading trading indicators work by analysing price data to identify patterns or extremes in buying and selling behaviour. For instance, popular leading indicators like the Relative Strength Index (RSI) and the Stochastic Oscillator measure momentum in a market. These indicators help traders spot overbought or oversold conditions, where RSI tracks recent price movements relative to historical performance, while the Stochastic Oscillator compares a security's closing price to its price range over a set period.
However, it’s important to note that leading indicators can produce false signals, meaning they may suggest a price move that doesn’t materialise. Because of this, traders often combine them with other technical analysis tools, such as support and resistance levels, or use them alongside lagging indicators to validate the signals they receive.
Types of Leading Indicators in Trading
Leading indicators are divided into various types, each serving a unique role in analysing potential market movements. Three common types include momentum indicators, oscillators, and volume indicators:
- Momentum Indicators: These track the speed or rate of price changes. They are used to assess the strength of a trend and determine potential reversals when the momentum slows. Momentum indicators help traders when an asset is overbought or oversold.
- Oscillators: These indicators fluctuate between fixed values (usually 0 and 100) to reflect the market’s current momentum. They help traders pinpoint potential reversals by highlighting when an asset is overbought or oversold. Oscillators are particularly useful in range-bound markets where price movement is confined within support and resistance levels.
- Volume Indicators: These focus on the amount of trading activity, rather than price movement. By analysing the flow of volume in or out of an asset, traders can gauge the strength behind price movements. Increasing volume in the direction of a trend often confirms its continuation, while the divergence between volume and price can indicate potential reversals.
Below, we’ll take a look at a list of leading indicators. If you’d like to explore these indicators alongside dozens more, head over to FXOpen’s free TickTrader trading platform.
Relative Strength Index (RSI)
The Relative Strength Index (RSI) is one of the most popular leading indicators examples. RSI is a momentum oscillator that helps traders evaluate the strength of an asset’s price movements. Developed by J. Welles Wilder, it measures the speed and change of price actions over a set period—typically 14 candles—on a scale from 0 to 100.
The primary signals RSI produces revolve around overbought and oversold conditions. When the indicator breaks above 70, it suggests that an asset may be overbought, reflecting the potential for a reversal or correction. Conversely, when RSI falls below 30, it signals that an asset may be oversold, which can indicate a potential recovery. These thresholds provide traders with insight into whether the price has moved too far in one direction and is poised for a change.
RSI can also highlight trend reversals through divergence. If the price of an asset continues to rise while the RSI drops, it indicates bearish divergence, signalling potential weakening momentum. On the other hand, bullish divergence occurs when the price falls, but the RSI rises, suggesting that the downward trend may be losing strength.
Another useful RSI signal is when it crosses the 50-level. In an uptrend, RSI remaining above 50 can confirm momentum, while in a downtrend, staying below 50 reinforces bearish sentiment.
However, RSI is not foolproof. During a strong trend, the indicator can signal overbought or oversold for a long while and lead to false signals. This is why it’s often paired with other indicators to confirm signals.
Stochastic Oscillator
The Stochastic Oscillator is a momentum-based indicator that assesses the relationship between an asset's closing price and its price range over a specific number of periods, typically 14. It consists of two lines: the %K line, the primary line, and the %D line, which is a moving average of %K, providing smoother signals.
This oscillator ranges from 0 to 100, with readings above 80 indicating overbought conditions and those below 20 signalling oversold conditions. Traders utilise these signals to determine potential reversals in price. For example, when the oscillator rises above 80 and then drops below it, a potential sell signal is generated. Conversely, when it falls below 20 and climbs back above, it might indicate a buy opportunity.
The Stochastic Oscillator also provides crossover signals, where the %K line crosses above or below the %D line. A bullish crossover occurs when %K rises above %D, indicating that upward momentum may be increasing. A bearish crossover happens when %K falls below %D, suggesting that momentum is shifting downward.
In addition to overbought/oversold and crossovers, the Stochastic Oscillator can identify divergence, which signals potential trend reversals. A bullish divergence occurs when the price makes a lower low, but the oscillator shows a higher low, indicating a weakening downward momentum. On the other hand, a bearish divergence happens when the price makes a higher high, but the oscillator makes a lower high, suggesting the uptrend might be losing steam.
While the Stochastic Oscillator can be powerful in range-bound markets, it can be prone to false signals in trending markets.
On-Balance Volume (OBV)
On-Balance Volume (OBV) is an indicator that tracks the flow of trading volume to assess whether buying or selling pressure is dominating the market. It was introduced by Joseph Granville in 1963, and its primary concept is that volume precedes price movements. This makes OBV a useful tool for analysing potential trend reversals. While the absolute value of OBV is not crucial, its direction over time provides insight into the market’s underlying sentiment.
OBV offers several key signals:
- Trend Direction: A rising OBV supports an upward price trend, indicating strong buying pressure, while a falling OBV reflects a downtrend with selling pressure.
- Divergence: Traders use OBV to identify a divergence between price and volume. If the price is making new highs while OBV is falling, it suggests a weakening trend, potentially signalling a reversal. Conversely, rising OBV with falling prices can hint at a potential bullish reversal.
- Breakouts: OBV can also be used to spot potential breakouts. For instance, if OBV rises while prices are range-bound, it may indicate an upcoming upward breakout.
However, like any indicator, OBV has limitations. It can produce false signals in choppy markets and is used alongside other technical tools, such as Moving Averages or support and resistance levels, to improve reliability.
Fibonacci Retracement
Fibonacci retracements are a technical analysis tool that helps traders pinpoint potential support and resistance levels during price fluctuations. The tool is based on the Fibonacci sequence, a series of numbers that produce key ratios like 23.6%, 38.2%, 61.8%, and 78.6%. These percentages represent levels where the price of an asset might retrace before continuing its trend.
Traders apply Fibonacci retracement by selecting two extreme points on a price chart, such as a recent high and low. The tool then plots horizontal lines at the Fibonacci levels, indicating possible areas where the price might pause or reverse. For example, in an uptrend, a price pullback to the 38.2% level could signal a buying opportunity if the trend is likely to resume.
Fibonacci retracements are often used in conjunction with other indicators, such as the MACD or RSI, to confirm signals and enhance reliability. While they provide valuable insight into potential turning points, it's crucial to remember that these levels aren't guarantees—prices may not always behave as expected at these points, especially in volatile markets.
How Traders Use Leading Indicators in Practice
Traders use leading indicators to gain insights into potential price movements before they occur, helping them position themselves early in a trend. Here’s how leading indicators are typically applied:
- Identifying Overbought or Oversold Conditions: Indicators like RSI or Stochastic Oscillator are used to spot extreme price levels. When these indicators signal that a market is overbought or oversold, traders analyse the situation for potential trend reversals.
- Combining Indicators for Confirmation: It’s common to pair multiple leading indicators to strengthen signals. For example, a trader might use both the RSI and OBV to confirm momentum shifts and avoid acting on false signals.
- Spotting Divergences: Traders look for divergence between an indicator and price action. For instance, if prices are rising, but the indicator is falling, it can suggest weakening momentum, signalling a potential downward reversal.
- Clear Entry and Exit Points: Leading indicators often provide clear entry and exit points. For instance, the Stochastic Oscillator signals a bearish reversal and entry point when it crosses back below 80, with traders typically exiting the trade when the indicator crosses above 20. Likewise, Fibonacci retracements can provide precise levels where a trend might stall or reverse.
Potential Risks and Limitations of Leading Indicators for Trading
While leading indicators offer valuable insights into potential price movements, they come with risks and limitations.
- False Signals: One of the biggest challenges is that leading indicators can generate false signals, especially in volatile markets. For instance, an indicator might signal a reversal, but the price continues in its original direction, leading traders to take positions prematurely.
- Limited Accuracy in Trending Markets: It’s common that in strong trends, such indicators remain overbought or oversold for extended periods, causing traders to misinterpret momentum.
- Overreliance on One Indicator: No single indicator is foolproof. Relying heavily on one without considering other factors can lead to poor decisions. Traders need to combine leading indicators with other tools like support/resistance levels or trendlines to validate signals.
- Lagging in Fast-Moving Markets: Even though they are called "leading" indicators, they can sometimes lag in rapidly changing markets. By the time a signal is generated, the opportunity may have already passed.
The Bottom Line
Whether trading forex, commodities, or the stock market, leading indicators offer valuable insights to help traders anticipate potential price movements. By combining these tools with a solid strategy, traders can better navigate market conditions. To start implementing these insights across more than 700 markets, consider opening an FXOpen account and take advantage of our high-speed, low-cost trading conditions.
FAQ
What Are the Leading Indicators in Trading?
Leading indicators are technical analysis tools used to determine potential price movements before they happen. Traders use them to anticipate market shifts, such as reversals or breakouts, by analysing price momentum or trends. Common examples include the Relative Strength Index (RSI), Stochastic Oscillator, and Fibonacci retracement levels.
What Are the Three Types of Leading Indicators?
The three main types of leading indicators for trading are momentum indicators (e.g., Momentum (MOM) indicator), oscillators (e.g., Stochastic), and volume indicators (e.g., On-Balance Volume). These tools help determine market direction by assessing price action or trading volume.
Is RSI a Leading Indicator?
Yes, RSI (Relative Strength Index) is a leading indicator. Considered one of the potentially best leading indicators for day trading, it measures momentum by comparing recent gains and losses, helping traders spot overbought or oversold conditions before potential reversals.
This article represents the opinion of the Companies operating under the FXOpen brand only. It is not to be construed as an offer, solicitation, or recommendation with respect to products and services provided by the Companies operating under the FXOpen brand, nor is it to be considered financial advice.

XRP will RunXRP is currently in a consolidation phase as it seeks to establish new highs and lows. The Relative Strength Index (RSI) indicates that XRP is undervalued, suggesting it is aiming to find new lows at higher price levels. The candlestick patterns are following an upward trend line, and both the 20-day and 200-day moving averages remain positive after experiencing a golden cross around November 10th. There are many positive signals that support a bullish outlook for XRP.
Fundamental analysis indicates that XRP has a promising future, with new leadership at the Securities and Exchange Commission (SEC) and fresh partnerships fostering the institutional adoption of blockchain technology. These initial price movements are just the start of increased exposure for XRP.

#MARA 4h Elliott-Wave AnalysisMARA chart showing some very complex Elliott-Wave structures.
Not easy to count, but in combination with the RSI, the structure is very clear.
Beautiful chart in my eyes!
The move to the upside, labeled here as the blue Wave (b) with the pink (wxy) substructure, initially appears to be a 5-wave impulsive move. However, upon closer inspection, and aligning the chart pattern with the RSI, it becomes clear that this is a (wxy) corrective structure rather than an impulse.

BTC Short Trade Opportunity and SetupBYBIT:BTCUSDT.P / BYBIT:BTCUSDT / CRYPTO:BTCUSD Bitcoin/BTCUSD has recently hit the resistance level of a pattern that has generally held true since mid March 24 (4 preceding resistance and support confirmations).
Furthermore, it has started a return downward move following on from a 3 day filter for confirmation of the resistance level (an example of how a 3/5 day filter is an important tool for crypto trading).
Additionally:
The RSI resistance level of 70 has been recently reached and the RSI is trending downwards - a usually statistically significant indicator
The downward return move is supported by reasonable (although not enough on it's own) volume
A 3 bar pattern (downward move, pause, further downward move for confirmation)
A rate of change approaching and trending negative
A MACD also approaching negative
It's always important to assess the risk that might prove the thesis wrong. And they are:
Today's candlestick pattern is close to a dragonfly, i.e. there might be a return upwards move imminent (although this is unlikely to constitute a beginning of a move beyond the previous high as an actual dragonfly candlestick is at the end of a downtrend)
The MACD is trending down but has not actually turned negative yet, i.e. it is a bit early to say this indicator is stating a downward trend
The ROC hasn't turned negative yet either (but is trending downwards for sure)
This all leads to the following conclusion: For those with a high enough risk appetite (and usually crypto traders are those with the highest :-)) this is a good entry point for a short trade.
Using the (admittedly early but still reasonable) trend for the past three days to determine the final take profit point of 45500 (blue arrow) by approx. 19 Nov 24, the following can be set as a guide for a trade:
Entry: Now or latest tomorrow in case today's candlestick is an indicator of a minor move upwards
SL: $70,500
TP1: $63,450 - based on the first potential moving average being a resistance (200 MA)
TP2: $60,500 - based on the previous move's consistent (and twice confirmed) low
TP3: $54,500 -based on a previous historic low (i.e. psychologically important price point) which also acts as a confirmation of support to a previous move
TP4: $45,500 - The approximate price point of an estimated downward trend
Exit date (independent of TP level): 19 Nov 24
NOTE: the 19 Nov date here is important. It is the forecasted date by which the current downward price trend would linearly reach the support level. This date would be used as a checkpoint to exit the entire trade to safeguard against the normal, usually dramatic and beyond rational calculation price gyrations of crypto.

Natgas - Pending RSI Failure SwingThis is an idea of what to look out for if natgas continues to rally into overbought RSI territory and tops out as it did in May and June of 2024 (current year). Look out for overbought RSI divergence followed by a failure swing as shown and outlined in further detail in the idea linked below, probably confirmed by MACD divergence as well. Look out for an approximately 40-day duration of top formation once RSI enters overbought territory, plus or minus 20 days. Be prepared for a max draw down of 2.14% if you short the close of the day the failure swing is confirmed. The previous gain was 29.16%. Due to the high draw down %, it may make sense to short a QG micro which is 1/4 of an NG contract, possibly adding more on the way down at your discretion. The trade entry may happen later this year, approximately mid November.
Also something to watch out for is a much sharper rise with a much shorter RSI failure swing pattern as was formed at the start of the year 2024 (current year), also shown on the chart. The drawdown was much smaller and the target much greater (50% gain) but the short duration made the failure swing more suspect. It’s better if more than just 5 days form the top and a deeper valley is formed.
This is all very hypothetical, but these are the types of swing trades I watch for and it’s good for me, if no one else, to note these potential trades as they approach. Please feel free to ask questions.
Previous failure swing idea with additional explanation:

Last Time This Happened, Bitcoin Rose Over 60%In a previous post about the weekly chart, I touched upon how we were headed toward 50 on the RSI. From there, it had the potential to range between 50 and 45 (within that yellow box), and it looks like we hit the 49 mark and then pivoted. The trend reversal happened once RSI was within fair-market value since it indicates over-bought and over-sold activity. The stochastic RSI bottomed and crossed upward, meaning we have momentum back in the market. The big question now is, how much will price action be impacted by an upward cross in RSI?
We can see the possibility of the upward cross coming soon. This is definitely something we want to keep our eyes on in the coming weeks - especially since we are just coming out of a stochastic RSI bottom with momentum coming back into the market. For craps and giggles, the last time we had an upward cross in RSI on the weekly chart after bouncing back from around 51.75 (aka fair-market value), Bitcoin's price rose 61.5%, from $30,364 to $49,048 (at an RSI of around 86). I'm using that as the primary example as the last upward cross we had was from an RSI of around 80, however Bitcoin still went on a tear, rising almost 52% from $48,601 to $73,794 (where RSI peaked at 92).
It was the tail end of October 2023 when Bitcoin's price took off once the RSI crossed around the 51.75 mark (aka fair-market value - see why this is important?), and peaked in March 2024, ultimately rising 143%.
To say it may be an interesting couple of weeks to months with the potential price action is an understatement.

Does BTC go down even more? And what would that do with ALTSDid BTC make it bottom yet or will we see more red?
If we look at the charts and the strong rejection of the current lows we would like to think we have seen the bottom.
Relative Unrealized Profit
That made me look into the RUP chart (Relative Unrealized Profit) on Chainexposed. If we analyse that chart we can see that the RUP in the green zone has been bottom signs. If we look in the red zon ther was always a top if we got there.
The in the big circle we see a mirror image of 2022 vs 2024 and both can be seen as a H&S structure. Both have the same TT in the green zone. If we take this chart as leading sign we can sugest a uptrend from the current lows to form the right shoulder as drawn in the chart.
The break of the shoulder and neckline would be the sign that we will go down towards the liquidity below the lows. Now this is nothing special in a regular bullmarket. But what if i was too tell you that the first real liquidity for BTC is as far down as 32k...
Yes you did read it correctly. Almost all liquidity between the 56k and 42k where it was for a week or two ago is gone now. So in my opinion there ar two main scenarios possible here.
Scenario 1:
We will see new liquidity from retail investors building up just below the current lows and that will bring enough fuel for the bulls to proceed with the bull run and break the ATH.
Scenario 2:
Retail is so affraid (by FUD and the loses on alts) that they will not have the believe in the uptrend now. Then that would mean they are not likely to buy or go long now. Then the liquidity range below stays rather thin and there is lack of fuel for the bulls. Will that trigger a flash sale all the way down towards the 32k?
What are your thoughts on these scenarios? Please let me know in the comments.

Trading with RSI: The Bad, The Good and Even BetterIn this video I explain how to use RSI (Relative Strength Index) to make trading decisions. You'll learn how to properly use RSI oversold condition, combining low timeframe price action signals with high level context analysis.
Besides of explaining three different strategies (the bad, the good and even better) I'll do back-testing on historical data to demonstrate how those strategies translate into real trading results.
Disclaimer
I don't give trading or investing advice, just sharing my thoughts.

Trend Trading Strategy for the Heiken Ashi Algo v6Knowing when the RSI and price are in a ranging phase even in the short term can be a difficult process.
You are either #Ranging #bullish or #bearish. At least in the Algo v6 you can get a clear vision of exactly whats happening.
In this video im going to give you a VERY simple strategy on:
1. How to know if the RSI and price are ranging
2. When do i break away from Ranges
3. Am I trending
4. Im trending but whats my confluence to take a long or short
5. Is my range getting bigger or smaller
Enjoy this quick vid and ask questions below.
Thanks everyone.
