WHY INDICATOR 99% OF YOUR FAILURE. WHERE IS THE TRUE DIRECTION ?The indicator always loses because it uses the high-low-open-close price of the past, so it is usually slower because it is unpredictable. Future nature is unpredictable. So how to win in the market?
determine when the price is close to the real value. and when is speculative price? profit is equal to the difference between the real value and the speculative price.
Relativestrength

$ADA consolidation after a big move, give it time0.41 key resistance for ADA (1st touch rejection)
30+ month base cup.
Needs time to consolidate after the big move recently.
High relative strength of Cardano compared to other crypto blue chips.
Ideally would like to see ADA consolidating between 0.30 and 0.4 for a while before a big move
March 2021 is the expected Goguen release date
"When the smart contracts are live, large-scale decentralized finance (DeFi) protocols and other decentralized applications would be able to launch on top of Cardano—giving it further utility and value"

JSE Potentially Starting to Outperform the S&P500?After the recovery from the Covid lows, the JSE has been underperforming the S&P500. However, since the start of the year, the JSE has been outperforming it. However, the low holiday volume should be taken into account. However, the start of the year could indicate where the JSE is at.

JSE Where are we at?Starting 2021 we find that the recovery from the Covid lows is still in progress. After a pullback and low formed in October 2020 we are seeing another push higher. Resources are again showing the most strength with a nearly 40% rise. However, financials are also recovering well at this stage but industrials are lagging. Over the holiday period, we have seen a push higher on lower volume but now we are finding a shoring of the stride. Watch for the next pullback in 2021 for the next opportunities.

XrPusd inspite Delisted from many serviceXrp is on the rising wage right now alone side btc, etc remember there is a bit pull back then continue for this week but expect any change when dollar get strong.
For me I start buying in from 0.19345 ...because the strong resistance was 0.17 which they can't afford to go bellow that ..the bulls in the game.
From the direction bias I expect a rise in the coming days, weeks and move more above...inspite thier situation.

1hr time frame on Crude oil A mark up for possible sell through resistance from NY sessions Tuesday we will see the drop


How To Analyze an Indicator.Several FinTwit in my network asked me how to use the Relative Strength indicator which I called PriceRatio in TradingView.
My best explanations are noted in the text box of this chart. I use this approach to analyze most indicators and stock price actions.

A new system worth to tryMulti-pairs strength system, with entry signal.
Equipped with Auto-Fibo 3 major level.

Relative Strength: Tech is topping out vs. financialsChange in leadership from tech (growth) to financials (cyclical)

Relative Strength: Leadership change from Nasdaq to RussellUsing relative strength to chart changes in stock market leadership

Weekly Market recap 7Elections week rollercoaster
After the last week's wild price action related to the US Elections, DXY erased my expectations about any sort of USD recovery. DXY went from the top of the 3-months range to the bottom (currently testing the grey area). The last line of defence before the downtrend in USD resumes is around 91.75 low (Black horizontal line at the bottom of the range). I will be aggressively bearish on USD when that low is broken down.
Two scenarios
1)Risk assets (see NZDUSD and S&P500) are currently testing or slightly pierced their resistances. So we need a decisive impulse in either direction to have a clearer perspective on the sentiment this week. My bias is on the DXY breakdown and the start of risk-seeking sentiment.
2)If risk sentiment begins, NZDUSD seems to have relative strength, so I'd be considering buying it over other risk currencies. On the other hand, looking at the USDJPY, we can see a long-term descending triangle that had just broken down on November 5. I expect USD to be relatively weak currency among safe-havens. Shorting USD looks like a good idea to me.

Materials at multi-level supportMaterials sector has been showing relative strength. It is actually 3th in YTD performance, after 1. Technology, 2. Discretionary (Mega-cap lead sectors)
Today it is resting on the 100ema, which has been supportive since march 23rd crash.
This level is also coinciding with early 2020's high, as well as 4 other tests of the support; including a failed breakout, which worked the next time it tried.
OBV has been supportive of the uptrend. (BULL)
RSI showing slight divergence as the last bottom late September has a slightly higher RSI(10) than the current one. (BEAR)
A strong close below $60 would deny the support, and make the chart a short-term bearish one.

Weekly Market recap 5: Still at the crossroads of the sentimentsWhere we are, and "if-thens"
Since the last week, the sentiment hasn't changed too dramatically, looking at the technical picture of DXY, I still see it as a range in a medium-term. Although, DXY crept down, closer to the "orange" line of defence (see the orange long-term trendline). Along with the stabilizing S&P500 index (The stock index has had the classic negative correlation with the DXY since the crash in March), DXY gives me reasons to have a short-term bearish bias, hence likely transition to risk appetite.
If DXY closes below the orange trendline (around 92.2), it will be a strong sign of the beginning of a bearish market in USD. The last line of defence is around 91.7 (Sep 1 low).
On the contrary, if DXY manages to close above the long-term trendline of the downtrend which started in March, I'd consider buying USD. I would need additional confirmations of course, as it is still a range market. Such confirmations may include reaching 94.00 level.
The highlighters of sentiments
A)If we bet on risk
Say DXY would continue the downtrend, and we enter the risk appetite sentiment. What do we short USD against? Let's look at the most common risk duet of AUD and NZD (see the AUDNZD chart). If you zoom out a bit, the first thing you notice is the range, gradually descending channel. It tells us that AUD has been weaker in the long term and it's better to be long NZD in general.
MA(100) is playing the role of the "mean" here. For short-term trading, it's nice to take into account how far the pair is from the mean. A good AUD-short would be after the candle reversal pattern (I marked the last one with the grey area) was formed near the upper border of the channel. Generally speaking, the further AUDNZD from the mean, the clearer it is what to buy to ride the risk appetite sentiment.
B) If we bet on safe-havens
Look at the long-term chart of USDJPY. USD has been pressured since 2015. Therefore I'd prefer going long JPY if risk aversion activates. However, I may still consider buying USD if USDJPY breaks the 5 years descending trendline.
Summing up
Eventually, follow the hints of DXY and then choose the most diverged currencies by their relative strength or weakness. For example, if risk aversion starts, I'd focus on shorting the weakest one (most likely USD) against relatively strongest one (let's say NZD). Adjust it to the short-term sentiments of European currencies and CAD, and you have a road map to find numerous additional setups.

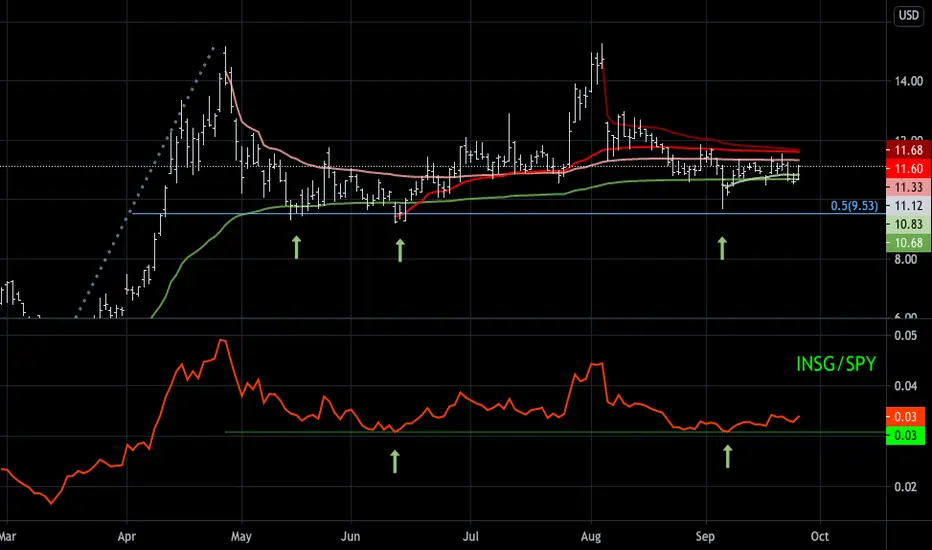
INSG avwap 'squeeze' should resolve to upside-INSG currently trades between VWAPs from significant YTD highs and lows, the tightening range of these VWAP lines creates a 'squeeze' like a tightening bollinger band or similarly a TTM squeeze, which signals a current decrease in price range and an increase in volatility is to come
Why I expect this increase in volatility to occur to the upside:
-50% retracement: INSG has consistently found support at the 50% retracement from the move higher off the March low
-Support in INSG/SPY: INSG finding support in relative performance to SPY was a prior predictor of ensuing outperformance vs. SPY, and having recently reacted higher from support, I expect outperformance to resume
Conclusion: tightening price range shown by anchored VWAP squeeze and a reversal higher in SPY relative performance point to an imminent upside breakout
GBPJPY AOIalertLooking for shorts on GBPJPY within the area of interest between 135.88 - 137.26.
The AOIalerts are created to help experienced traders focus on higher probability locations for buy and sell signals.

EURNZD AOIalertLooking for longs within the area of interest between 1.7768 - 1.7693.
The AOIalerts are created to help experienced traders focus on higher probability locations for buy and sell signals.

AQN outperforming/avwap support-For the last 2 months AQN has traded above the VWAPs from the significant highs and lows of the year
-During the same 2 month period, AQN has outperformed XLU and is now challenging its all time high in outperformance vs. XLU
-AQN has recently been outperforming SPY after breaking out of a downtrend in SPY underperformance that has acted as resistance since March
$13.5 looks like a good line in the sand, I have to expect higher prices as long as AQN stays above it

EURGBP AOIalertLooking for EURGBP longs within the area of interest between .9134 - .9083.
The AOIalerts are created to help experienced traders focus on higher probability locations for buy and sell signals.

GBPAUD AOIalertLooking for short entries on #GBPAUD within the area of interest between 1.7795 - 1.7888.
The AOIalerts are created to help experienced traders focus on where they should be looking for their buy or sell signals.

EURCAD AOIalertLooking to go long within the area of interest between 1.5638 - 1.5570.
The AOIalerts are created to help experienced traders focus on where they should be looking for their buy or sell signals.

AUDNZD AOIalertLooking for shorts on AUDNZD within the area of interest between 1.0848 - 1.0890.
The AOIalerts are created to help experienced traders focus on where they should be looking for their buy or sell signals.

