Relative Strength Index (RSI)

🔥 Bitcoin Most Oversold Since COVID Dump: Incoming Bounce! 🚨If you enjoy this analysis, please like and follow.
I've been quite bearish over the last few weeks. I noted that volatility was extremely low and that the odds were more in favor of a bearish move as opposed to a bullish one.
In the short-term, statistics are more in favor of a bullish bounce, as opposed to a continued sell-off. The daily RSI value (measuring oversold and overbought conditions) has not been this low since the COVID dump back in 2020.
I still believe that BTC will continue to go down over the next months, but that doesn't mean we can have a bounce here and there. Personally, I think we will see some kind of bounce in the near future, which will eventually be sold off again.
Short-term in favor of the bulls, long-term for the bears.
What will happen next week? Share your thoughts in the comments 🙏

NIFTY SHORTTake short trade if market goes up till 19,400
Disclaimer: I am not SEBI reg. Analyst. Do your own research before trading or investing.

🔥 Bitcoin Stochastic RSI Signal +838% Average Gain? Bullish!If you enjoy this analysis, please give it a like and a follow.
The month has not closed yet, but it appears that the slow Stochastic RSI (orange line) will close above the 80 line for the first time since November 2021. I've made several bearish analyses over the last few weeks, but this one is a more bullish one (on average!).
Historically, once the orange line from the Stochastic RSI closes above the orange line it means that a pump is coming. 3/4 times a very decent move has occurred from the moment it went over 80, till it crossed below 80. On average, a +838% move has followed.
We can say with quite some certainty that a +838% move is out of the question. Still, the market has historically performed well.
Personally, I'm anticipating a move like in 2019, where the orange line reached above 80 and moved below it in the following month.
Is this bullish to you? Share your thoughts in the comments 🙏

🔥 Bitcoin Bears In Danger.. Or Not?Quick and dirty analysis coming in.
BTC just hit a 3 week diagonal resistance. For the bulls it's going to be a make it or break it moment. If we can close the day above 29.8k we can make the assumption that the relative bearish times are over.
However, we're not there yet! Stocks have sold off hard today, which makes it more likely for bearish price action. In addition, the hourly RSI is quite overbought at the moment. Wouldn't be surprised if we reverse from this point onwards.
Too early to be bullish. Aggressive bears are shorting here, will they be right?
Discuss your views below 🙏

Falling Wedge for Reversal | $110Weekly Chart
PAYPAL NASDAQ:PYPL is in the Falling Wedge and can break in this month. Just follow it
We have good signals
- Divergence RSI
- Failling Wedge
So wait and see next move

Gold or Nasdaq: What to Short this Week?For Gold (XAU/USD), the 4-hour chart suggests a neutral-to-bearish stance. While the pair is currently above its moving averages, the 50-day moving average is closely trailing its price. The Relative Strength Index (RSI) is dropping towards a neutral level, indicating a potential pause in buyer activity. If Gold drops below $1,945, there is a risk of prices descending further and retesting their previous lows or the 200-Day Simple Moving Average (SMA) around $1,941.
The deciding factor for Gold this week will likely be the US jobs data. The Non-Farm Payroll (NFP) report on Friday is a significant event, and the precursor jobs data (JOLTS Job report on Tuesday) could also sway traders. The market expects the NFP to show 190K jobs added, more than double the natural US growth rate. A strong jobs figure could influence traders' anticipation of the Federal Reserve's interest rate decision and impact the downside outlook for Gold.
On the other hand, Nasdaq and other major US indices are expected to end July with gains. The Dow Jones has particularly shown impressive growth over the past two weeks. The outperformance of the Dow Jones suggests a possible shift by investors from growth stocks (such as Nasdaq stocks) to value stocks.
Looking at the daily chart, the Nasdaq Composite is now targeting a key resistance level at 14,649. However, there is a possibility of aggressive seller response at that level. On the 4-hour chart, a divergence with the MACD indicates weakening momentum, which is often followed by pullbacks.
Earnings reports from major tech companies, Apple and Amazon, will be crucial for Nasdaq this week. These two giants represent 11.6% of the entire Nasdaq index measured by market cap. Better-than-expected US earnings could potentially prolong the bull run in the market.

#GRT/USDT 12h (Bybit) Symmetrical triangle breakdown and retestThe Graph got rejected on resistance forming a shooting star with an overbought RSI, retracement down to 50MA support seems in play.
⚡️⚡️ #GRT/USDT ⚡️⚡️
Exchanges: ByBit USDT
Signal Type: Regular (Short)
Leverage: Isolated (3.8X)
Amount: 5.0%
Current Price:
0.12445
Entry Targets:
1) 0.13580
Take-Profit Targets:
1) 0.10715
Stop Targets:
1) 0.15015
Published By: @Zblaba
CRYPTOCAP:GRT #GRTUSDT #TheGraph #AI #Web3
Risk/Reward= 1:2
Expected Profit= +80.2%
Possible Loss= -40.2%
Estimated Gaintime= 3-4 weeks
thegraph.com

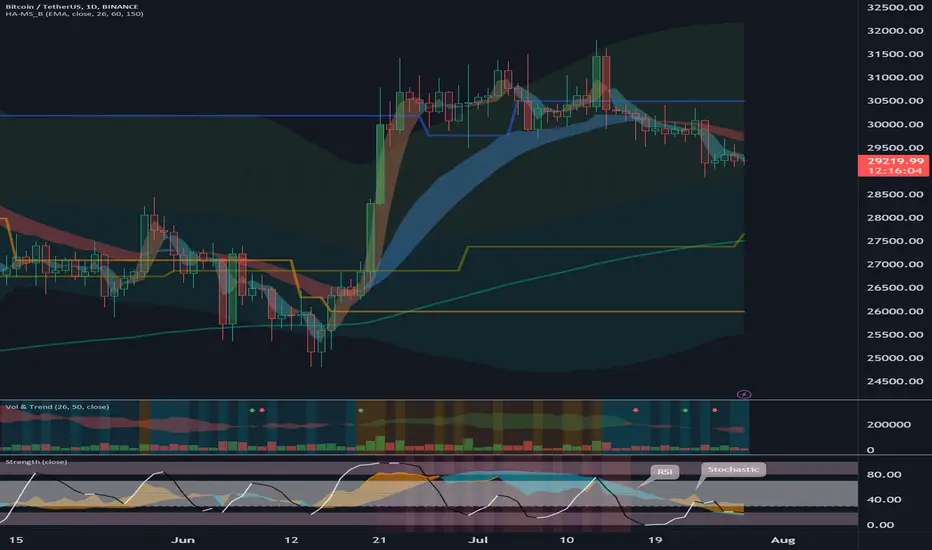
A combination of Stochastic and RSI indicatorsHello?
Traders, welcome.
If you "Follow", you can always get new information quickly.
Please also click "Boost".
Have a good day.
-------------------------------------
(Strength indicator)
The strength indicator will also be explained gradually.
Today, I would like to talk about how to interpret the indicators consisting of the Stochastic indicator and the RSI indicator.
It is set as below.
1. RSI indicator
ta.ema(rsi, 14)
For the setting value of the RSI indicator, we used the most frequently used value of 14.
2. Stochastic indicators
ta.sma(ta.stoch(close, high, low, 20), 12)
As the setting values of the stochastic indicator, as shown in the above formula, the setting values of 20 and 12 were used.
An important way to interpret
1. Stoch > RSI: likely to show an uptrend
2. Stoch < RSI: likely to show a downtrend
but,
1. If the Stoch indicator rises below 30, it is likely to show an uptrend.
2. If the Stoch indicator falls above 70, it is likely to show a downtrend
thus,
1. When Stoch > RSI, start split buying.
2. When Stoch < RSI, start split selling.
In that sense, I used the fill function to make it appear orange (#ff9800) when it is rising, and blue (#00bcd4) when it is falling.
It's best to understand the detailed information about all the indicators and use them, but be careful because if you study too deeply, your thoughts can become trapped in them.
Therefore, unless you are going to create a new indicator by directly utilizing the formula, it is recommended to understand and use only the core interpretation method of the indicator.
Since the stochastic indicator is an indicator of the price position within a certain period of time, it is recommended to use a set value suitable for your investment period, as it can indicate different results depending on how you set the set value.
As I said above, I used the settings of 20, 12.
The RSI indicator is an indicator of strength.
Therefore, when the price enters the overbought zone, the uptrend is at its highest, so once it exits the overbought zone, the likelihood of a downtrend increases.
Conversely, when the price enters the oversold zone, the downtrend is at its highest, so once it exits the oversold zone, it is likely to show an uptrend.
Therefore, it is not recommended to react in advance by thinking that price volatility will inevitably occur when a stock enters an overbought or oversold zone.
The key to the RSI indicator is to respond when it enters the oversold zone and exits the oversold zone, and when it enters the overbought zone and exits the overbought zone.
This is because if a full-fledged uptrend has begun, the RSI indicator may remain in the overbought zone.
Therefore, it is not a good idea to judge the situation based on all indicators alone.
The above is not a big deal, but I think it is a combination of indicators that makes it very intuitive to know whether or not the chart you are looking at is a chart you can start trading with.
We will go into more detail when we discuss how to find support and resistance points for that indicator.
-------------------------------------------------- -------------------------------------------
** All descriptions are for reference only and do not guarantee profit or loss in investment.
** Even if you know other people's know-how, it takes a considerable period of time to make it your own.
** This is a chart created with my know-how.
---------------------------------
Bitcoin Cycles are Getting ShorterUsing the RSI on BTCUSD/DXY, you can clearly see the different parts of the market cycle. Not always in ratio, but all in all things seem like they're speeding up.
At least to me...

NFLX is rising from supportNFLX on the 2H chart is rising with the shortest EMA rounding up . Price is now above the
POC line of the volume profile showing buying pressure has extinguished bearish momentum.
The RSI indicator shows RSI to have trended down into oversold territory. Fundamentally,
NFLX revenues have increased with the household password crackdown. Traders and investors
have noted that. I see NFLX as setup for a long entry. I will determine the best entry on
a lower time frame either 5 or 15 minutes. I see targets as 485 and 560 based on horizontal
resistances on the 4H and daily charts and so a good potential reward compared with the
risk of a stop loss at 416 set below the POC.

🔥 Bitcoin In Danger 🚨 Bearish Divergence Playing Out!Last week I made an analysis on BTC's bearish divergence on the 3-day chart. Seeing the bearish price action we got recently, it seems that this bearish divergence is playing out well.
In my eyes, it's very likely that BTC will go down from here onwards. Next target is the dotted purple support line.
Seeing there's another FOMC interest announcement tomorrow, Bitcoin is in danger of breaking through said support in case the market doesn't like tomorrow's meeting. In that case, my expectation would be that the top for 2023 is in.
All eyes on tomorrow.

KDJ & Stochastic RSI --> Crypto BreakoutIn previous failed breakouts (marked by dark-shaded circles) KDJ and Stochastic RSI both peaked and indicated trend reversals to the downside. In the current breakout attempt, both indicators are close to their lowest possible points.

🔥 Bitcoin Double Bearish Divergence: Caution! 🚨With BTC failing to break confidently through 31,000$, a bearish short-term scenario for BTC becomes more and more likely.
As seen on the chart, Bitcoin is experiencing a double bearish divergence on the 3-day chart, which started forming all the way at the start of 2023. The first (yellow) bearish divergence is arguably already "over", since the fall from 31k to 25k. However, the blue (second) bearish divergence is still very much alive and poses a risk to bullish investors.
A daily close below 29,500$ would dramatically increase the risk of a change in trend towards the bearish side. First support being the bottom dotted support line.
This move would be in line with my most recent bearish analysis for Bitcoin where we would trade in a bearish symmetrical channel, see below.
Over the long-term, I'm still bullish and of the conviction that the bottom is most likely in. Nevertheless, there's always a risk of shorter term bearish periods.
Share your thoughts in the comments 🙏

🔥 PEPE Oversold Bounce From Support: Great Risk Reward!PEPE has been trading horizontally for almost a month at this point. In that time, buying from hourly oversold areas has been proven to be very profitable.
As of this morning, PEPE has successfully bounced from the diagonal purple support line whilst being hourly oversold. These two in conjunction make it more likely for the reversal to play out.
Target at the monthly highs, stop just below the swing low.

EURUSD: RSI Bearish Divergence at a 0.786 RetraceEUROUSD is currently Overbought on the RSI and Diverging at a 0.786 Retrace just below Resistance; if it acts the way I suspect it will, we will see the Euro come back down to recover at least 50% of the range it's been in since around the start of the year and if we're really lucky, it will recover the full range.
I do suspect that the Euro will come back up after making the 50-100% retrace to the lows, but in the meantime, it looks Bearish.

GOLD interesting setup.After arriving at the 200 EMA, Gold has made a bullish RSI divergence on the daily chart. This could act a possible consolidation area or serve as the beginning of a fresh up move.

🔥 PEPE Oversold Bounce From Support: Great Upside!PEPE has been trading bullish alongside the dotted support line for around a week now. This trade is based on the idea that PEPE will once again bounce from said support. The idea of the bounce is reinforced by the fact that the RSI has hit oversold on the hourly chart, which has always caused a bounce in recent history.
Target at 200, stop at 159 just below the support. It's a risky trade, but has very decent upside.

LTC/BTC This is just an example of technical analysisIf helps you, please like and share.
#price_action BINANCE:LTCBTC

🔥 CAKE Is Done Dumping? Amazing Risk-Reward Bounce PlayOver the last few months I've made several CAKE analyses where I discussed the massive dump that this token was experiencing.
Like mentioned before, I think that CAKE as an asset is dead, but that doesn't mean it can't offer good trading opportunities.
This trade is based on the assumption that CAKE will reverse sharply after the crazy April & May dump. I'm fairly certain that CAKE will never see a new all-time high again, but a 2x from here is certainly in the cards, especially with a bullish Bitcoin.
I'm waiting for CAKE to close above the most recent high of 1.67, stop below the swing lows and a target of 3.50, roughly where the dump started.

Gold Triple TopAnalyzing the monthly price chart, a significant pattern emerges - the Triple Top formation from 2020 till now. The Price Percentage Oscillator (PPO) and Traders' Dynamic Index (TDI) indicators further shed light on the situation. Here's my take on short-term and long-term price analysis and projection.
The Triple Top pattern indicates three consecutive peaks at roughly the same price level, suggesting strong resistance. This suggests caution as it may signal a potential reversal or consolidation phase for Gold. The triple top pattern is a bearish reversal pattern that occurs when prices reach a high three times in a row, each time at a slightly lower level. This pattern suggests that the uptrend is losing momentum and that prices may be due for a correction.
Looking at the PPO indicator, it shows a bearish divergence with the price, indicating weakening momentum. This supports the notion of a possible pullback or correction in the short term.
The TDI indicator highlights a potential shift in market sentiment. The green RSI line has been in decline as price remained elevated and could imply a downtrend is forming.
In the short term, given the Triple Top pattern and the bearish signals from PPO and TDI, Gold may experience a downward correction or consolidation phase. Support levels to watch include $1,700 and $1,600.
In the long term, caution is warranted. If the Triple Top is confirmed, it may trigger a more significant trend reversal. Key support levels to monitor are $1,500 and $1,400, while resistance remains near $2,000. The short-term technical analysis suggests that gold prices may be due for a correction in the near future. However, the long-term technical analysis suggests that gold prices are still bullish and are expected to continue to rise in the years to come. Investors should consider taking profits in the short term and waiting for a better entry point in the long term.
Please note that this analysis is based on technical factors and historical patterns, and it's essential to consider other factors and conduct further research before making investment decisions. Stay informed and adapt to changing market dynamics.

🔥 RDNT High Probability Oversold Bounce: Amazing Risk RewardRDNT is one of the newer tokens on Binance, which naturally makes it more volatile than others. This volatility is risky, but offers great opportunities when used correctly.
As seen on the chart, RDNT has hit hourly oversold on the RSI on a strong support area, which directly caused a bounce.
For an optimal risk-reward, I put the target at 0.40, but you can take partial profits at 0.315 in case you want less risk. Stop under the recent swing low.

NIFTY INTRADAY FOR SCALPERSIF NIFTY opens or retests to 18,805-18,808, you can take a long position till 18,850.
DISCLAIMER: I am not a SEBI Reg. Analyst, please do your own research before trading or investing.
