BTCUSD Monthly Time frame- Stochastic RSI- BullishSee BTCUSD In Month Time Frame- The History is Repeating. As you can see in the chart in this time frame Btc finished his pullback to static supervision and Stochastic RSI send a bullish signal.
Relative Strength Index (RSI)

BTC Short Term Price PredictionWhile there is a negative dissonance in the price and relative strength index correlation in the weekly period, the price seems to show where it wants to go, although we can't break down the giant ascending channel layers yet.

Titan Long (RSI Divergence)This Analysis is just for Educational Purpose......
Titan is showing Positive Divergence.....
Bullish with SL around 2339.90.....

The Hidden Negative Divergence of BTCWe have already broken rising trends and channels in a short time range.
It seems to have strengthened the effect of MR.Powell's explanations in the fundemental analysis section in the fundemental analysis section, which we have been exposed to in recent weeks and the negative incompatibility of the daily period and the price of the daily period and the relative power index.
As if it were not enough, there has been an obvious hidden negative incompatibility in terms of price and relative power index choice during the weekly time interval.
I think that the decline will last up to $ 18.500 and we can start to focus on the $ 12-14K band depending on the reaction it will receive or get from those.

GRTUSDT - Overbought on 3D timeframePosting for own future reference
RSI is "sell" zone
Price above BB
If today closes red (5.5h remaining), then idea is confirmed.
Same for 3D BTC pair:
Targets: 0.13, 0.11, 0.09 - 0.08. I really don't see it going any lower.
The indicators say "short" but minimize leverage, as this coin has proven to be highly volatile.

BTCUSDT - Initial Short (2D chart)Macro wise I am still very bullish on BTC. On lower timeframes such as the 1D/2D a bearish divergence is printing. The Bollinger Band squeeze indicates an imminent move and, in tandem with the RSI and the plethora of oscillators printing bearish, it is probable we see some downside (small correction) in the coming days. Targets and divergences marked on chart.

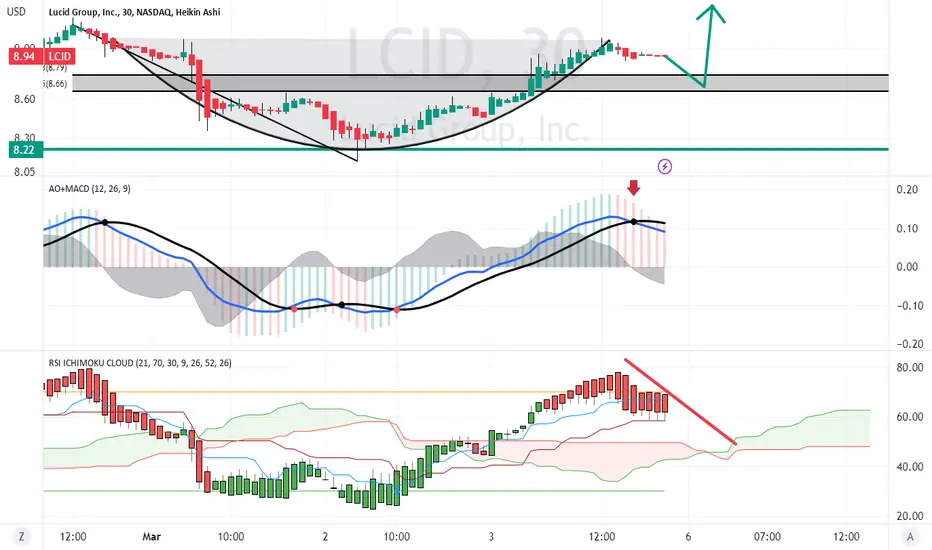
LCID Lucid Cup and Handle Short then LongFSR has formed the cup of the cup and handle pattern and is now starting the
downturn formation of the handle. Price action should continue down to the 50%
retracement of the uptrend of the cup. It should then reverse and trend upward
to twice the height of the cup/ AO /MACD / RSI confirm the downtrend.
I will target this with the $8.50 strike put options expiring 3/10 and then upon
hitting the full retracement close than position and open $9.50 call options
expiring 3/17. Overall, expecting 200-300% realized profit on the trades.
Not at all a surprise but FSR / Fisker has the same pattern and so a similar
idea.
ETHUSDT POC| .618 Fibonacci| Price Action| Trend Today’s analysis – ETHUSDT – trading at a very pivot where a bullish expansion is probable,
Points to consider,
- Price Action Corrective
- POC Support
- .618 Fibonacci Pocket Support
- Daily S/R Support
ETHUSDT’s immediate price action is trading at a key support region that is in confluence with the .618 Fibonacci, POC, and the Daily S/R – allowing for a bullish bias.
The immediate objective is the Monthly S/R, exceeding this region will lead to a trend continuation
Overall, in my opinion, ETHUSDT is a valid long with defined risk; price action is to be used upon discretion/ management.
Hope this analysis helps,
Thank you for following my work
And remember,
A given skill is mastered only when consistently performed under intense pressure. If this isn’t the case, keep working on this skill until it’s proven to consistently show up under pressure. – The Mental Game of Poker

Fibonacci Retracement on TeslaNASDAQ:TSLA
Fibonacci Retracement on NASDAQ:TSLA implies that it may take support on fib level of 0.236 of 176-177 dollar.
Current price structure shows that it has taken resistance of 0.38 of 222 dollars, therefore, it may go down towards 146 to fill the gap. At this level, its RSI will also be oversold which will trigger bullish rally towards 177.
Tesla takes doesn't retain 196-176 with strength and falls below this price level.

DOGE/USDT Relative Strength Index Doge / USDT 3h Binance pair Shows Long Position , Because Relative Strength Index reverse after touching 30% lowest bar mostly Time Frames Shows Long Position According to RSI expect of 1day . if you have any other idea about Doge please share your idea.

ZILL/USDT Relative Strength Index Zill / USDT 3h Binance pair Shows Long Position , Because Relative Strength Index reverse after touching 30% lowest bar mostly Time Frames Shows Long Position According to RSI expect of 1day . if you have any other idea abour zillqa plese share your idea.

ABFRL AT CIP LEVEL +DEMAND ZONE !!Hello to everyone
The price trading near weekly demand zone . A significant decline has been seen in the price and the price is now trading near the demand zone . so the price can takes rest from the decline and can move upwards from the support zone .
If the price respects the support zone and if any bullish candle or formation is formed then we can build our position to the upside.
#ABFRL
👉Do Or Die level
👉Support seen at 222-220
👉Reversal sign
👉If holds then its can move for 260/280/300
👉Add to your watchlist
Traders, if you liked this idea or if you have your own opinion about it, write in the comments. I will be glad.

MUTHOOT FINANCE AT CRUCIAL SUPPORT LEVEL !!Hello to everyone
Price trading near strong demand zone. If price respects the support level of... 950--945, than we can expect a good move in price towards the upside and if price breaks the support level than price will go down to fulfill their the downward targets.
#MUTHOOTFIN
👉Add to your watchlist.
👉Important demand level
👉Make or Break Level
👉Support 950-45
👉Above 950 full reversal possible for 1000/1040+
👉Fresh breakdown below 945

Hidden bullish divergence on #BTCin 2019 we had a similar situation unfold out of the bear market lows
are we repeating a similar situation
#RSI is showing lower lows along with a higher low on price
Interesting how history rhymes :)

Lazyluchi Talks Relative Strength IndexNow I've been TRADING trend continuation for 180 days now and I had something come to me on WEDNESDAY. The market being in an over bought or sold situation can affect our TRADES. I'll be making use of the RSI to aid my setups (that is: where my SLs and TPs even entries will be). Here are rules that can guide you after watching the video.
RULES OF THE RSI
1. Above 50% is BULLISH
Below is BEARISH
2. When taking TRADES be sure to know where the 50% is.
3. Don't TRADE counter
4. Know thy 20% and 80%
5. Always draw three lines (80,50, and 20) Then know the dominating structure, and take that TRADE
6. In an UPTREND, know thy 20 and 50 (wait for it to break above the 50 to BUY)
7. In a DOWNTREND, know they 80 and 50 wait for it to break below to SELL)
8. STRATEGY: trend following with breakouts
9. The RSI helps to avoid overbought and sold situations
Some abbreviations I'll be using would all make sense when I start. I'll be labelling the 80%,50% and 20% levels. 80 and 50 for the BEARS, 20 and 50 for the BULLS. The DIVERGENCE and STRUCTURES will still be in the works. Stay tuned for them RSI trades. Enjoy!

NY: EUR/JPY BOBBI - MOMENTUMTaking a quick market execution long on EJ following a break of our RSI moving average with confidence that EUR is showing strength and JPY weakness across the board. Used our playbook setup "BOBBI" (Break Out Break Back In) with momentum as our entry criteria. Asia and London have treated us well, lets see what NY has in store

How to Trade With Relative Strength Index (RSI) Indicator
Hey traders,
Relative strength index is a classic technical indicator.
It is frequently applied to spot a market reversal.
RSI divergence is considered to be a quite reliable signal of a coming trend violation and change.
Though newbie traders think that the application of the divergence is quite complicated, in practice, you can easily identify it with the following tips:
💠First of all, let's start with the settings.
For the input, we will take 7/close.
For the levels, we will take 80/20.
Then about the preconditions:
1️⃣ Firstly, the market must trade in a trend ( bullish or bearish )
with a sequence of lower lows / lower highs ( bearish trend ) or higher highs / higher lows ( bullish trend ).
2️⃣ Secondly, RSI must reach the overbought/oversold condition (80/20 levels) with one of the higher highs/higher lows.
3️⃣ Thirdly, with a consequent market higher high / lower low, RSI must show the lower high / higher low instead.
➡️ Once all these conditions are met, you spotted RSI Divergence.
A strong counter-trend movement will be expected.
Also, I should say something about a time frame selection.
Personally, I prefer to apply it on a daily time frame, however, I know that scalpers apply divergence on intraday time frames as well.
❗️Remember, that it is preferable to trade the divergence in a combination with some price action pattern or some other reversal signal.
Let me know, traders, what do you want to learn in the next educational post?

CSIXUSDT IDEAtrend
the pair is trading in range in most time frames (Daily Chart, 4,1 HOUR Time frames )
technical analysis
if you looking at this chart you will notice that its trading near its resistance, if you were to draw a Fibonacci retracemt n the chart you will see that the rectangle agrees with the info shown which is below the red resistance line drawn on the chart,
thoughts,
Im still looking to see possible break out from the region given that the RSI is trading below 50 level its great if it moves past this region and starts trading past the mid range, of course this is just an idea and thought of what i would like to see happen but alot of indecision displayed on this chart shows that any thing can happen and if it breaks past its resistance and retests above my 13 moving average i will consider a buy until the next resistance
Action,
adding this pair to your rebalance trading bot is great idea , i guess i have found the perfect pair to trade in combination with Atlas Navi pair (look at my previous idea on the pair if you missed it) and TRAC (trail Origin pair if you missed it look it up on my previous posts)
as always trading new pair is always risky and dangerous can lead to losing all your funds, and this are just my thoughts and chart set up that I would consider before getting into the markets which makes the published idea not a financial investment advice whatsoever.

LONG Term GOOG DCARe-entered the market after several months on the sideline waiting for longer term indicators to look positive.
I believe this is a suitable spot to start DCA again into high conviction companies and stocks.
High conviction in the company for the long term✅
Money flow on the monthly in the red ✅
RSI Oversold on the monthly ✅
Trading around significant support (@0.5 AT Fib)✅
Market Cipher on the monthly around the 'buy-zone' ❓*
*Market Cipher not yet indicating buy, however, weekly green indicator with the above indicates the monthly buy-signal is near - hence comfortable to DCA as within my personal risk tolerances)
** NOT TRADING OR FINANCIAL ADVICE **

SPAUSDT - Initial LONGOne alt that hasn't popped yet. Nice little breakout from the falling wedge and backtest. Initial targets 0.5, 0.55, 0.62 (don't quote me on them).

Bitcoin resistance at 200-week price average. Bitcoin has been hitting resistance at 200-week price average($25k) for the past few weeks as the lower indicators test thin lines between remaining bearish or breaking bullish. PPO has both lines below the 0 level which indicate overall bearish price momentum, while the TDI shows the RSI line creating a potential double-top at the 60 level. In general, the RSI will trend between 20-60 during a bear market, and 40-80 during a bull market. I personally would like to see Bitcoin turn around here and head lower for a longer bear market of at least a year. My current average is below $20k and I would like to add more below $20k.
Short-term neutral, medium-term bearish, long-term bullish. FTX drama likely gave us a bottom near $15k, but it would be nice to see a re-test to confirm that $15k is the actual bottom.

BLURUSD Daily S/R| POC| Range Low| Price ActionEvening Traders,
Today’s analysis, BLURUSDT, trading towards its range low, holding and consolidating will be a bullish sign,
Points to consider,
- Price Actin Corrective
- Daily S/R Support
- POC S/R Support
- PA Rotation
BLURUSD’s immediate price action is corrective and is at an area that has technical confluence with the .618 Fibaoncci, POC and Daily S/R, allowing for a bullish bias.
Consolidating and creating a bottoming structure will be a sign of strength, this has yet to be produced.
Overall, in my opinion, BLURUSDT is a valid long with defined risk, price action is to be used upon discretion/ management.
Hope this analysis helps,
Thank you for following my work
And remember,
“Dangers of watching every tick are twofold: overtrading and increased chances of prematurely liquidating good positions” – Jack Schwager

USDCHFThis situation has been examined in different dimensions:
1- Strong supply and demand levels that I identify with my own indicator and system.
2- The structure of recently formed waves
3- Current market momentum
4- The structure of classical and price patterns
In this idea, I identified the direction of the market in different ways and in the second step, I analyzed the potential of continuation or reversal. Usually, paying attention to the trend and strength of the trend can greatly increase the accuracy of the analysis.
In general, I tried to describe the continuation of the movement in the simplest possible way in the diagram.
⚠️ Disclaimer:
This is a personal opinion and you are responsible for any trading decisions.
if you liked this idea or if you have your own opinion about it, write in the comments. I will be glad ❤️️
