RSI: The King of IndicatorsIf I had to choose one (and only one) indicator to use for the rest of my life, it would most certainly be the Relative Strength Index (RSI). Anyone who's spent more than 30 seconds on TradingView understands, in the most basic sense, that RSI indicates when an asset is over- or undervalued (overbought or oversold). But this delicious little oscillator can do a lot more than that. In fact, you could develop a winning trading strategy based entirely on RSI signals and nothing else (though, why would you?). Here are some of my favorites:
SMA Crossovers
TradingView's built-in RSI indicator now comes equipped with a Simple Moving Average applied by default. Like other MA crossover strategies, RSI SMA crossovers can be a very effective tool. Note that this sort of strategy is probably best implemented programmatically, though. But if you do intend to trade these signals the old fashioned way, you'll definitely want to work on a high time frame. Eventually I intend to write a PineScripts strategy to do some back-testing and get some win/loss rates and ratios for different RSI and SMA lengths.
Divergences
Who doesn't love RSI divergences? They're easy to spot, and very reliable on a variety of time frames. Just look for local highs/lows in the RSI that "diverge" from the corresponding local highs/lows in price. Below is an example of a divergence and a hidden divergence. There is a bearish and bullish flavor of each type of divergence.
Overbought/Oversold conditions
Probably the most common use of RSI is to determine whether and asset is overvalued or undervalued. In general, an asset is considered overbought when RSI is greater than 70, and oversold when RSI is less than 30. This is a dangerous rule to follow blindly though, because the rest of the context is important. Here are a couple tips/caveats:
(1) Each asset has a different "normal" RSI range. i.e. one asset might be overbought at RSI = 70, but another could ride well above 70 for some time before coming down to earth.
(2) The macro trend matters. A lot. Zoom out and see which way the market is trending. In a bull market, RSI may ride close to the oscillator's upper bounds and not touch "oversold" territory for a while. And vice-versa in a bear market. If the market is ranging, you can feel better about trusting the 70/30 "rule".
Take a look at the charts below. In one, you see a bitcoin bull market, where BTC soars way above 70, and stays above the midpoint (50) for the duration of the run. If you had sold when bitcoin first hit "overbought" territory >70, you would have missed out on >3800% gains! In the other chart, you see the S&P500 during the 2008 bear market. We see values <30 a number of times without ever seeing anything above 70. So if you bought when the index first went below 30, you would have potentially exposed yourself to almost a 50% decline.
Breakouts/Breakdowns
Just like patterns in price, RSI follows trendlines and patterns as well. RSI breakouts aren't much help on their own (as it's often too late by the time you spot one), but they can help confirm price breakouts, or increase your confidence in another trading idea.
What are your favorite RSI use-cases? What other indicators does it work best in confluence with? Do you have another favorite indicator that you think can contend with the king? Feel free to share your thoughts in the comments.
Relative Strength Index (RSI)

BTC daily RSI not oversold has more chances to break support atkhi there, dear fellows.
we believe this 18k test has better chances to breakout this support since as compared to previous test
RSI is not oversold as compared
BTC has way more volume right now
Best regards.

How to trade using the CSC-HARSI "The Real Way"Welcome to The coffee shop. this is your host and Barista Eric. This podcast is designed to teach you the technical analysis that you should know so you can stay out of false trades in your Crypto endeavors. It's a platform where I get to release my edits of popular indicators. I'll show you how to use them, and of course from time to time I will call out really bad strategies because I don't want you guys to have bad information. Feel free to share this content where you choose and of course do Not fall for scams. I will not approach you online asking you for crypto assets Lending or any type of financial support. But bear in mind that doesn't mean I don't like talking with you guys because from time to time you will find a message from me saying hey how you do when they want to get close to you.
So it's been a while since the CSC-HARSI has been released and I think it's time I do a quick video on an entry and exit for a buy and sell on this indicator.
It has been requested by dozens of you weekly and I have seen all of the videos online on the improper way to use the old version of this indicator. Since the new one is out and it works basically on beast mode I want you guys to be using this to its fullest potential.
today's video is based on using the VWAP as the moving average against the RSI.
So let's just jump right in and get started.
go ahead and open your chart and tradingview
Search fo rCSC-HARSI, or "Coffeeshopcrypto"
Add the indicator to your chart and keep the default settings
open the settings wheel and go to the inputs tab
scroll down to RSI moving average settings and change the ma type to vwap.
Okay that's it you're ready to go and now let's talk about the rules for a long and short trade.
As you do with any chart and any day that you're going to start your trading the first thing you do is you set up your support and resistance level. Personally I do this on a 4-Hour chart. I recommend setting your support and resistance levels initially when you open your chart on a time frame 1 to 2 * above the one you're using.
for example I do my trading on a 1 hour chart so my support and resistance levels are usually set on a 4-Hour chart
Lucky for you the indicator tells you where those things are however you may want to set up your extreme levels as well. You can do that by looking at extreme points of swinging price on your chart and just put a level they're at the top and another at the bottom.
STOCHASTIC IMPORTANCE:
Before we get started let me discuss something very briefly with you about the level of the Stochastic in the indicator. The scale on the right side of the indicator is mainly designed for the stochastic to tell you how hard things are pressing on the gas. In other words if the stochastic is anywhere from zero to 50 There is almost no movement on price. However, once the stochastic is doing anything above the 50 all the way to the 100, the closer it is to 100 the more Force there is in the market. you have to remember that the Stochastic RSI was designed to be a faster RSI.
So if the stochastic is green "Bullish" and moving upwards over 70 there is A LOT of force to the upside..
If it is RED "Bearish" and it's under 50 there is a lot of force to the downside. The closer it is to ZERO the more force there is.
The strategy that I used to enter and exit using this indicator falls under these particular rules:
SHORTS:
1. The stochastic must be in a downtrend.
2. the RSI must be below its moving average.
3. The RSI must be below 50
4. Heikin Ashi candles must be red.
5. The Heikin Ashi candle must open above the moving average and close below the moving average.
6. The most optimal move is when the candle opens above the 60 and closes below the 60 while crossing the moving average.
An alternative to rule six is; If your candle opens above the 50 and above the moving average but close is below both of them at the same time this is also an entry.
Now obviously the rules for getting into long positions are exactly the opposite.
First things first, always take a look at your support and resistance levels that you set up ahead of time.
The second thing is to check your moving averages.
I commonly use a 50 and a 100. Exponential moving average.
If you are using scalping time frames which are anything from the 30 minute and Below then I would suggest using a 20 period Moving average and a 50 period Moving average.
LONG POSITIONS RULES:
1. The stochastic must be in an uptrend.
2. the RSI must be above its moving average.
3. The RSI must be above 50
4. Heikin Ashi candles must be green.
5. The Heikin Ashi candle must open below the moving average and close above the moving average.
6. The most optimal move is when the candle opens below the 40 and closes above the 40 while crossing the moving average.
7. Alternate to rule six is; If your candle opens below the 50 and above the moving average but close is above both of them at the same time this is also an entry.

NZDJPY - After bearish run, yet..After a bearish run, the market does respect the support level but fails to push RSI to the oversold region, which became a concern for me to engage in my initial trading ideas.
I will wait for further confirmation before engaging on the trade.

DXY is looking weak After massive rally DXY is currently looking bearish. it has formed bearish divergence on weekly and daily timeframe. which isn't good indication for DXY.
We might see a little bit correction before breaking out of 110 zone. trend is currently slowing down.
TVC:DXY

Using S/R levels to draw trend lines (and) the CSC-HARSI UpdateWelcome back to the coffee shop everybody. This is just a quick update to the csc-HARSI indicator, And a video to show you how you can use its indications to draw your trend lines so you know when your price or trend is broken. So if you already have the csc-HARSI on your charts go ahead and delete it from your chart and then go through tradingview indicators and look for coffee shop crypto or the CSC-HARSI 2022.
Okay okay you talked me into it here's a link.
This is key to know when you are not only breaking your support and resistance levels with price but when price also breaks your trend lines which is a secondary confirmation.
Add to that you can see when price will actually retrace and come back and test off of your trend line. Which is a problem that many Traders have because price actually pulls back to their support or resistance level right through it slightly and put them into fear make them get out of their trailer early thinking that price is going the other way but it's actually tracing back to a trend line that is behind your support or resistance level.
This update in the CSC-HARSI comes because I was working on something in the Heiken Ashi Algo and decided to take a piece of the code that I just came up with and put it into the CSC- HARSI so you can use it now instead of waiting for the ALGO to be ready.
Take a look at the video and let me know if you have any questions whatsoever.
Also in this video I got a little carried away showing you my double sarcastic strategy based off the regular stochastic RSI and a stochastic which I have created. Both of the stochastics will be available in the Heiken Ashi Algo. It will not only tell you that price is moving in a particular direction but it will also tell you as soon as the momentum of that direction is diminishing so you can get out before getting caught in a trap or in a range.
Knowing what to look for in this double stochastic strategy will also help you avoid getting into a bullish or bearish move that looks like the market is moving in a particular direction when it's actually moving into a liquidity trap.
Don't bother going online looking for this particular double stuck hectic strategy or indicator because it doesn't exist. The only reason it doesn't exist is because again it's using a secondary stochastic which I have created Which will only be available in the Heiken Ashi Algo Oscillator.

GBPNZD 15m chart, Bullish Direction15m RSI Divergence for entry here. Got a 25pip stop and targeting 1:3RR.

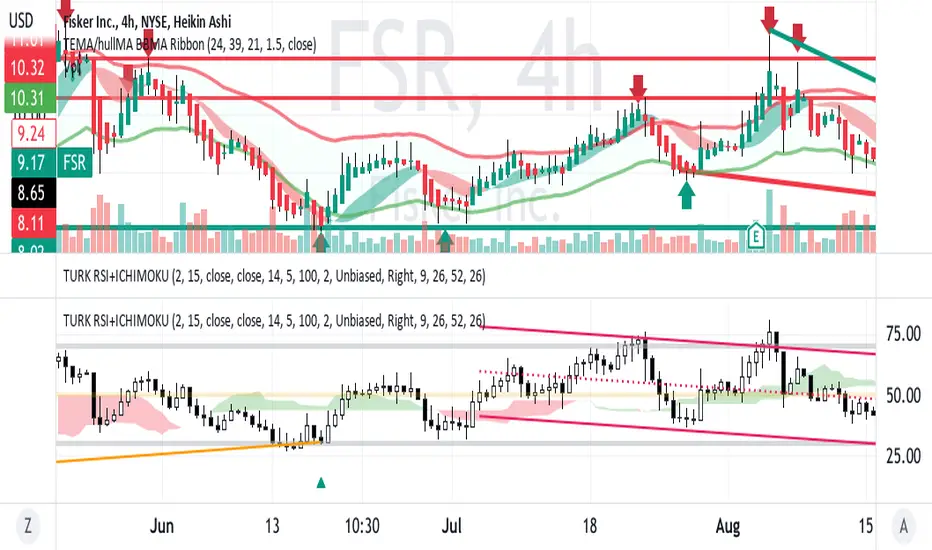
FSR breaks out of Descending Triangle LONGNYSE:FSR
On the 4H chart with trendlines drawn FSR is trending up out of the triangle.
The RSI with Ichimoku indicator shows the confirmatory increasing relative strength
in a move from under to over the cloud.
All in all, this appears to be a swing long set up with a near upside of 20 %
or about $12 .
NRT- European Energy PlayNRT an oil trust stock, is up 75 % for the year despite global challenged market. It is in the middle of its trading range for the past 12 months.
Given the situation in Europe and lack of Russian oil in the free global oil market. I see this as a long-term swing play on energy with
upside heading into the European winter heating season. With the RSI between 40-50% this market is not oversold or bought.

GBPJPY Key Swing High| .618 Fibonacci| Price Action| Trend Evening Traders,
Today’s analysis – GBPJPY – trading towards key swing high area where a rejection is possible,
Points to consider,
- .618 Fibonacci Resistance
- Key Swing High Liquidity
- POC Objective
- Price Action Rotation
GBPJPY’s immediate price action is trading towards liquidity pool with the .618 Fibonacci in confluence, allowing for a bearish bias.
The POC is the immediate objective; exceeding this level will lead to a deeper pull back.
Price action is to be used upon discretion/ management when executing this trade, invalidation is multiple candles closes below the POC.
Hope this analysis helps, thank you for following my work and remember,
“Never let a win go to your head, or a loss to your heart.” – Chuck D.

GBPUSD bearish Pennant below resistance levelForming the pennant near resistance level increases the chance of falling price.
Also RSI shows the uptrend momentum is not strong and it may be ending.
I see the blue line as the first level to reach, where you can trail your stoploss and let the price go more down without further risk.

AVAXUSDT Range High Retest| .618 Fiboancci|Monthly S/R| Trend Evening Traders,
Today's analysis - AVAXUSDT- trading above its range high support, consolidating here is a bullish sign
Points to consider,
- Price action corrective
- Range High Support
- Declining Volume
- .618 Fibonacci Confluence
AVAXUSDT's immediate price action is resting on a support zone that is in technical confluence with the range high and the .618 Fibaoncci, allowing for a bullish bias.
the volume is on a decline, it needs to increase on the expansion, this will solidify the move
Price actions objective will be the Monthly S/R, exceeding this level will lead to a trend continuation.
price action is to be used upon discretion/ management, hope this analysis helps !
“Trading is buying and selling to exploit a change in the price. Investing is acquiring assets for economic reasons.”
― Naved Abdali

Bullish divergence on DOCUBuy low, sell high.....
Bullish divergence using RSI. REALLY good volume last week, WITH a gap. Definitely an accumulation phase.

GBPAUD Correct PA| POC Support| PA Range Evening Traders,
Today's Analysis - GBPAUD's - trading with corrective price action that will lead to a bounce
Points to conside,
- price action corrective
- local range low lost
- nPOC Support
- range reclaim = deviation
GBPAUD's immidiate price action is trading at a key support that is the nPOC, a bounce here with a reclaim of the local range will confirm a deviation, this will allow for a bullish bias.
the immediate objective will then become the .618 Fibaoncci of the recent impulsive leg down.
price action is to be used upon discretion/ management when executing this trade
hope this analysis helps, thank you for following my work and remember,
“Trading doesn't just reveal your character, it also builds it if you stay in the game long enough.”
― Yvan Byeajee

RSI Crash Course - Why Most People Get REKTHere is a quick crash course on how I use the RSI along with Elliott Waves.
- Using the 20, 30, 40, 60, 70, 80 levels within the context of the trend to spot entries
- How to spot uptrends and downtrends with support and resistance
- How to spot big 3rd wave moves
- Using divergences to spot the end of a trend
This can be used on any time-frame but I just use it on the daily for this example
Like anything in trading, the RSI is more complex than most people first suspect. However, I hope this tutorial simplifies it enough for you to improve your trading
P.S. Video cuts out part way into my example, but you get the full tutorial and setup on how I use the RSI
Hope you have a great day trading,
Tchau

HAL - Price Action Analysis NYSE:HAL has made Bearish Cypher with PRZ level 0.786 at the price 26.10.
Price has already made confirmation in last day and RSI also indicated divergence.
BUY:
above 29.35 gives buy opportunity.
SELL:
Bellow 26 , Price creates further correction.

GME: RSI Update, Dip Before the RipGood morning,
Last time we fell below the 30 mark on the RSI we saw a 90%+ move up and the other two times it fell to this level we saw 50-100%+ move up as well. I'm factoring in a 60%+ move up as this is like a spring that has been compressed and is ready to explode. I also overlayed November 2021 cycle and it looks like we're following that perfectly.
Downside PT: 22.12 / 21.87 (support)
Upside PT: Fill the gap at 27, 37 and 40.
As always, NOT financial or sexual advice. Good luck!

GME: RSI Low Will Shoot Us Back to 40$Good afternoon,
Since the golden cross on Sept 2020, we managed to hit the lows of the RSI (30) about 5 times, each time we bounced back up sometimes upwards of up to 50+%, and now we're now heading into our 6th low on the RSI. We are looking to fill the gap at 37 and 40 but we could also have more downside potentially bottoming at 22.
As always, not financial or sexual advice. Good luck!

Long setup USD/CHFOn the 1 day touching the golden fib ratio + touching a support zone, on the 15 min tf also strong bullish divergence. RR = 2

EURUSD Monthly S/R Support| Price Action| Trend Evening Traders,
Today's analysis,
EURUSD - trading towards a key resistance level where a bearish retest is possible,
Points to consider,
- Price Action Corrective
- POC S/R Resistance
- .618 Fibaoncci Resistance
- Bearish OB Resistance
- Low Volume
EURUSD's immediate price action is corrective, the bounce is on low volume and approaching a key trade location with resistance confluence, this allows for a bearish bias.
The resistance is the .618 Fibonacci, POC S/R and a Bearish OB, price action is likely to have a rejection of this level, a reclaim will be a strong bullish sign, invalidating the trade.
The objective is the lower Daily S/R support and the overall Monthly S/R
Price action is to be used upon discretion/ management, hope this analysis helps
remember,
"Amateurs think about how much money they can make. Professionals think about how much money they could lose."
–Jack Schwager.

CTRA Energy Stock Cup and HandleCTRA is showing a cup and handle on the daily chart now with the handle underway.
The Bull/Bear power indicator is at zero showing some equilibrium.
The RSI / Ichimoku indicator shows relative strength sitting on cloud support.
I see this as a good swing long setup and will take a trade when I see spot oil and natural
gas uptrending.

DXY Macro LevelsDXY RSI compared to BTC
DXY/RSI bottoms mark the BTC top. Conversely, BTC bear markets generally occur when the DXY ranges before it drops and the bull market starts.
The multi diagonal and horizontal trending resistance should offer a solid rejection given how hot the dollar came into this zone. The inevitable fed pivot may just provide that drop-off we need for the macro trend to reverse.

DJI RSI overbought Bullish run in a bearish market?
Or
Berish market is over?
RSI is overbought and every time we got this indicator we saw a run down.
What do you think?
Just an idea.
