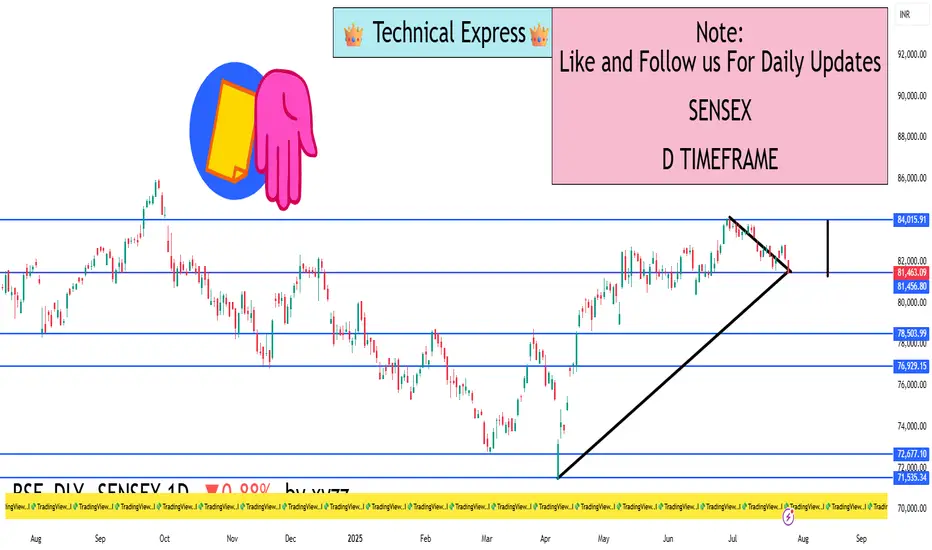
SENSEX 1D Timeframe📉 SENSEX Daily Overview (as of July 25, 2025)
Current Price: Around 81,460
Daily Change: Down by approximately 720 points (–0.9%)
Day’s High: About 82,070
Day’s Low: About 81,400
Previous Close: Around 82,184
📊 1-Day Candlestick Analysis
The candle for today is bearish, indicating strong selling pressure.
The price opened near previous levels but faced resistance at around 82,000.
Sellers dominated most of the day, pushing the index toward the 81,400 support zone.
🔍 Key Support and Resistance Levels
Level Type Price Range
Resistance 82,000 – 82,200
Support 81,400 – 81,000
If Sensex breaks below 81,400, the next target could be around 80,500 or 79,900.
If it holds above support and bounces, it could retest 82,200.
🧠 Technical Trend Analysis
Short-Term Trend: Bearish
Medium-Term Trend: Neutral to mildly bullish (as long as above 80,000)
Market Structure: Lower highs forming, suggesting pressure building on bulls
Indicators (assumed):
RSI may be approaching oversold
MACD likely showing bearish crossover
Volume increasing on red candles—indicating strong sell interest
📌 Sentiment & Market Context
Financial stocks (like banking, NBFCs) are under pressure.
Global cues (such as interest rate uncertainty and geopolitical concerns) are impacting investor confidence.
FII outflows and weak earnings in key sectors are adding to bearish momentum.
The broader trend remains range-bound, but with short-term downside bias.
✅ Strategy Suggestions (For Traders & Investors)
Swing Traders: Wait for a reversal candle (like a bullish engulfing or hammer) before considering long positions.
Breakout Traders: Watch for breakdown below 81,000 for continuation of the fall.
Positional Traders: Can wait to enter near 80,000–79,500 if the market holds that key level.
🔄 Summary
SENSEX is under pressure with a drop of 720+ points.
Technical structure suggests caution, especially if 81,000 breaks.
Support: 81,000 – 80,500
Resistance: 82,000 – 82,200
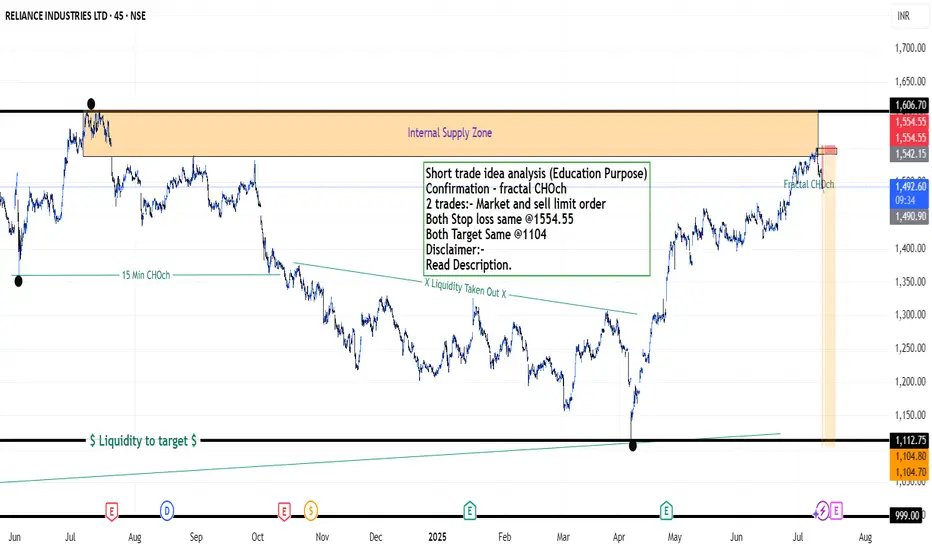
RELIANCE
Reliance Industries Stock(India) - {11/07/2025}Educational Analysis says that Reliance Industries (Indian Stock) may give trend Trading opportunities from this range, according to my technical analysis.
Broker - NA
So, my analysis is based on a top-down approach from weekly to trend range to internal trend range.
So my analysis comprises of two structures: 1) Break of structure on weekly range and 2) Trading Range to fill the remaining fair value gap
Let's see what this Stock brings to the table for us in the future.
DISCLAIMER:-
This is not an entry signal. THIS IS FOR EDUCATIONAL PURPOSES ONLY.
I HAVE NO CONCERNS WITH YOUR PROFITS OR LOSS,
Happy Trading,
Stocks & Commodities TradeAnalysis.
My Analysis is:-
Short term trend may be go to the external demand zone.
Long term trend breaks the new high after going from discount zone.
Short trade idea analysis (Education Purpose)
Confirmation - fractal CHOch
2 trades:- Market and sell limit order
Both Stop loss same @1554.55
Both Target Same @1104
Please check the comment section to see how this turned out.
What to do with Reliance share after its drubbing today? Reliance looks weak post result however there is no spike in volume of sale that is a good point. The levels from which Reliance can recover seem to be 1427, 1370 or 1323. If we get a closing below 1323 the stock can fall to 1217 or even 1160 levels this is the reading as of now.
The result was looking good but on deeper scrutiny it was understood that major chunk was profit was due to sale of Reliance stake in Asian Paints business. This I think is not liked by the market specially the retail investors.
The stock has tanked close to 3% as of now but there is no huge selling seen from HNIs or MFs (As of now). (This is an assumption looking at the volume of sale) Volumes are similar to normal day of trade.
May be as retail investors panic MFs, HNIs and others might gulp the stock. Cant say clearly. We might reanalyze by end of the day but caution: Do not sell Reliance in Panic. Result was average it was not bad even if we ignore the Asian paint factor so. Currently I am not selling Reliance I am holding on to it. Might add at lower levels.
Disclaimer: The above information is provided for educational purpose, analysis and paper trading only. Please don't treat this as a buy or sell recommendation for the stock or index. The Techno-Funda analysis is based on data that is more than 3 months old. Supports and Resistances are determined by historic past peaks and Valley in the chart. Many other indicators and patterns like EMA, RSI, MACD, Volumes, Fibonacci, parallel channel etc. use historic data which is 3 months or older cyclical points. There is no guarantee they will work in future as markets are highly volatile and swings in prices are also due to macro and micro factors based on actions taken by the company as well as region and global events. Equity investment is subject to risks. I or my clients or family members might have positions in the stocks that we mention in our educational posts. We will not be responsible for any Profit or loss that may occur due to any financial decision taken based on any data provided in this message. Do consult your investment advisor before taking any financial decisions. Stop losses should be an important part of any investment in equity.

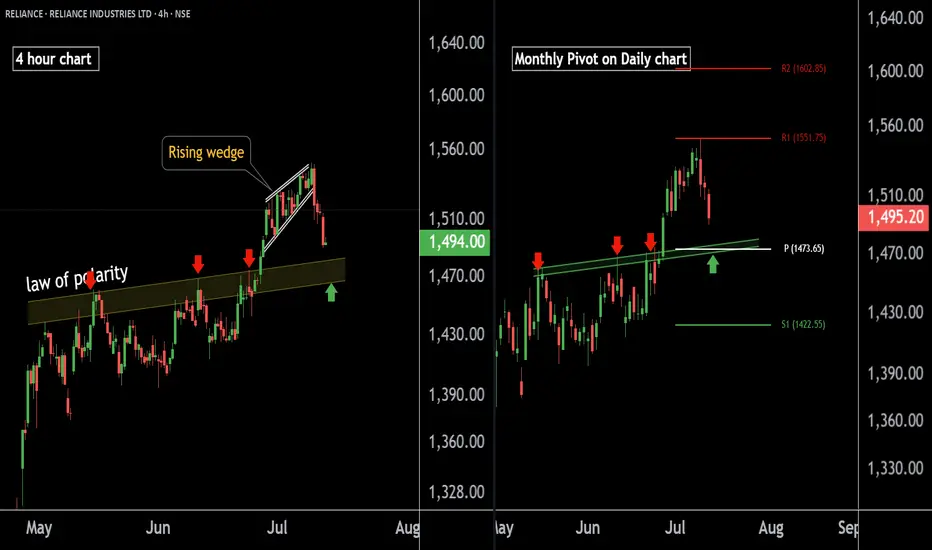
RELIANCE INDUSTRIES at Best Support !! Keep It On Your Radar !!There are two chart of RELIANCE INDUSTRIES on Daily and 4 hour Timeframe.
On the 4-hour timeframe, Reliance is likely to respect its LOP (Line of Polarity) as support, with the support range near 1460-1475.
On the Daily timeframe, the monthly pivot is also positioned around 1473, reinforcing this level as a potential halt or reversal zone.
If this level is sustain we may see higher prices in RELIANCE INDUSTRIES.
Thank You !!!
Sector Rotation Strategy🌐 Sector Rotation Strategy: A Smart Way to Stay Ahead in the Stock Market
What Is Sector Rotation?
Imagine you're playing cricket. Some players shine in certain conditions — like a fast bowler on a bouncy pitch or a spinner on a turning track. The same idea applies to stock market sectors.
Sector Rotation is the process of shifting your money from one sector to another based on the market cycle, economic trends, or changing investor sentiment.
In simple words:
"You’re moving your money where the action is."
First, What Are Sectors?
The stock market is divided into different sectors, like:
Banking/Financials – HDFC Bank, Kotak Bank, SBI
IT– Infosys, TCS, Wipro
FMCG – HUL, Nestle, Dabur
Auto – Maruti, Tata Motors
Pharma – Sun Pharma, Cipla
Capital Goods/Infra – L&T, Siemens
PSU – BEL, BHEL, HAL
Real Estate, Metals, Energy, Telecom, etc.
Each sector behaves differently at various stages of the economy.
Why Is Sector Rotation Important?
Because all sectors don’t perform well all the time.
For example:
In a bull market, sectors like Auto, Capital Goods, and Infra usually lead.
During slowdowns, investors run to safe havens like FMCG and Pharma.
When inflation or crude oil rises, energy stocks tend to do better.
When interest rates drop, banking and real estate might shine.
So, instead of holding poor-performing sectors, smart investors rotate into the hot ones.
How Does Sector Rotation Work?
Let’s say you are an investor or trader.
Step-by-step guide:
Track the economy and markets
Is GDP growing fast? = Economy expanding
Are interest rates high? = Tight liquidity
Is inflation cooling down? = Growth opportunity
Observe sectoral indices
Check Nifty IT, Nifty Bank, Nifty FMCG, Nifty Pharma, etc.
See which are outperforming or lagging.
Watch for news flow
Budget announcements, RBI policy, global cues, crude oil prices, etc.
E.g., Defence orders boost PSU stocks like BEL or HAL.
Move your capital accordingly
If Infra and Capital Goods are breaking out, reduce exposure in IT or FMCG and rotate into Infra-heavy stocks.
Real Example (India, 2024–2025)
Example: Rotation from IT to PSU & Infra
In late 2023, IT stocks underperformed due to global slowdown and US recession fears.
Meanwhile, PSU and Infra stocks rallied big time because:
Government increased capital expenditure.
Defence contracts awarded.
Railway budget saw record allocations.
So, many smart investors rotated out of IT and into:
PSU Stocks: RVNL, BEL, HAL, BHEL
Capital Goods/Infra: L&T, Siemens, ABB
Railway Stocks: IRFC, IRCTC, Titagarh Wagons
This sector rotation gave 30%–100% returns in a few months for many stocks.
Tools You Can Use
Sectoral Charts on TradingView / Chartink / NSE
Use indicators like RSI, MACD, EMA crossover.
Compare sectors using “Relative Strength” vs Nifty.
Economic Calendar
Track RBI policy, inflation data, IIP, GDP, etc.
News Portals
Moneycontrol, Bloomberg, ET Markets, CNBC.
FIIs/DII Activity
Where the big money is going – this matters!
Sector Rotation Heatmaps
Some platforms show weekly/monthly performance of sectors.
📈 Sector Rotation Strategy for Traders
For short-term traders (swing/intraday):
Rotate into sectors showing strength in volumes, price action, breakouts.
Use tools like Open Interest (OI) for sector-based option strategies.
Example:
On expiry weeks, if Bank Nifty is showing strength with rising OI and volume, rotate capital into banking-related trades (Axis, ICICI, SBI).
Sector Rotation for Long-Term Investors
For investors, sector rotation can be used:
To reduce drawdowns.
To book profits and re-enter at better levels.
To ride economic trends.
Example:
If you had exited IT in late 2022 after a rally, and entered PSU stocks in early 2023, your portfolio would’ve seen better growth.
Pros of Sector Rotation
Better returns compared to static investing
Helps avoid underperforming sectors
Takes advantage of macro trends
Works in both bull and bear markets
Cons or Risks
Requires monitoring and active management
Timing the rotation is difficult
Wrong rotation = underperformance
May incur tax if frequent buying/selling (for investors)
Pro Tips
Don't rotate too fast; let the trend confirm.
Use SIPs or staggered entry in new sectors.
Avoid “hot tips”; follow actual price and volume.
Blend sector rotation with strong stock selection (don’t just chase sector).
Conclusion
The Sector Rotation Strategy is one of the smartest, most practical tools used by both traders and investors. You don’t need to be a pro to use it — just stay alert to the market mood, economic cycles, and where the money is moving.
Think of it as dancing with the market:
“When the music changes, you change your steps.”
Keep rotating. Keep growing.
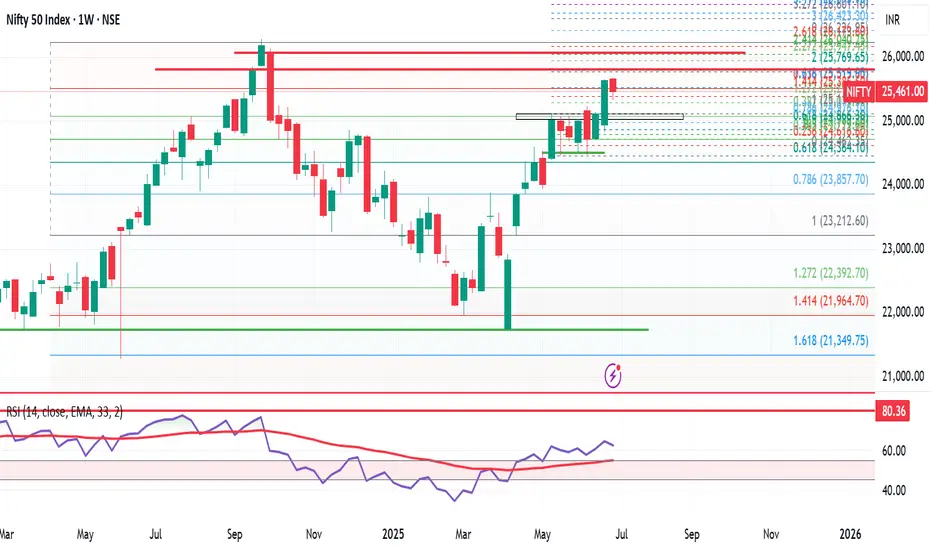
Nifty Wkly Update: Market Cools Off,But Bulls May Regain ControlNifty closed the week at 25,461, down 176 points from last week's close. It touched a high of 25,669 and a low of 25,331—a clear sign of consolidation and short-term correction.
As I highlighted last week, it was a smart move to book partial profits or trail your stops, especially after the strong upmove. And here we are—a healthy pullback, exactly what we anticipated.
But things are about to get interesting...
Reliance, the heavyweight of Nifty, is turning bullish on the monthly chart—a strong signal for potential upside. As long as Reliance remains bullish, it's wise to focus on bullish opportunities only.
Nifty Outlook for Next Week:
Expected Range: 25,000 – 25,900
Strategy: Buy on dips while Reliance stays strong.
Sentiment: Cautiously bullish
Global Cue: S&P 500 Hits All-Time High!
The S&P 500 closed at a record 6,279, up nearly 100 points from last week. If it breaks above 6,284, we could see a rally toward:
6,376
6,454
6,500
6,568 (key level to watch)
However, a break below 6,177 could pull it back to 6,050/6,040.
My take: S&P 500 is in beast mode, and as it climbs, it’s likely to drag Nifty higher too. The broader market is turning bullish—momentum is shifting in favor of the bulls.
Final Thought:
Bulls are loading their guns, and bears might want to take a nap for the next 10–15 days. The trend is your friend—for now, let the bulls enjoy the ride!
RELIANCEi Observed these Levels based on Price Action and Demand & Supply which is my own Concept "PENDAM CONCEPTS"... Please don't take any trades based on this chart/post... Because this chart is for educational purpose only not for Buy or Sell Recommendation... Thank Q

RELIANCE LTD – 1H TIME FRAME ANALYSIS📊 NSE:RELIANCE – 1H TIME FRAME ANALYSIS
A symmetrical triangle pattern is forming on Reliance's 1-hour chart, showing a consolidation phase. This pattern is neutral in nature, meaning a breakout can occur in either direction, but the setup provides a great opportunity for a breakout trade.
The price is now at the apex of the triangle, indicating a potential breakout in the upcoming sessions. Watch for a strong move backed by volume.
TRADE PLAN :
Chart Pattern: Symmetrical Triangle
Timeframe: 1 Hour
Stock: Reliance Industries Ltd (NSE)
🔼 Long Trade (Breakout above 1430.55)
Entry: Above 1,430.55 (candle close with volume confirmation)
Target 1: 1,458.35
Target 2: 1,479.35
Stop Loss: Below 1,417
🔽 Short Trade (Breakdown below trendline):
Entry: Below triangle breakdown with strong red candle
Target 1: 1,397.55
Target 2: 1,368.25
Stop Loss: Above 1,430
Note: Avoid entering during the triangle zone. Trade only post-confirmation of breakout/breakdown with volume.
Disclaimer: This analysis is for educational purposes only. Please consult your financial advisor before making any trading decisions.

RELIANCE : Completing correction, ready to bounce back🚀 Trading Opportunity: Reliance Industries Ltd. (NSE: RELIANCE) -
⏱️ Timeframe: 1 Day (1D)
💰 Current Price: ₹1,175.60
🎯 Swing Target Zone: ₹1,374 - ₹1,565 🏆
🛡️ Support Level: ₹1,182.10
🛑 Stop Loss: ₹1,159.00 (Day Close Below) 📉
🔍 Wave Analysis:
📈 The chart indicates a completed corrective wave (primary) 5 on the daily chart. This suggests a potential end to the downtrend and the start of an upward move.
🔄 We observe a corrective wave (A), followed by a potential reversal at (B), and a completed intermediate correction wave 5.
💥 The breakout at point (2) signals the start of wave (C), aiming for the swing target zone of ₹1,374-₹1,565. 🎯
💪 Current support near ₹1,182.10.
⚠️ Daily close below ₹1,159.00 invalidates the wave count and the setup. ❌
📊 Strategy:
✅ Entry: Enter near current market prices (around ₹1,175.60). 🛒
🔒 Risk Management: Set stop loss at ₹1,159.00 (daily close) to limit downside. 📉
💸 Exit: Aim for profits within the swing target zone of ₹1,374-₹1,565, aligning with the wave (C) target. 🏆
#Trading 📈 #StockMarket 💰 #RELIANCE 🏭 #TechnicalAnalysis 🧐 #Investing 💼 #ElliottWave
⚠️ Disclaimer: I am not a financial adviser; please consult one. Don't share information that can identify you. ⚠️

bull run may continue tomorrow in Reliance Industries.Reliance Industries Stocks price escaped from equilibrium zone today. It tried twice to continue bull run but price failed today and it again approaching to the zone again. But if tomorrow it opens above 1462 and stays above this level we may take bullish trade and our first target will be 1462
Entry 1440
Target 1462

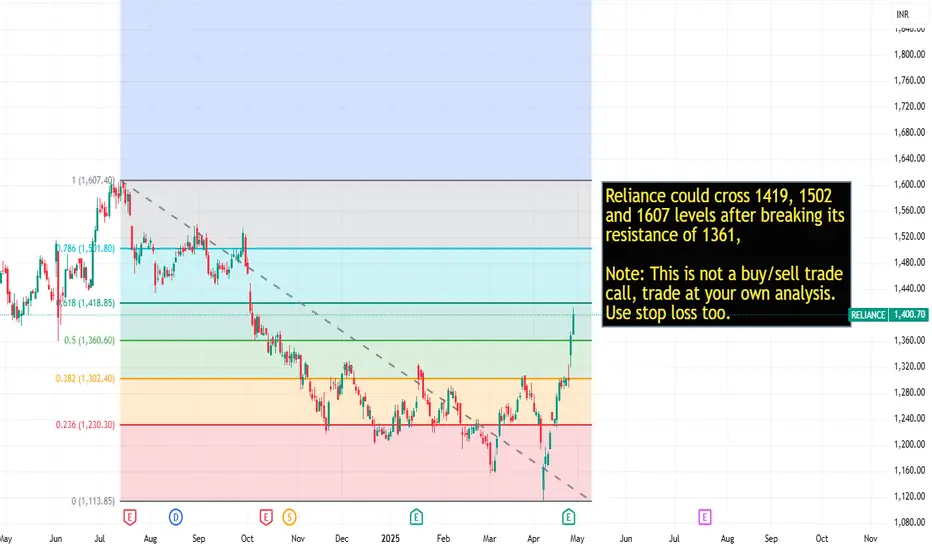
Reliance key levels after breakout of 1361Reliance could cross 1419, 1502
and 1607 levels after breaking its
resistance of 1361,
Note: This is not a buy/sell trade
call, trade at your own analysis.
Use stop loss too.
Live buying signal in Reliance at 1348Live signal in Reliance at 1348 Khareedo (Buy), Lets see how long it will go up.
Note: This is not a buy/sell trade call. Use stop loss.

Reliance is into bullish zoneMy custom designed indicator names Jin ka Bacha generated signal at price level of 1291 "Khareedo" means to buy, I noticed late and posting now about it, It go to 1325 after signal generated,
Note: This is not a buy/sell call, trade at your own will and use stop loss.

Reliance is near to breakout 1346 levelAfter long time reliance is near to breakout level to enter is bullish zone. Breakout level is 1346 and key levels are 1358, 1416, 1489 and 1606.
Note: This is not a buy/sell trade call. Trade at your own will and use stop loss.

Reliance Industries Ltd view for Intraday 23rd April #RELIANCEReliance Industries Ltd view for Intraday 23rd April #RELIANCE
Resistance 1280 Watching above 1285 for upside movement...
Support area 1250 Below 1270 ignoring upside momentum for intraday
Watching below 1245 for downside movement...
Above 1270 ignoring downside move for intraday
Charts for Educational purposes only.
Please follow strict stop loss and risk reward if you follow the level.
Thanks,
V Trade Point

RELIANCE INDUSTRIES LTD short dayThe stock of Reliance Industries is currently exhibiting a clear bearish tone. Price action continues to show weakness, with repeated failed attempts to recover, signaling that sellers remain in control.
The ongoing downward movement suggests a lack of confidence from market participants, with no strong catalysts visible to shift momentum. Selling pressure dominates, while any bounce attempts struggle to hold.
Unless there's a visible change in price behavior or a shift in sentiment, the overall outlook remains negative. Caution is advised, and buyers may want to wait for clearer signs of stability before considering entry.
Reliance Industries📈 Reliance Industries Breakout Alert – ₹1241 Key Level Breached 🚀
Reliance Industries has successfully broken out above a strong resistance zone near ₹1241, indicating a potential bullish move ahead. This level acted as a critical supply zone in the past, and the breakout with volume confirmation adds strength to the trend.
🔍 Technical Highlights:
Breakout Level: ₹1241
Volume: Above average (confirming strength)
Trend: Bullish
Next Resistance Zones: ₹1265 / ₹1290
Support Zones: ₹1220 / ₹1200 (previous resistance now acting as support)
Reliance Breakout?📈 Reliance Industries Breakout Alert – ₹1241 Key Level Breached 🚀
Reliance Industries has successfully broken out above a strong resistance zone near ₹1241, indicating a potential bullish move ahead. This level acted as a critical supply zone in the past, and the breakout with volume confirmation adds strength to the trend.
🔍 T echnical Highlights:
Breakout Level: ₹1241
Volume: Above average (confirming strength)
Trend: Bullish
Next Resistance Zones: ₹1265 / ₹1290
Support Zones: ₹1220 / ₹1200 (previous resistance now acting as support)

balmlawrie in buyfundamentally its in under value also near margin of safty
the zone is retracement demand zone so it may react in this zone
NOTES: WE CANT POST ANY ACCURATE ENTRY ON PUBLICE DUE TO SEBI RULES
telegram.me

Above 1200 Reliance can move upward otherwise it will be bearishYt - chartpatern - YT - @chartpatern
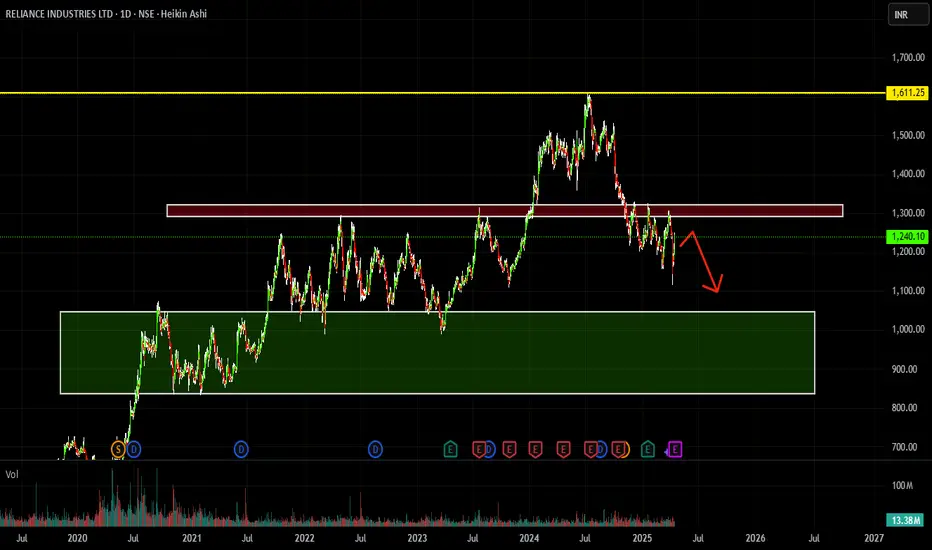
As of March 4, 2025, Reliance Industries Ltd. (RIL) shares closed at ₹1,161.70, reflecting a 0.80% decrease from the previous day. This positions the stock approximately 27.80% below its 52-week high of ₹1,608.95, achieved on July 8, 2024.
Your observation that RIL's stock may exhibit bullish behavior above ₹1,200 and bearish tendencies below this threshold aligns with recent performance. The stock's current price is marginally below this pivotal level, suggesting potential bearish momentum.
Analyst sentiment remains optimistic, with a consensus rating of 'Buy' and a median price target of ₹1,559, indicating a potential upside of approximately 24.38% from current levels.
In summary, while RIL's stock is trading below the ₹1,200 mark, indicating possible bearish trends, the prevailing analyst outlook suggests confidence in the company's long-term performance.

INV H&S IN RELIANCE IN FORMATIONInv H& S expected
Gap Filling till 1275
Todays Closing Imp... idea invalid if closing below 1260 on DCB
Dip Buying till gap filling 1275


tata steel in buytata steel is pure vaule stock
so current a nifty in side ways upside tata steel will give M pattern @184 from 130 then it will come under book value that mean
72.2 tata steel book value
1st buy zone 130 trg 184
2nd buy zone 70-50 trg 260
margin of safety 35 trg 277
