Reliance Industries Stock(India) - {11/07/2025}Educational Analysis says that Reliance Industries (Indian Stock) may give trend Trading opportunities from this range, according to my technical analysis.
Broker - NA
So, my analysis is based on a top-down approach from weekly to trend range to internal trend range.
So my analysis comprises of two structures: 1) Break of structure on weekly range and 2) Trading Range to fill the remaining fair value gap
Let's see what this Stock brings to the table for us in the future.
DISCLAIMER:-
This is not an entry signal. THIS IS FOR EDUCATIONAL PURPOSES ONLY.
I HAVE NO CONCERNS WITH YOUR PROFITS OR LOSS,
Happy Trading,
Stocks & Commodities TradeAnalysis.
My Analysis is:-
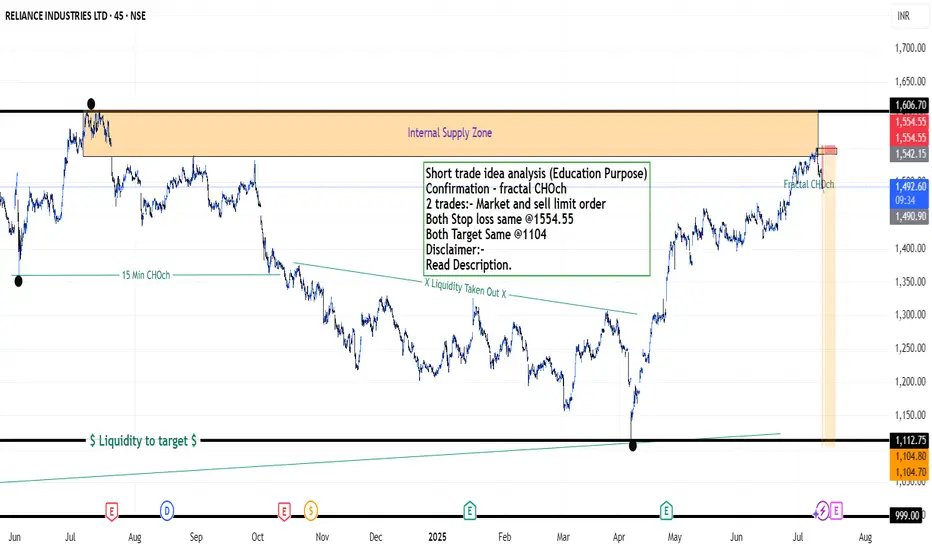
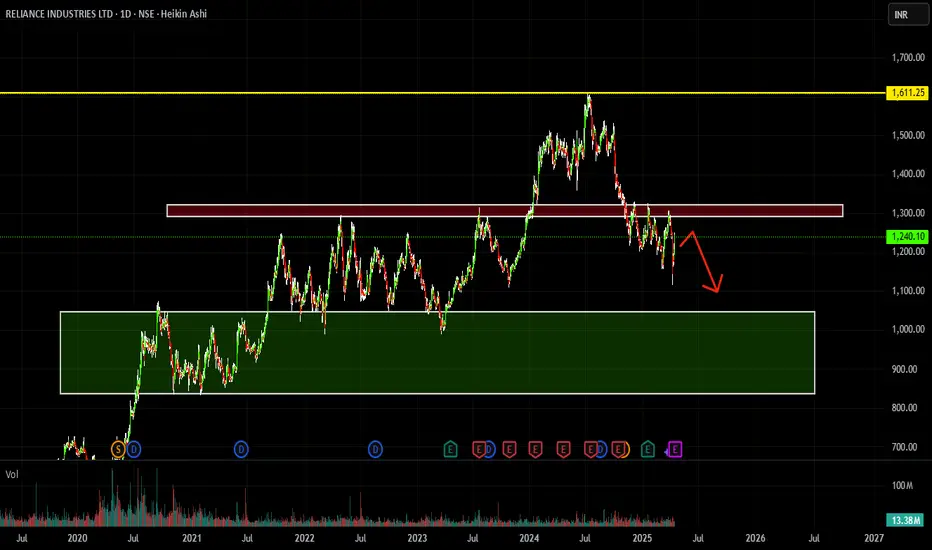
Short term trend may be go to the external demand zone.
Long term trend breaks the new high after going from discount zone.
Short trade idea analysis (Education Purpose)
Confirmation - fractal CHOch
2 trades:- Market and sell limit order
Both Stop loss same @1554.55
Both Target Same @1104
Please check the comment section to see how this turned out.
Relianceindustries
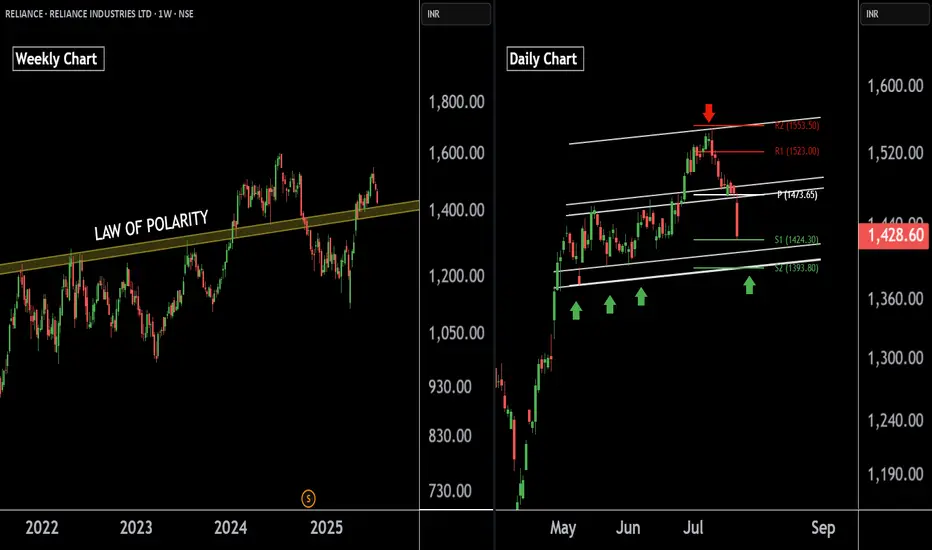
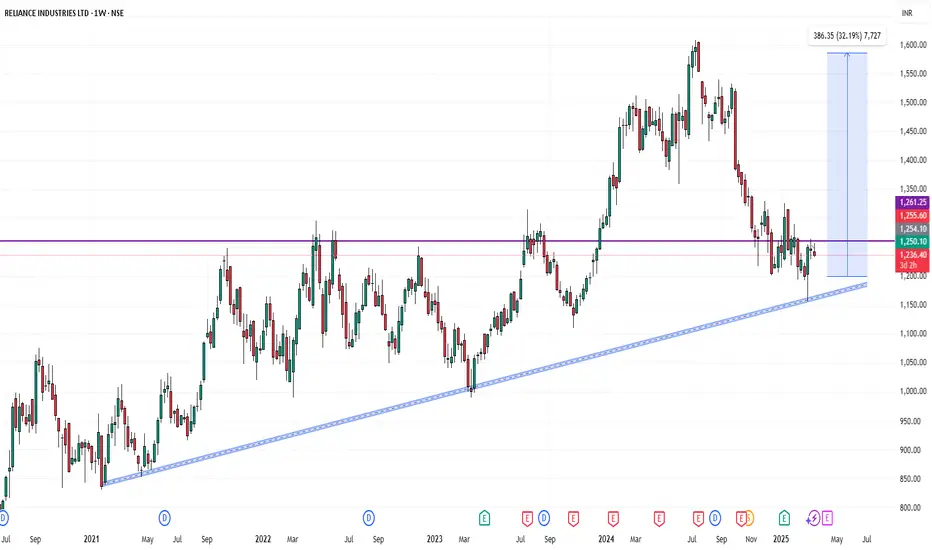
Reliance Industries — Preparing for the Next Bullish Leg !!There are two charts of Reliance Industries — one on the weekly timeframe and the other on the daily timeframe.
On the weekly timeframe:
Reliance industries is trading near (LOP), with a key support zone in the range of 1385–1400.
On the daily timeframe:
Reliance industries is moving in well defined parallel channel with support zone near at 1400-1410.the stock is also taking support at pivot levels S1 and S2, positioned between 1393 and 1422 levels.
If this level is sustain then we may see higher prices in Reliance industries.
Thank You !!
What to do with Reliance share after its drubbing today? Reliance looks weak post result however there is no spike in volume of sale that is a good point. The levels from which Reliance can recover seem to be 1427, 1370 or 1323. If we get a closing below 1323 the stock can fall to 1217 or even 1160 levels this is the reading as of now.
The result was looking good but on deeper scrutiny it was understood that major chunk was profit was due to sale of Reliance stake in Asian Paints business. This I think is not liked by the market specially the retail investors.
The stock has tanked close to 3% as of now but there is no huge selling seen from HNIs or MFs (As of now). (This is an assumption looking at the volume of sale) Volumes are similar to normal day of trade.
May be as retail investors panic MFs, HNIs and others might gulp the stock. Cant say clearly. We might reanalyze by end of the day but caution: Do not sell Reliance in Panic. Result was average it was not bad even if we ignore the Asian paint factor so. Currently I am not selling Reliance I am holding on to it. Might add at lower levels.
Disclaimer: The above information is provided for educational purpose, analysis and paper trading only. Please don't treat this as a buy or sell recommendation for the stock or index. The Techno-Funda analysis is based on data that is more than 3 months old. Supports and Resistances are determined by historic past peaks and Valley in the chart. Many other indicators and patterns like EMA, RSI, MACD, Volumes, Fibonacci, parallel channel etc. use historic data which is 3 months or older cyclical points. There is no guarantee they will work in future as markets are highly volatile and swings in prices are also due to macro and micro factors based on actions taken by the company as well as region and global events. Equity investment is subject to risks. I or my clients or family members might have positions in the stocks that we mention in our educational posts. We will not be responsible for any Profit or loss that may occur due to any financial decision taken based on any data provided in this message. Do consult your investment advisor before taking any financial decisions. Stop losses should be an important part of any investment in equity.

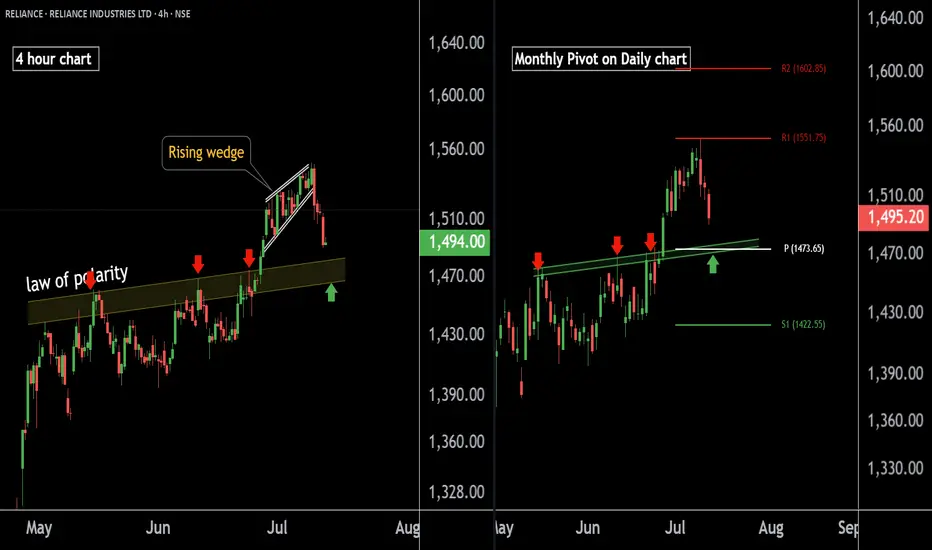
RELIANCE INDUSTRIES at Best Support !! Keep It On Your Radar !!There are two chart of RELIANCE INDUSTRIES on Daily and 4 hour Timeframe.
On the 4-hour timeframe, Reliance is likely to respect its LOP (Line of Polarity) as support, with the support range near 1460-1475.
On the Daily timeframe, the monthly pivot is also positioned around 1473, reinforcing this level as a potential halt or reversal zone.
If this level is sustain we may see higher prices in RELIANCE INDUSTRIES.
Thank You !!!
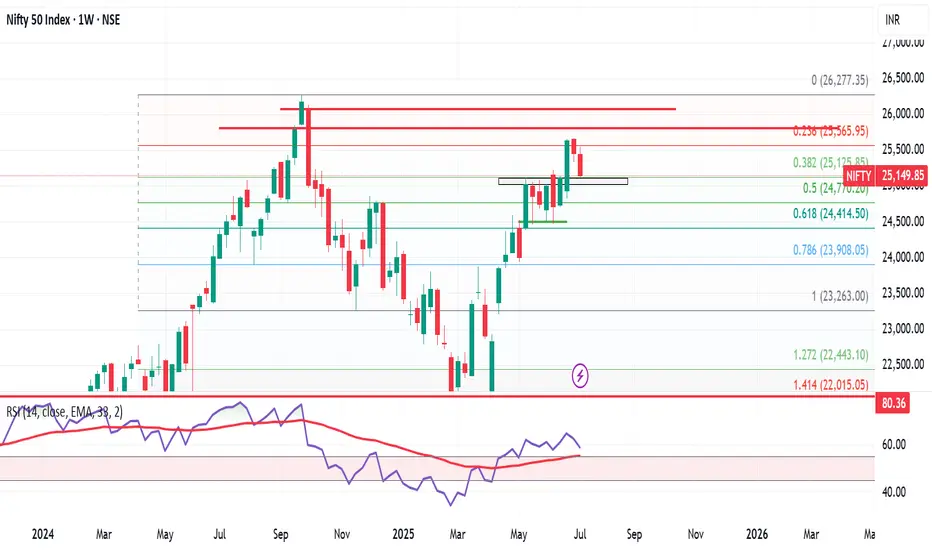
Nifty at Make-or-Break Zone: What to Expect Next Week Markets eMarkets ended the week under pressure, with the Nifty 50 closing at 25,149, down 312 points from the previous week. The index traded within a tight band, hitting a high of 25,548 and a low of 25,129 — perfectly respecting the 25,900–25,000 range mentioned in last week’s analysis.
Now, Nifty finds itself at a crucial support level near 25,000. A rebound from this zone could trigger a short-term rally towards 25,500–25,600, which will act as immediate resistance. However, traders should proceed with caution, as the monthly chart remains neutral to bearish, indicating that this could just be a temporary bounce rather than a sustained uptrend.
Looking ahead, expect Nifty to trade within a range of 24,700 to 25,600. A breakdown below 24,700 could open the gates for deeper cuts, while a breakout above 25,600 needs to be backed by strong volume and participation to confirm a trend reversal.
Sector Watch: Reliance Shines Amidst Caution
Among the large caps, Reliance Industries stands out as the only stock showing strength on the monthly chart, while other heavyweights and key sectors continue to lack momentum. This narrow leadership is a red flag for broader market sustainability.
Global Markets: S&P 500 at a Crossroads
Globally, the S&P 500 closed at 6,259, down slightly from last week. What’s more important is the formation of a Doji candle — a classic sign of indecision. A move above 6,300 could lead to upside targets of 6,376 / 6,454 / 6,500, which would likely boost sentiment in global and Indian equities.
However, if the index slips below 6,150, it would mark a failed breakout, potentially triggering a global correction — a risk that Indian markets can't ignore.
Final Word
We’re at a critical juncture. While technicals suggest a potential bounce in Nifty from 25,000, the lack of confirmation on higher timeframes and uncertain global cues call for prudence over aggression.
👉 I’ll be staying out of the market this week. The setup doesn’t offer a favorable risk-reward, and in trading, patience is often the best position.
Let the charts speak. We’ll act accordingly.
RELIANCE INDUSTRIES at Key Zone !!This is the 1 hour Chart of RELIANCE INDUSTRIES.
Stock has formed a large Broadening Wedge pattern, with a projected target around the 1560 range.
Stock has formed a ascending triangle patterrn with a projected target around the 1560 range.
stock has given a breakout at 1460 range. If it successfully retests and holds this level as support , then we may see higher prices in RELIANCE INDUSTRIES.
Thank you !!

RELIANCE : Completing correction, ready to bounce back🚀 Trading Opportunity: Reliance Industries Ltd. (NSE: RELIANCE) -
⏱️ Timeframe: 1 Day (1D)
💰 Current Price: ₹1,175.60
🎯 Swing Target Zone: ₹1,374 - ₹1,565 🏆
🛡️ Support Level: ₹1,182.10
🛑 Stop Loss: ₹1,159.00 (Day Close Below) 📉
🔍 Wave Analysis:
📈 The chart indicates a completed corrective wave (primary) 5 on the daily chart. This suggests a potential end to the downtrend and the start of an upward move.
🔄 We observe a corrective wave (A), followed by a potential reversal at (B), and a completed intermediate correction wave 5.
💥 The breakout at point (2) signals the start of wave (C), aiming for the swing target zone of ₹1,374-₹1,565. 🎯
💪 Current support near ₹1,182.10.
⚠️ Daily close below ₹1,159.00 invalidates the wave count and the setup. ❌
📊 Strategy:
✅ Entry: Enter near current market prices (around ₹1,175.60). 🛒
🔒 Risk Management: Set stop loss at ₹1,159.00 (daily close) to limit downside. 📉
💸 Exit: Aim for profits within the swing target zone of ₹1,374-₹1,565, aligning with the wave (C) target. 🏆
#Trading 📈 #StockMarket 💰 #RELIANCE 🏭 #TechnicalAnalysis 🧐 #Investing 💼 #ElliottWave
⚠️ Disclaimer: I am not a financial adviser; please consult one. Don't share information that can identify you. ⚠️

RELIANCE INDUSTRIES LTD short dayThe stock of Reliance Industries is currently exhibiting a clear bearish tone. Price action continues to show weakness, with repeated failed attempts to recover, signaling that sellers remain in control.
The ongoing downward movement suggests a lack of confidence from market participants, with no strong catalysts visible to shift momentum. Selling pressure dominates, while any bounce attempts struggle to hold.
Unless there's a visible change in price behavior or a shift in sentiment, the overall outlook remains negative. Caution is advised, and buyers may want to wait for clearer signs of stability before considering entry.
Reliance Industries📈 Reliance Industries Breakout Alert – ₹1241 Key Level Breached 🚀
Reliance Industries has successfully broken out above a strong resistance zone near ₹1241, indicating a potential bullish move ahead. This level acted as a critical supply zone in the past, and the breakout with volume confirmation adds strength to the trend.
🔍 Technical Highlights:
Breakout Level: ₹1241
Volume: Above average (confirming strength)
Trend: Bullish
Next Resistance Zones: ₹1265 / ₹1290
Support Zones: ₹1220 / ₹1200 (previous resistance now acting as support)
Reliance Breakout?📈 Reliance Industries Breakout Alert – ₹1241 Key Level Breached 🚀
Reliance Industries has successfully broken out above a strong resistance zone near ₹1241, indicating a potential bullish move ahead. This level acted as a critical supply zone in the past, and the breakout with volume confirmation adds strength to the trend.
🔍 T echnical Highlights:
Breakout Level: ₹1241
Volume: Above average (confirming strength)
Trend: Bullish
Next Resistance Zones: ₹1265 / ₹1290
Support Zones: ₹1220 / ₹1200 (previous resistance now acting as support)

Reliance Industries: Case of Ending DiagonalTheory:
DIAGONAL:
Diagonal are the motive waves like an impulse wave, but diagonals are different from impulse wave in that they do follow the first two Sutras (rules of impulse wave) for wave analysis, but it does not follow the third one i.e. Wave 4 should not intervene the territory of the wave 1. In a diagonal wave 4 always enters into the price territory of the wave 1.
Properties Of Diagonals:
Diagonals can be contracting or expanding type being expanding diagonal a rare one.
In contracting type, wave 3 is shorter than wave 1, wave 5 is shorter than wave 3, and wave 4 is shorter than wave 2.
In expanding type, wave 3 is longer than wave 1, wave 5 is longer than wave 3, and wave 4 is longer than wave 2.
Types Of Diagonals:
LEADING DIAGONAL
ENDING DIAGONAL
LEADING DIAGONAL: In a leading diagonal , waves 1,3, and 5 are all impulsive in nature or all in corrective form of zigzags. Wave 2 and wave 4 are always present in a zigzag form. A leading diagonal suggests the starting of a new wave & that is why it can develop wave 1 of a impulse wave and a first wave of a zigzag pattern.
ENDING DIAGONAL : This is the most common diagonal that can be found out at the ending of a main trend or main correction. It consists of all the waves 1-2-3-4-5 in a single or multiple zigzags. They can be found placed at 5th wave of an impulse wave or can been seen as a wave ‘C’ of a corrective waves zigzags or flat.
After the termination of the diagonal , a swift & a sharp reversal takes place which bring the prices back to the level from where the diagonal has began. (generally it retrace back to the wave-2 of the diagonal structure)
TRADING PLAN:
Stock is likely to hold above 1156 on any weakness and recover towards 1290-1300 in the coming days and weeks ahead.

Above 1200 Reliance can move upward otherwise it will be bearishYt - chartpatern - YT - @chartpatern
As of March 4, 2025, Reliance Industries Ltd. (RIL) shares closed at ₹1,161.70, reflecting a 0.80% decrease from the previous day. This positions the stock approximately 27.80% below its 52-week high of ₹1,608.95, achieved on July 8, 2024.
Your observation that RIL's stock may exhibit bullish behavior above ₹1,200 and bearish tendencies below this threshold aligns with recent performance. The stock's current price is marginally below this pivotal level, suggesting potential bearish momentum.
Analyst sentiment remains optimistic, with a consensus rating of 'Buy' and a median price target of ₹1,559, indicating a potential upside of approximately 24.38% from current levels.
In summary, while RIL's stock is trading below the ₹1,200 mark, indicating possible bearish trends, the prevailing analyst outlook suggests confidence in the company's long-term performance.

Reliance looking to bounceReliance is at its key support and it can give a good retracement towards the highs if it does not break the previous low.
Keeping the previous low as SL, one can look for a small long position

BULLISH PATTERN IN RELIANCEMultiple Bullish Patterns..
Breakout Retest in Daily TF
Pole and Flag in 1 hr TF active above 1280 hourly candle closing
Can Expect Bullish Move
Idea Invalid if todays closing below 1260
Reliance in range from 6th Nov.. Breakout will lead to rally in long term above 1380

INV H&S IN RELIANCE IN FORMATIONInv H& S expected
Gap Filling till 1275
Todays Closing Imp... idea invalid if closing below 1260 on DCB
Dip Buying till gap filling 1275

Good Results makes Reliance a great oppertunityReliance Industries Ltd. engages in hydrocarbon exploration and production, petroleum refining and marketing, petrochemicals, retail, FMCG, and telecommunications, Digital Entertainment and Media. Reliance is one of the biggest Indian companies and vivid sectoral presence.
Reliance Industries Ltd. CMP is 1302.35. The Positive aspects of the company are Company with Low Debt, Company with Zero Promoter Pledge, Annual Net Profits improving for last 2 years. The Negative aspects of the company are high Valuation (P.E. = 25.5) and Declining Net Cash Flow.
Entry can be taken after closing above 1303 Targets in the stock will be 1355, 1378, 1414 and 1451. The long-term target in the stock will be 1522 and 1556+ Stop loss in the stock should be maintained at Closing below 1184.
Disclaimer: The above information is provided for educational purpose, analysis and paper trading only. Please don't treat this as a buy or sell recommendation for the stock or index. We do not guarantee any success in highly volatile market or otherwise. Stock market investment is subject to market risks which include global and regional risks. I or my clients might have positions in the stocks that we mention in our posts. We will not be responsible for any Profit or loss that may occur due to any financial decision taken based on any data provided in this message. Do consult your investment advisor before taking any financial decisions. Stop losses should be an important part of any investment in equity.

LongThe intrinsic value of Reliance Industries is currently estimated at ₹2,481, while the stock is trading significantly lower at ₹1,250. This presents a compelling opportunity for long-term investors, I am long at ₹1,220.
Given the strong market capitalization of Reliance and its impressive track record of growth and performance over the years, these current levels appear to be an attractive entry point. As the company continues to expand its footprint in sectors like telecommunications, energy, retail, and digital services, the stock is poised for substantial long-term appreciation.
For investors looking to build or add to their positions, the current price levels offer a promising opportunity to accumulate shares at a discount to its intrinsic value, with a potential upside towards ₹2,481 in the medium to long term.

Correction Wave 5 in Reliance Industries Complete? Now what?Correction phase of Reliance industries has been patience testing for it's investors. As per my personal analysis these are the 3 paths that it can probably take.
Path1) Now it can go either from a to b with stoppages. Closing above 1252 will enable Ril reach from a to d that is 1252 to 1429. If we get a breakout near 1429 upside targets will be 1452, 1479 and 1500 to 1600 range.
Path 2) The path that it can take is a to c to d to e and e to f. Which is from 1251 it can again fall to 1203 from 1203 it can again travel to 1251 from 1251 down to 1110 and from 1110 to 1379 levels.
Path 3) The path that it can also take is a to c to d to g. Which is from 1251 it can again fall down to 1203 from there it can reach 1252 and from there it can jog to 1323 levels.
Reliance is conglomerate of Oil and Gas, Retail, Green Energy, Media and Telecom, Textile etc. businesses. In the short medium or long term it will rise again in all probabilities. An investor can take a decision to hold, compound, average or add Reliance Industries to their portfolio. I have personally added a good chunk of Reliance stocks to my portfolio where it existed already. Right now Reliance is in an patience testing phase of an investor's journey. I believe that rewards will come sooner rather than later. Reliance has been part of my Portfolio since I started my investment journey so there is a chance of bias in my analysis so invest wisely after looking at the chart.
Disclaimer:The above information is provided for educational purpose, analysis and paper trading only. Please don't treat this as a buy or sell recommendation for the stock or index. We do not guarantee any success in highly volatile market or otherwise. Stock market investment is subject to market risks which include global and regional risks. I or my clients might have positions in the stocks that we mention in our posts. We will not be responsible for any Profit or loss that may occur due to any financial decision taken based on any data provided in this message. Do consult your investment advisor before taking any financial decisions. Stop losses should be an important part of any investment in equity.

RELIANCE- DEMAND/SUPPORT ZONERIL- Broken down below crucial price zone, testing the 200 W MA, break below that will target prices mentioned. If we do see Index break and RIL 1000-1050, IDEAL entry point, can get 20-25% most likely.

Reliance Industries- YEARLY CHART- A concerning candleAfter 9 years RIL- Reliance is ending the year with -ve gains for the year! A slight concern, or a possible opportunity?

Possible Wave Counts of RELIANCE : Near to Bottom ?Reliance Industries Technical Analysis based on Elliott Wave Counts (Possible)
Chart: The analysis is based on a 2-hourly timeframe chart of Reliance Industries (RELIANCE).
Elliott Wave Theory: The analysis utilizes Elliott Wave Theory, which suggests that market prices move in repetitive patterns called waves. These patterns consist of impulsive waves (numbered 1-5) that move in the direction of the main trend and corrective waves (labeled A-B-C) that move against the main trend.
Possible Wave Counts:
Overall Trend: The chart suggests a potential overall uptrend, with the analysis focusing on a smaller degree wave structure within this larger trend.
Impulsive Waves: The chart highlights several impulsive waves (1-5) of varying degrees, indicating periods of strong price movement in the direction of the trend.
Corrective Waves: The chart also identifies corrective waves (A-B-C), representing periods of price consolidation or retracement against the main trend.
Current Wave: The analysis suggests that the price is currently in a corrective wave (2), following an impulsive wave (1).
Potential Target: Based on the wave counts, there is a potential for further upward movement once the current corrective wave completes. However, specific price targets are not provided in this analysis.
Key Levels:
Invalidation Level: A key level to watch is the "Invalidation Level" marked on the chart. If the price breaks below this level, the current wave count may be invalidated, suggesting a different interpretation of the market structure.
I am not Sebi registered analyst.
My studies are for educational purpose only.
Please Consult your financial advisor before trading or investing.
I am not responsible for any kinds of your profits and your losses.
Most investors treat trading as a hobby because they have a full-time job doing something else.
However, If you treat trading like a business, it will pay you like a business.
If you treat like a hobby, hobbies don't pay, they cost you...!
Hope this post is helpful to community
Thanks
RK💕
Disclaimer and Risk Warning.
The analysis and discussion provided on in.tradingview.com is intended for educational purposes only and should not be relied upon for trading decisions. RK_Charts is not an investment adviser and the information provided here should not be taken as professional investment advice. Before buying or selling any investments, securities, or precious metals, it is recommended that you conduct your own due diligence. RK_Charts does not share in your profits and will not take responsibility for any losses you may incur. So Please Consult your financial advisor before trading or investing.

RELIANCE : BET ON FNO AND SWINGTechnical Analysis of Reliance Industries on 1-Hour Chart
Overview of the Chart
The chart represents Reliance Industries on the 1-hour timeframe , highlighting key concepts such as CHoCH (Change of Character), demand zones, and the golden retracement zone.
Tools Used:
Price Action : Key highs/lows, retracement zones.
Demand Zones : Mitigated demand areas.
Golden Retracement Zone : Optimal entry for Wave B based on Fibonacci levels.
Swing Target : Projected target for Wave C.
Key Levels and Concepts Explained
Extended Retracement Zone (Deep Retracement): ₹1,261.20 – ₹1,252.70
This zone marks a potential support area for buyers after a correction in Wave A to B.
Buying Tip: Look for reversal signs in this zone.
Stop Loss: Below ₹1,252.70 to manage risk effectively.
Golden Retracement Zone (Wave B): ₹1,241.30 – ₹1,261.20
Located at the 61.8% Fibonacci retracement level, a high-probability area for a reversal upward.
Buying Strategy:
Enter within this zone if price shows bullish signs like engulfing patterns or pin bars.
Stop Loss: Just below ₹1,241.30.
Target: Swing high at ₹1,341 – ₹1,354 (Wave C).
CHoCH Zones:
Failed CHoCH: Price rejected near ₹1,273.75 and corrected lower.
Demand Zone: Strong demand needs to emerge at ₹1,261.20 for a reversal upward.
Tip: Look for bullish confirmation near demand zones or the golden retracement.
Swing Target Zone: ₹1,341 – ₹1,354
Represents the projected target for Wave C if the retracement zone holds.
Partial Profit Tip: Book profits near ₹1,341 – ₹1,354 and trail stops for further upside.
Stop Loss Strategy
Stop Loss on Failure: Below ₹1,241.30.
If price closes below this level, the bullish setup is invalid, and traders should exit to limit losses.
Buying Tips at Key Levels
Primary Buy Zone: ₹1,241.30 – ₹1,261.20 (Golden Retracement)
Look for bullish confirmation like pin bars, engulfing candles.
Stop Loss: Below ₹1,241.30.
Target: ₹1,341 – ₹1,354.
Aggressive Buy Option: ₹1,261.20
Scale into positions near mitigated demand with tight stop losses.
Key Observations
Wave Structure: Price is in Wave B (corrective phase), aiming for an upward Wave C.
Demand Zone: Buyer defense at the golden retracement confirms bullish outlook.
Risk Management: Always use stop losses to avoid significant drawdowns.
Summary of Key Levels
Key Levels Actions
₹1,241.30 – ₹1,261.20 Buy Zone (Golden Retracement)
Below ₹1,241.30 Stop Loss
₹1,341 – ₹1,354 Swing Target Zone
By following this plan, traders can align with price structure, optimize risk-to-reward, and trade effectively.

BUY RELIANCE ABOVE 1280Reliance formed a strong bullish candle near previous low and looks like a double bottom. Reliance looks a good buy if sustains above 1280 for the Targets of 1320, 1350 and 1400 until 1215 in intact on the downside.
To motivate us, Please like the idea If you agree with the analysis.
Happy Trading!
InvestPro India
