Reliance Industries Stock(India) - {11/07/2025}Educational Analysis says that Reliance Industries (Indian Stock) may give trend Trading opportunities from this range, according to my technical analysis.
Broker - NA
So, my analysis is based on a top-down approach from weekly to trend range to internal trend range.
So my analysis comprises of two structures: 1) Break of structure on weekly range and 2) Trading Range to fill the remaining fair value gap
Let's see what this Stock brings to the table for us in the future.
DISCLAIMER:-
This is not an entry signal. THIS IS FOR EDUCATIONAL PURPOSES ONLY.
I HAVE NO CONCERNS WITH YOUR PROFITS OR LOSS,
Happy Trading,
Stocks & Commodities TradeAnalysis.
My Analysis is:-
Short term trend may be go to the external demand zone.
Long term trend breaks the new high after going from discount zone.
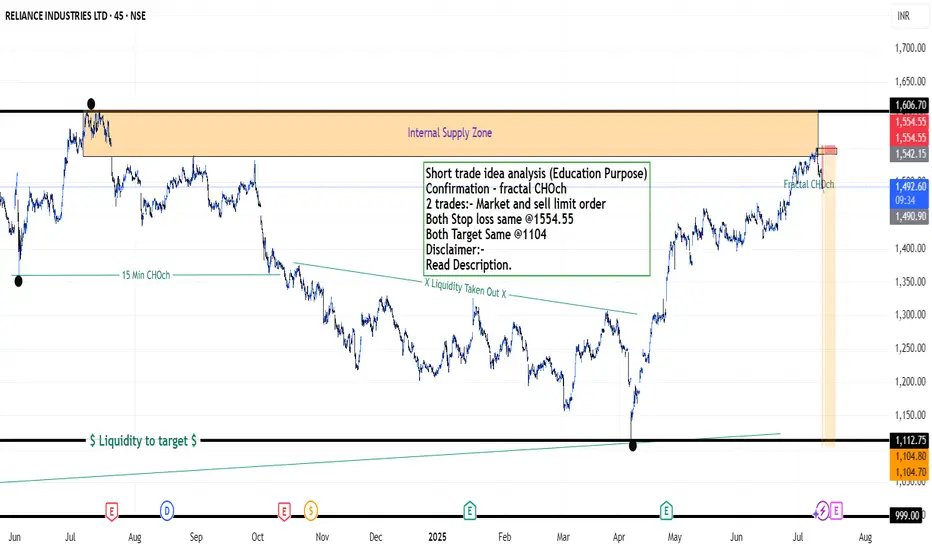
Short trade idea analysis (Education Purpose)
Confirmation - fractal CHOch
2 trades:- Market and sell limit order
Both Stop loss same @1554.55
Both Target Same @1104
Please check the comment section to see how this turned out.
Relianceshort
RELIANCE Bearish Setup on 05 Sep 2024There was Bearish Engulf setup on 5th Sep day closing.
Although, this was not convincing for the trade, as the market was consolidating in a range. The ideal setup would have been if there were 3 candles below the 4th Sep candle.

Reliance--S/R levelsI am sharing the important levels of Support and Resistance. These levels plays a crucial role in trading decisions, as they act as reliable markers of price movements.
------>>Support levels are price points where an asset tends to find buying interest, preventing it from falling further.
---->Resistance levels, on the other hand, are points where selling pressure typically prevents the asset from rising higher.
Take a look at these levels and trade accordingly. Recognizing and respecting these support and resistance levels can help traders make informed decisions and manage risk effectively. They serve as key reference points for technical analysis and are vital tools in successful trading strategies.
Trade safe...Thank you guys for your support

Reliance--Resistance @2400 ??I am sharing the important levels of Support and Resistance. These levels play a crucial role in trading decisions, as they act as reliable markers of price movements.
------>>Support levels are price points where an asset tends to find buying interest, preventing it from falling further.
---->Resistance levels, on the other hand, are points where selling pressure typically prevents the asset from rising higher.
Take a look at these levels and trade accordingly. Recognizing and respecting these support and resistance levels can help traders make informed decisions and manage risk effectively. They serve as key reference points for technical analysis and are vital tools in successful trading strategies.
Trade safe...Thank you guys for your support

RELIANCE--@ Strong Demand??The stock price is now enters in demand zone, where price is strongly moved to the upside...
Find long opportunity in this demand area...
on top side we have a trendline acting as a resistance...
so be careful with this resistance, may have a chance of pushing the price down...
keep safe....
Note:: There is no guarantee that this zone push the price up...sometimes it opens below and continue to down...so careful here.

RELIANCE--Near Its Demand Zone?? look for buy when price test this demand Zone.
I am sharing the important levels of Support and Resistance. These levels play a crucial role in trading decisions, as they act as reliable markers of price movements.
------>>Support levels are price points where an asset tends to find buying interest, preventing it from falling further.
---->Resistance levels, on the other hand, are points where selling pressure typically prevents the asset from rising higher.
Take a look at these levels and trade accordingly. Recognizing and respecting these support and resistance levels can help traders make informed decisions and manage risk effectively. They serve as key reference points for technical analysis and are vital tools in successful trading strategies.
Trade safe...Thank you guys for your support.
The information provided on this platform/website/blog is for informational purposes only and should not be considered as financial or investment advice. It is not intended to be a substitute for professional financial advice or consultation.
The content presented here is based on personal opinions, analysis, and research, and it may not always reflect the most current market conditions or regulations. Investing in stocks, bonds, commodities, or any financial assets carries inherent risks, and individuals should conduct their own due diligence and consult with a qualified financial advisor before making investment decisions.
Past performance is not indicative of future results. The value of investments can go up or down, and there are no guarantees of profit or protection against loss in the stock market.
We do not endorse, recommend, or promote any specific stocks, securities, or investment strategies. Readers and users of this information are solely responsible for their investment decisions and should consider their own financial situation, risk tolerance, and investment goals.
Trading and investing in the stock market can involve substantial risk, and it is possible to lose more than your initial investment.
We make no warranties or representations about the accuracy, completeness, or reliability of the information presented. We disclaim any liability for any loss or damage arising from the use of this information or reliance on it.
Please be aware that regulations and tax laws related to investments may vary by jurisdiction, and it is essential to understand and comply with the specific rules and regulations applicable in your location.
By accessing and using this platform/website/blog, you agree to this disclaimer and acknowledge that you have read and understood the information provided herein. It is your responsibility to review and accept the terms of use and privacy policy of this platform/website/blog.
This disclaimer may be updated or modified without notice, and it is your responsibility to review it periodically for any changes.

RELIANCE:to sell-breaks the RESISTANCE,and come back and test it(PULLBUCK)
-sign to sell
-target 1 : 2440.30
-target 2 : 2414.25

RELIANCE--Head & Shoulders Pattern ??After a strong trending movement from few weeks,
price is near its resistance level,
now it is in the form of Head and Shoulders pattern..which is a reversal pattern..
wait until price breaks the Neckline and retest...then will enter for Short side...
keep track this for Short side, if breaks neckline...until wait and watch.

RELIANCE--2500 or 2400 ??Observations::
----the stock is in the resistance zone...where previously strong sell of is observed in this zone..
today a strong bearish candle is observed from this zone..
If price fall below 2500 zone, and not able to break 2600, then look for sell in these zones.
(2520-2500 range)
If price is not able to break above after taking support from 2520-2500 levels, short side up to 2400.

RELIANCE--Double Top Formation??------->>----->> Can we consider this as double top ??
------>> Failed to create a new high and falls heavily to the below levels.
if demand acts as supply @ 2470-2460 levels, we will observe a fall again towards 2420 and 2370 levels.
@ 2370 Levels we have identified a strong rise in this stock price, will again push the price towards higher levels.
keep track these two levels.

RELIANCE--Gap down ??Observations:
-------->>the stock is trending upwards.
-------->> We have observed that the price is broken trendline, and retested the supply zone.
--------->> Previously a strong fall is observed from the zone 2490. if price falls below 2450 levels sell on retracement for the target2420 levels.
Keep an eye on these levels.
Please like, if this post is helpful

Would you be okay?Reliance clearly not able to sustain above the highs, and has been consolidating inside the Q2 range till now.
This indicates weakness, and hence expecting it to give a follow through to the downside.

RELIANCE SHORTReliance has formed the Head & Shoulders pattern and is ready to further go downside.
It is better to wait for a re-test of the breakdown line (2530 levels).
Target :- 2400 levels
SL :- 2600
Trade safe. Manage risk. Be profitable.
Please follow us for more simple trading analysis and setups. Also let me know in the comment in case you have any queries.
Disclaimer :- This is just my view. Please analyze charts yourself and then decide to take any trades.

Reliance Industries 15 Min chart Demand and Supply Levels.Reliance Industries 15 Min chart Demand and Supply Levels.
Bullish Supply Range ( Go Long) - INR 1,801/- to INR 1,840/-
(Blue Circle in Image)
Bearish Supply Range ( Go Short) -INR 1,880/- to INR 1,876/-
(Red Circle in Image)
#RelianceIndustries #Reliance #India #StockMarket
Suggested Move - Short atINR 1,880/- to INR 1,876/-
(Red Circle in Image)
#RelianceIndustries #Reliance #India #StockMarket

Reliance Industries (RIL) Level & Strategy for Next Few DaysDear traders, I have identified chart levels based on my analysis, major support, and resistance levels. Please note that I am not a SEBI registered member. Information shared here for educational purpose. Please don’t trust me or anyone for trading/investment purpose. Focus on learning how to fish, trust your own skills and please do consult your financial advisor before trading.
Today, RIL traded below major support level . RIL is the biggest heavy weight stock in Nifty . Today, RIL was down by Rs -32.45 (-1.27%) which is a significant change within a day.
Today, RIL continued to slide and performed as expected ? 1. After increase in Windfall Tax 2. Weakness in Crude Oil Prices
Today, bears successfully brought down the RIL. It will be interesting to watch RIL levels in coming days.
Shall we continue to look for sell on rise strategy in RIL amid global issues & increase in windfall tax ?????
Friends, please review & share your comments as well.
Have a very happy, healthy & profitable day ahead!

Reliance Intraday view 14th July 2022Long above 2406, Keep trailing profits on the resistances drawn, SL 2380
Short below 2386, Keep trailing profits on the supports drawn, SL 2410
You can do scalping on the lines drawn

Reliance Intraday View 13th July 2022Long above 2421, Keep trailing your profits on the markings drawn in the chart, SL 2399
Short below 2400, Keep Trailing your profits on the markings drawn in the chart, SL 2415
NOTE : Please wait to understand the trend in the market and then take a trade.

Reliance Futures Key trading level 28th June 2022Reliance Futures Key trading level 28th June 2022
Disclaimer: These levels are purely based on Price action/demand and supply zones & and consumed only for educational purpose & should not be taken as buy/sell recommendation. I will not be responsible for any loss/profit incurred if anyone takes trades based on my views.
Please consult your Financial Advisor before making any trading decision.
Leave a comment that is helpful or encouraging. Let's master the markets together.

Reliance Futures Key trading level 24th June 2022Reliance Futures Key trading level 24th June 2022
Disclaimer: These levels are purely based on Price action/demand and supply zones & and consumed only for educational purpose & should not be taken as buy/sell recommendation. I will not be responsible for any loss/profit incurred if anyone takes trades based on my views.
Please consult your Financial Advisor before making any trading decision.
Leave a comment that is helpful or encouraging. Let's master the markets together.

Reliance Now Rejected AreaReliance 5% Down possible from 2373 it will come around 2250
if break out below 2250 expect more negative

Reliance showing recent lower high lower low1. making lower low lower high
2. Negative Divergance in RSI
3. Trading belwo breakout level
4. now at important support once this fail and swing low broke can go down

RELIANCE to break support, steep fall in the coming days NSE:RELIANCE is about to see major fall in the coming days with price likely to fall as low as 1810 . The Moving Average 50 has just crossed over the Moving Average 20. Past performance shows this results in price falling to around 2-3%. Moreover the Moving Average 200 is closing gap with MA50 and MA20 and if crosses above them, the stock can see an even greater fall going below 1800. Furthermore past few days show huge bearish body candles showing a downtrend. Only positive news (Global or Company related) can take the price up.

reliance industries ltd. - Triangle Continuation PatternReliance industries price is squeezing and forming a Triangle Continuation Pattern, wait for breakout!
