Reliance Industries Stock(India) - {11/07/2025}Educational Analysis says that Reliance Industries (Indian Stock) may give trend Trading opportunities from this range, according to my technical analysis.
Broker - NA
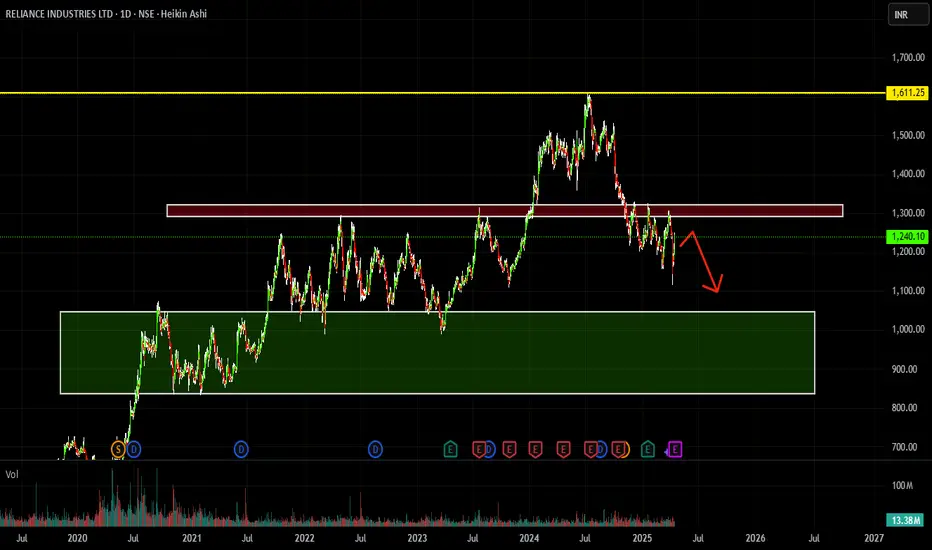
So, my analysis is based on a top-down approach from weekly to trend range to internal trend range.
So my analysis comprises of two structures: 1) Break of structure on weekly range and 2) Trading Range to fill the remaining fair value gap
Let's see what this Stock brings to the table for us in the future.
DISCLAIMER:-
This is not an entry signal. THIS IS FOR EDUCATIONAL PURPOSES ONLY.
I HAVE NO CONCERNS WITH YOUR PROFITS OR LOSS,
Happy Trading,
Stocks & Commodities TradeAnalysis.
My Analysis is:-
Short term trend may be go to the external demand zone.
Long term trend breaks the new high after going from discount zone.
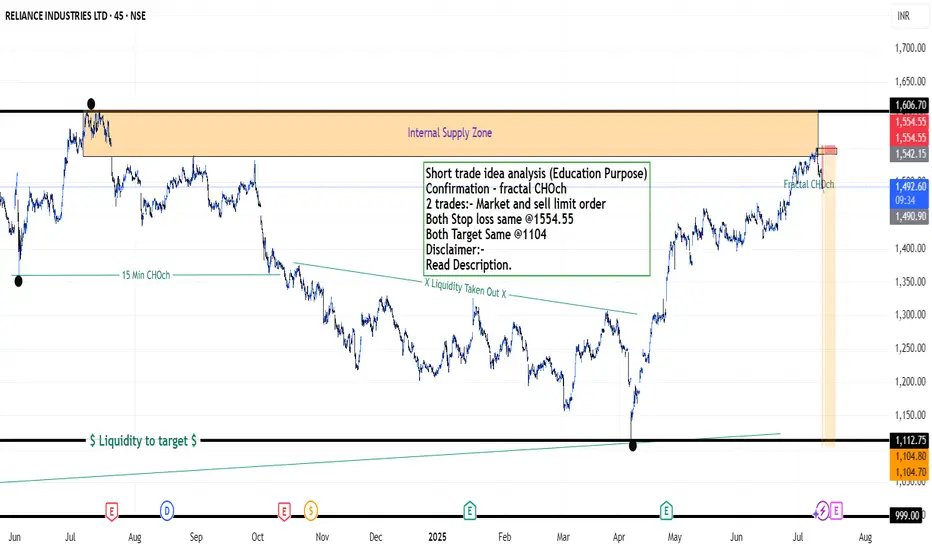
Short trade idea analysis (Education Purpose)
Confirmation - fractal CHOch
2 trades:- Market and sell limit order
Both Stop loss same @1554.55
Both Target Same @1104
Please check the comment section to see how this turned out.
Reliancestock
RELIANCE : Completing correction, ready to bounce back🚀 Trading Opportunity: Reliance Industries Ltd. (NSE: RELIANCE) -
⏱️ Timeframe: 1 Day (1D)
💰 Current Price: ₹1,175.60
🎯 Swing Target Zone: ₹1,374 - ₹1,565 🏆
🛡️ Support Level: ₹1,182.10
🛑 Stop Loss: ₹1,159.00 (Day Close Below) 📉
🔍 Wave Analysis:
📈 The chart indicates a completed corrective wave (primary) 5 on the daily chart. This suggests a potential end to the downtrend and the start of an upward move.
🔄 We observe a corrective wave (A), followed by a potential reversal at (B), and a completed intermediate correction wave 5.
💥 The breakout at point (2) signals the start of wave (C), aiming for the swing target zone of ₹1,374-₹1,565. 🎯
💪 Current support near ₹1,182.10.
⚠️ Daily close below ₹1,159.00 invalidates the wave count and the setup. ❌
📊 Strategy:
✅ Entry: Enter near current market prices (around ₹1,175.60). 🛒
🔒 Risk Management: Set stop loss at ₹1,159.00 (daily close) to limit downside. 📉
💸 Exit: Aim for profits within the swing target zone of ₹1,374-₹1,565, aligning with the wave (C) target. 🏆
#Trading 📈 #StockMarket 💰 #RELIANCE 🏭 #TechnicalAnalysis 🧐 #Investing 💼 #ElliottWave
⚠️ Disclaimer: I am not a financial adviser; please consult one. Don't share information that can identify you. ⚠️

RELIANCE INDUSTRIES LTD short dayThe stock of Reliance Industries is currently exhibiting a clear bearish tone. Price action continues to show weakness, with repeated failed attempts to recover, signaling that sellers remain in control.
The ongoing downward movement suggests a lack of confidence from market participants, with no strong catalysts visible to shift momentum. Selling pressure dominates, while any bounce attempts struggle to hold.
Unless there's a visible change in price behavior or a shift in sentiment, the overall outlook remains negative. Caution is advised, and buyers may want to wait for clearer signs of stability before considering entry.
Reliance Breakout?📈 Reliance Industries Breakout Alert – ₹1241 Key Level Breached 🚀
Reliance Industries has successfully broken out above a strong resistance zone near ₹1241, indicating a potential bullish move ahead. This level acted as a critical supply zone in the past, and the breakout with volume confirmation adds strength to the trend.
🔍 T echnical Highlights:
Breakout Level: ₹1241
Volume: Above average (confirming strength)
Trend: Bullish
Next Resistance Zones: ₹1265 / ₹1290
Support Zones: ₹1220 / ₹1200 (previous resistance now acting as support)

BUY RELIANCE ABOVE 1280Reliance formed a strong bullish candle near previous low and looks like a double bottom. Reliance looks a good buy if sustains above 1280 for the Targets of 1320, 1350 and 1400 until 1215 in intact on the downside.
To motivate us, Please like the idea If you agree with the analysis.
Happy Trading!
InvestPro India

Reliance Intraday Levels: 23-Sep-24 Reliance closed near support Zone , wait for proper rejection or Breakout at zone for entry.
Bullish > 2980
Bearish < 2960
Use SL trailing method to secure profit

relinace buy for swing
first buy near 2870
avg at -2%
sl 4%
tgt 4%8%12%
second buy near 2780
sl 3%
tgt 3%6%9%12%

Reliance Intraday Levels: 18-Sep-24Stock in sideways in last trading session near support Zone . Wait for breakout (Downside) or Rejection (upside) for Entry.
Bullish > 2945
Bearish < 2935

reliance 2.5 years sideways breakout wait for retracement 2680 -2700 is perfect entry level ,long view ,weekly time frame first target 3200 rs second target 4000 above

Reliance--S/R levelsI am sharing the important levels of Support and Resistance. These levels plays a crucial role in trading decisions, as they act as reliable markers of price movements.
------>>Support levels are price points where an asset tends to find buying interest, preventing it from falling further.
---->Resistance levels, on the other hand, are points where selling pressure typically prevents the asset from rising higher.
Take a look at these levels and trade accordingly. Recognizing and respecting these support and resistance levels can help traders make informed decisions and manage risk effectively. They serve as key reference points for technical analysis and are vital tools in successful trading strategies.
Trade safe...Thank you guys for your support

RELIANCE--@ Strong Demand??The stock price is now enters in demand zone, where price is strongly moved to the upside...
Find long opportunity in this demand area...
on top side we have a trendline acting as a resistance...
so be careful with this resistance, may have a chance of pushing the price down...
keep safe....
Note:: There is no guarantee that this zone push the price up...sometimes it opens below and continue to down...so careful here.

Reliance--Demand @2360 ??The stock is trending downwards....
we have a strong demand zone at 2360 level...
when price comes here...look for buy...
we have a continuation bullish gap also be in the middle...take a look at this level as well..
both together may acts as support....

RELIANCE AnalysisObservations::
previous resistance is acts a support and the price is moved up...
a strong fall is noticed from the zone 2580-2570,
price broken this zone with strong momentum, and tested again..keep on buy side until this breaks.
if price is not able to move upside again from this zone will go for side...
A demand zone is observed at 2540 level...
if suddenly price falls.. this gives support.. look for buy on this zone...

Reliance - launcpad readyStage 2A
- Week of 12.6.23
- above all mas
- increasing volume
- double bottom
It has bounced from a confluence of moving averages and ready to rip now!

RELIANCE--Double Top Formation??------->>----->> Can we consider this as double top ??
------>> Failed to create a new high and falls heavily to the below levels.
if demand acts as supply @ 2470-2460 levels, we will observe a fall again towards 2420 and 2370 levels.
@ 2370 Levels we have identified a strong rise in this stock price, will again push the price towards higher levels.
keep track these two levels.

RELIANCE-- Rise or Fall ??Observations:
-------->>the stock is trending upwards.
-------->> We have observed that the price is near trendline.
--------->> Previously a strong fall is observed from the zone 2460-2445.Price broken the resistance and If the same zone is acts as support we will observe again upwards in reliance up to 2490 levels and above.
Keep an eye on these levels.
Please like, if this post is helpful

RELIANCE INDUSTRIES: GO LONG ABOVE 2494This is a long term analysis on Reliance Industries on 2 hours TF
Buy only above breakout pivot range
For swing position target will be 2689
For long term holding , buy on major breakout above 2689 , targets projected using Fibonacci levels are 3003/3320/3515
Long term investors should exit if Stoploss pivot range breaks

Reliance- failed to create a strong High falls below 2350 ??Observations:
A strong sell off is observed after opening gap up , so will expect a downward momentum in reliance to the level 2290.
The RELIANCE has been trending upwards, but recently it broke through the higher low level at 2342 and dropped to a low of 2326.
However, the previous supply zone at 2326 has acted as a demand level, causing the price to rise weakly towards the upside.
At this point, it is uncertain whether the stock will continue to move higher or form a lower low.
Further analysis is required to determine the likely direction of the price movement.
Note:
As of now it is in bullish, slightly turned to be bearish as a low is formed and weak momentum is observed towards high.

Reliance Chart Analysis 12/2/23While the price is above the support 2306 price is expected to fall as the current support will get broken
❤️ If you find this helpful and want more FREE forecasts in Trading View
Be sure to leave a comment; let us know how you see this opportunity and forecast.
❤️ Your support is very much 🙏 appreciated!❤️

RELIANCE : near resistance RELIANCE : Down trend in hourly chart since many days. now its near to resistance for trendline & also near flip Resistance. Please watch closely (in 15 min chart ) all the candle formation and enter in trade. IF Breakout & retest of Flip level we can see 2600 on table and Nifty with our next target as per Nifty chart.
Like, Share, Comment for regular updates.
Disclaimer
I am not sebi registered analyst
My studies are Educational purpose only
Please consult with your Financial advisor before trading or investing

Reliance Industries 15 Min chart Demand and Supply Levels.Reliance Industries 15 Min chart Demand and Supply Levels.
Bullish Supply Range ( Go Long) - INR 1,801/- to INR 1,840/-
(Blue Circle in Image)
Bearish Supply Range ( Go Short) -INR 1,880/- to INR 1,876/-
(Red Circle in Image)
#RelianceIndustries #Reliance #India #StockMarket
Suggested Move - Short atINR 1,880/- to INR 1,876/-
(Red Circle in Image)
#RelianceIndustries #Reliance #India #StockMarket

Reliance Short Term View (AUGUST 2022 Only)Stay Long Above 2613, T1 - 2663, T2 - 2715.55, T3 - 2777.50..... SL 2554
Short Below 2554, T1 - 2499, T2 - 2488, T3 - 2479, T4 - 2432...... SL 2600

RELIANCE weekly analysis-Taken Support from MA @2545NSE:RELIANCE Reliance is showing good strength on charts and it has taken good support at 2545 levels.
If this level is not broken on next week, we can see higher highs in Reliance, which would stay UP until Crude Oil prices continue to stay high @120$ per barrel.
