RNDR | BULLISH ALTS | RNDR Incoming ATH Render has been one of my top alts since Jan 2024, and it hasn't disappointed, currently standing at 140% increase, and if you account for the ATH in March, 245%.
As Bitcoin trades range we're patiently waiting for Ethereum to make a new ATH. This will encourage the rest of alts to make a final push up, that is AFTER ETH made a new ATH. That's why it's so important to watch Ethereum, and the Bitcoin dominance chart.
More on that topic HERE:
____________________
GEMINI:RNDRUSD
Rendertoken

RENDER | HOW TO GET IN ?I initially entered SEED_DONKEYDAN_MARKET_CAP:RNDR positions around the $5 level, anticipating a strong move. With the market positioning itself for another potential breakout, SEED_DONKEYDAN_MARKET_CAP:RNDR is at a critical juncture.
The price is currently testing a significant resistance zone, and a clean break above this level could signal the next explosive move. Traders can look to board the train once this resistance is breached and confirmed, aligning with the broader bullish momentum in the market.
I keep my charts clean and simple because I believe clarity leads to better decisions. Trading doesn’t have to be overly complicated, and I enjoy sharing setups that have worked well for me.
My approach is built on years of experience and a solid track record. I don’t claim to know it all, but I’m confident in my ability to spot high-probability setups. It’s all about learning and growing together as traders, and I’m here to share what I see.
The markets can confirm what the charts whisper if we’re paying attention. I hope these levels help you as much as they’ve helped me in the past. Let’s see how this plays out!
My Previous Analysis
🐶 DOGEUSDT.P: Next Move
🎨 RENDERUSDT.P: Opportunity of the Month
💎 ETHUSDT.P: Where to Retrace
🟢 BNBUSDT.P: Potential Surge
📊 BTC Dominance: Reaction Zone
🌊 WAVESUSDT.P: Demand Zone Potential
🟣 UNIUSDT.P: Long-Term Trade
🔵 XRPUSDT.P: Entry Zones
🔗 LINKUSDT.P: Follow The River
📈 BTCUSDT.P: Two Key Demand Zones
🟩 POLUSDT: Bullish Momentum

RENDER | Characteristic of a ConsolidationYou can jump in to the train anywhere below 0.5.
RENDER is completing this type of consolidation in this way, but if it loses here, I can also evaluate the lower regions as a purchase. I had previously purchased RENDER at an average of $5.5 and shared my analysis here.
If we go below $6.961 we might see a pullback till $6.330.
My Previous Ideas
DOGEUSDT.P | 4 Reward for 1 Risk much more if you hold it.
RENDERUSDT.P | HTF Accuracy
ETHUSDT.P | Accurate Buyer Zone Identification | High Risk Reward if you hold it.
BNBUSDT.P | Accurate Buyer Zone Identification | High Risk Reward if you hold it.
Bitcoin Dominance | Great Characteristic Detection and Accurate Analysis

#RENDER / Ready to go up#RENDER
The price is moving in a descending channel on the 12-hour frame and sticking to it well
We have a bounce from the lower limit of the descending channel, this support is at a price of 4.20
We have a downtrend, the RSI indicator is about to break, which supports the rise
We have a trend to stabilize above the moving average 100
Entry price 5.57
First target 6.43
Second target 7.31
Third target 8.18

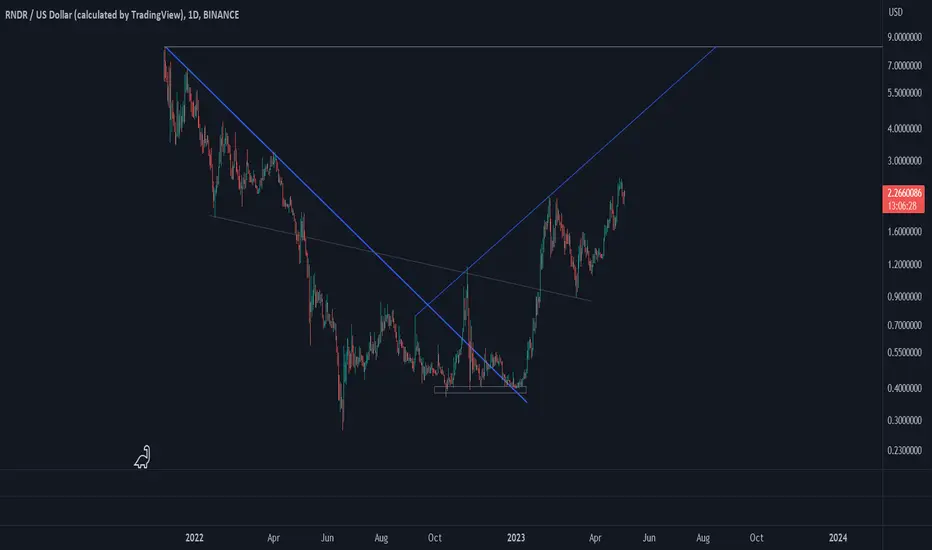
Render Token (RNDR)Render Token is an innovative project of sharing GPU computing power for consumers such as artists and graphic designers. At first, like many projects, RNDR price went down. After the downward move ended and price broke the downtrend line, an impulse upward wave started and price value increased significantly. It is possible an inverted harmonic pattern is forming; have to wait for the price to reach the previous highest high (horizontal line).
RENDERUSD Bottom accumulation almost over. Don't miss this buy.Render (RENDERUSD) has been consolidating within the 1W MA50 (blue trend-line) and 1W MA100 (green trend-line) for 3 months (since the week of July 29). This is the technical accumulation pattern that the token has gone through on every market bottom (green arc) in the past two years.
The 1W RSI has broken and been trading above its MA trend-line for the past 6 weeks, which is the first bullish sign and an indication that the current accumulation is almost over (similar to previous two bottom formations).
As a result, we expect an aggressive bullish break-out soon, the 3rd major rally towards the 2-year Higher Highs trend-line. Our Target is at least $45.00 (+300% more than the previous one).
-------------------------------------------------------------------------------
** Please LIKE 👍, FOLLOW ✅, SHARE 🙌 and COMMENT ✍ if you enjoy this idea! Also share your ideas and charts in the comments section below! This is best way to keep it relevant, support us, keep the content here free and allow the idea to reach as many people as possible. **
-------------------------------------------------------------------------------
💸💸💸💸💸💸
👇 👇 👇 👇 👇 👇

Might be the opportunity of the MonthI believe RENDER has huge potential. After a short term pull-back I think huge move will follow.

RENDER target 7.444h time frame
-
Entry: $4.8
TP: $7.44
SL: $4.11
RR: 3.74
-
(1) Potential rounding bottom on 1h
(2) Getting support twice at Fib projection 0.382
(3) Depend on time and space analysis, it might go over $7 before October
(4) Fib projection 1.13~1.272 is the target range around $7~$7.45
(5) Stop loss once going below $4.11


Is #RENDER still in a downtrend?#Render 1D chart;
Continues the downtrend that started in March with lower highs
It was last downtrending at $6.3 (CHoCH)
A close above the $7.2 level is required before we can talk about a rebound
Otherwise, the levels where it can go by making lower highs;
First OB support at $3.7
If it loses here, the IMB level will be $2.8.
Of course, although its first priority in every upward move is to overcome the previous low peak, it should not be forgotten that the downward trend line (red line) will also act as resistance.

RNDR: Render BEST BUY ZonesRENDER is one of my top altcoin pics for 2024.🏆
It increased a generous 305% since the beginning of the year, and a new bullish cycle is likely next s soon as we hit the ideal re-accumulation zones where whales prefer to buy back.
A -77% retracement hit the next major demand zone, where I expect to see a decent bounce. Between this zone and the lower zone , I'd be looking to re-accumulate for a loner term hold position:
👍 Follow Us to make sure you stay updated
_____________________________
BINANCE:RENDERUSDT

RENDER NEW VOLUME STARTRENDER seems to enter a new volume start, which can break the trend
At this moment render is interesting for the trend and on this reason we follow it.

Render Token / RNDRThe price of RNDR is $1.83 today with a 24hour trading volume of 180 million dollars. This represents a 4% price increase in the last 24 hours and a 333% price increase in the past 30 days!
Render token is a distributed GPU rendering network built on top of the Ethereum blockchain, aiming to connect artists and studios in need of GPU compute power with mining partners willing to rent their GPU capabilities out. Backed by parent company OTOY, the RNDR team is based out of Los Angeles, with team members throughout the world. The RNDR advisory board boasts industry leaders such as Ari Emanuel (Co-Founder and Co-CEO, WME), JJ Abrams (Chairman and CEO, Bad Robot Productions) and Brendan Eich (Founder and CEO, Brave Software and BAT)
bulls broke 0.8, 1.2 and 1.6 resistance and ready to claim 2$. I got into rndr wen it has 220 million market-cap and here we are at half a billion dollar mc. as you see market is in correction phase which is normal and healthy so don't panic if you see couple of red candles after 300% pump

RNDR: Key Buy-Back Zones to WATCHRender has completed its bullish cycle and is now moving steeply into bearish phase. Now this does not mean I am not enthusiastic about RNDR - In fact, it was on my list of top AI coins to watch for 2024:
I also called for higher prices early on. And now, it's time for a pullback.
This is NOT a bad thing - it gives you a chance to buy back in at lower prices, in anticipation for the next rally! I've market two zones for each timeframe that I will be watching as potential zones for spot buys.
Don't miss yesterday's analysis on ETH:
_______________________________
BINANCE:RNDRUSDT

RNDR: Pullback in UptrendTrade setup : Price is in an Uptrend. It broke out of a Channel Down pattern and reached $12.00 for +50% gain. Now we look for an entry in Uptrend. Pullback to $10 support could be a swing trade entry with +20% upside potential to $12.00 again. Stop Loss (SL) level at $9.20.
Pattern : Pullback in Uptrend. Price remains in an Uptrend but has pulled back, which could present a 'buying dip' opportunity. Traders should look for the nearest support level where price could stabilize and resume its Uptrend. This support level could be a level where price bounced off of in the past, or a level that was previously resistance. (concept known as polarity).Learn to trade key levels in Lesson 3.
Trend : Short-term trend is Up, Medium-term trend is Strong Up and Long-term trend is Strong Up.
Momentum is Bearish (MACD Line crossed below MACD Signal Line). Price is neither overbought nor oversold currently, based on RSI-14 levels (RSI > 30 and RSI < 70).
Support and Resistance : Nearest Support Zone is $10.00, then $8.00. Nearest Resistance Zone is $12.00, then $13.80.

RNDR : BULLISH, Despite the Dip - Here's Why👇COINBASE:RENDERUSD
A rare pattern is observed on Render in the daily - a near perfect W Bottom pattern.
Now there are a few rules for a chart pattern to qualify and we're not quite out of the woods yet. The next phase should be a retest of the neckline, where we need to keep CLOSING daily candles ABOVE. A break under this support zone will invalidate the pattern.
From a technical chart analysis perspective; if you trade chart patterns you should be able to successfully take a long on the support zone. All considering, this will be a medium-risk trade:
Another confirmation from technical indicator, the green trendline is a potential wick zone (price on the right pane):
Falling perfectly in the center:
_______________________________

Render RNDR price shows strong movementIf we look at the chart of #RNDRUSDT on the daily timeframe, we can see that in recent months, the ‘buyer’ has been aggressively active in the $6-8 range.
Currently, CRYPTOCAP:RNDR is trading in the $10 range, but to be completely convinced of the serious intentions of buyers, I would like to see an aggressive defense of $7.70-8
📝Higher trading volumes in this range, ‘shadows’ on the candles from below, aggressive bounces upwards - all this will indicate that #Render buyers are not planning to let the price go lower.
And this, in turn, will be a good signal to buy the asset with a holding target in the medium to long term.
_____________________
Did you like our analysis? Leave a comment, like, and follow to get more

RNDR Wave C SetupRNDR is currently ascending in a three-wave ABC structure, with wave A equaling wave C in target. The asset is now deep in the support zone, presenting a good opportunity to scale in for the upcoming wave C target of $25. It's advisable to begin scaling out early around $19, at the 0.786 level, rather than waiting for the precise target of $25.92.

RNDR: wait for confirmation📊Analysis by AhmadArz:
🔍Entry: 7.792 - 7.237
🛑Stop Loss: 6.420
🎯Take Profit: 8.736 -9.743 -10.761 -11.915 -12.590
🔗"Uncover new opportunities in the world of cryptocurrencies with AhmadArz.
💡Join us on TradingView and expand your investment knowledge with our five years of experience in financial markets."
🚀Please boost and💬 comment to share your thoughts with us!

RNDRUSDT(Render Token) Daily tf Range Updated till 15-04-24RNDRUSDT(Render Token) Daily timeframe range. compare to other alts and market plunge. its holding not bad. need to break 10.014 to reclaim older zone above that is price discovery. breaking 6.764 will led it to 3.651.

RENDER BUY NOW!! (Don't Miss Out!!!!)THIS IS IT. This is the dip we are looking for, as the bitcoin halving approaches, sell orders are being triggered before the big run up!! I wont be surprised if it came back down lower, so long as it does not hit the Swing Low I am confident this will breach ATH.

RENDER Long OPPORTUNITY!! LAST CHANCE!!Where price is @ currently, is a good position to buy and hold. You can pay yourself out a bit on each target profit marked. You should leave a bit more on the side for the long term run up.
Idea: Price will make the interweek low, Tuesday - Thursday(I know i said Wednesday on the chart but T-TH is the ideal spot) and have a run up taking out Mondays high! Right Away you should pay yourself a little bit and continue on forward. Price will trick people to think it will DUMP, triggering sell stop on a "broken support" level, and make a run up, causing people to lose money and make the whales, institutions, etc, more money. This is currently at a discounted price level. These are key things to look out for: consolidation, manipulation, expansion.
Consolidate: Building up liquidity in a small range, in other words, make buy/sell stop orders to target where the money is.
Manipulation: Trigger stops, other words, make people believe we are heading in the direction retailers expect
Expansion: Expand to the opposite direct, in other words, take their money and go!

Render (RNDR) is setting up for upto 12.50% pumpHi dear friends, hope you are well and welcome to the new trade setup of Render Token (RNDR) with US Dollar pair.
Previously we caught almost 70% pump of RNDR as below:
Now on a 4-hr time frame, RNDR is about to complete another bullish AB=CD move for the next pump.
Note: Above idea is for educational purpose only. It is advised to diversify and strictly follow the stop loss, and don't get stuck with trade.
