SMCI: When a chart says it’s time to reconnect with the AI hypeOn the daily chart, Super Micro Computer Inc. (SMCI) is showing a clean bullish setup. Price broke out of a descending trendline (green dashed), confirmed it with a retest, and is now consolidating above the breakout zone. The golden cross — where the MA50 crossed above the MA200 — confirms a long-term trend reversal.
Volume profile indicates strong accumulation near $41–43. The 0.5 Fibonacci level at $41.84 acted as support. Above the current range, there’s low volume resistance up to $63.57 (0.786), followed by $66.44 and a final extension target at $79.82 (1.272).
Fundamentals: SMCI is a leading server hardware manufacturer. Demand for their systems has soared with the explosion of AI infrastructure. The company maintains solid financials, with rising quarterly revenue and growing presence in the cloud sector. Institutional investors have been actively increasing their positions since late 2023 — a sign of strong long-term conviction.
Tactical plan:
— Entry: market $42–43
— Target 1: $55.91
— Target 2: $63.57
When technicals scream textbook breakout and fundamentals bring AI momentum to the table — it might just be one of the best late entries in the AI wave this summer.
Repost

AMD 1W: If Not Now — Then When?The weekly chart of AMD looks like it’s holding its breath: a well-defined falling wedge, double bottom support, and price pressing right against long-term trendline resistance. Everything’s in place — now it just needs to break and run, preferably without tripping over nearby Fibonacci levels.
The stock is trading around $114 and attempting to hold above the 50-week MA. Just ahead is the 200-week MA (~131) — not only a technical hurdle but also a psychological pivot. A move above it could reignite talk of $150+ targets.
The wedge has been narrowing since late 2024. After repeated bounces off support, price has returned to the top of the pattern. A confirmed weekly close above the wedge could trigger a real breakout. Without that — it risks yet another scripted pullback.
Key Fibonacci levels:
0.618 — $133.60
0.5 — $151.42
0.382 — $169.25
0.236 — $191.30
0.0 — $226.95 (all-time high)
The roadmap looks clean — but only if volume follows through. There are signs of quiet accumulation at the bottom, but no explosive buying just yet.
Fundamentals:
AMD delivered solid Q1 results: revenue is growing, EPS beat expectations, and margins are holding. More importantly, the company launched a new $6 billion stock buyback program — showing clear internal confidence in its long-term trajectory.
There’s also a strategic AI partnership underway with a Middle Eastern tech group. This move positions AMD to challenge not just for GPU market share, but for future AI infrastructure dominance — long game stuff.
Analyst sentiment has turned bullish again, with new price targets in the $130–150 range. All of this makes the current chart structure more than just technical noise — it’s backed by strong tailwinds.

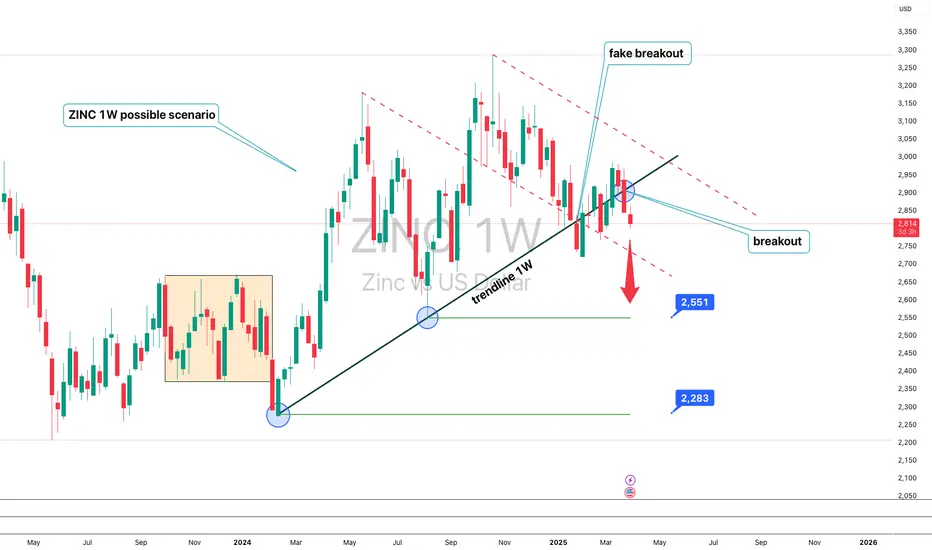
Zinc (ZINC) – Technical Analysis 1WThe price has broken below the 1W trendline, confirming a bearish scenario. After a fake breakout, the price moved downward and is now targeting 2551 and 2283. A breakdown below these levels could accelerate the decline. RSI shows weakening momentum, MACD signals a bearish crossover, and EMA 50/200 suggest further downside. Fundamentally, zinc prices depend on industrial demand, macroeconomic conditions, and USD strength. The main scenario is a drop to 2551 and 2283, while a recovery above 2900 could push prices toward 3100.
BITCOIN (BTC) DAILY POST (1/2) - LOG CYCLE (REPOST)
This is a repost of my previous post that got taken down because I was "not respecting the house rules" - sorry for the inconvenience caused.
See for yourself if my scenarios worked out !
-
-
-
- based on cycle and log spike support/resistance lines
---------------------------------------------------------------------------------------------------------------------------------------------------------------------------------------
If you enjoyed this post and agree with me, a like and a sub would be very nice : )
If you have any other ideas or simply disagree, manifest yourself in the comments ⬇️⬇️⬇️
Stay updated for more content
Have a nice Day : ) Bye!
---------------------------------------------------------------------------------------------------------------------------------------------------------------------------------------

OIL REPOSTREPOST for my best setup, first move already happened now maybe we see correction as setup expects. But longs are ON.
Please share the setup, give a thumbs up if you enjoyed and give me your thoughts and what you think on it.
Have good trading results in oil with this analysis as many as viewers of it already did!!!

Trade Ideas Analysis: NZDJPY H&SThis is a repost of the previous head and shoulders bottom formation. trade already engaged and targets and stops sent to subscriber.
If you do not wish to miss any trade ideas, just subscribe to us

Collection of previous & banned signals!#REPOSTHey guys,
I`m sorry - I made the mistake and posted content whose violated the house-rules of tradingview.
I decided to repost them because they were awesome trades. :-)
If you still hold / trade them, you can check the update-section and take a look at the analysis.
Peace and good trades
Irasor
Wanna see more? Don`t forget to follow me.
Any questions? PM me. :-)
