EURUSD-Weekly Market Analysis-Jan22,Wk2A Happy New Year to you. Yes, we are back on our Weekly Market Analysis, how have you been?
EURUSD on the 4hourly chart we have a Bearish Gartley Pattern that will be good for a shorting opportunity as the candle respected the PRZ zone of the Gartley Pattern more than the 1 that form in the GBPUSD. Check the comments at the bottom of TradingView for quick access.
However, breaking and closing above the red line or X for the conservative traders, and that will change our perspective and may not trade the Harmonic Pattern as the ascending triangle got back on track.
I'm waiting for market open and will engage the trade 2hours after the market open. If the market gap up, I will forgo the trade.
Resistance_level

What's up with Netflix $NFLXFor this analysis we are looking at the daily timeframe.
NFLX is in a nice uptrend, but currently we are seeing a retracement, which is the chance to buy a nice stock at a smaller price.
Netflix recently broke the upper resistance of an ascending triangle formation, which is a bullish sign. The break was followed by a fastly reached ATH from which the price dropped to the 550$ mark, which is 1. supported by a weekly trendline (TL) and 2. the upper resistance (now support) of the previously broken triangle pattern, which suggests that rn could be a good time to enter a long position, right? But before spending your hard earned money right away, have a look at the $NFLX earnings (January 27th). $NFLX lately tends to fail analyst expectations on earning reports (and $NFLX tends to perform better in Q1-Q3), the rather small drops after failing those kind of reports (as long as the expectations aren't missed drastically) tend to be corrected after a couple weeks, but this drop in price could give you a chance to buy a second position.
Idea: enter a long position during the next week (since we need confirmation that our supports are stable), your TP could be at the previous ATH (21% gain if you decide to enter where I will enter (you can see the trade entry on my chart))
As always: no financial advice

Oberoi RealityGet ready to board OBEROIRLTY departs above 915, Oberoirlty about to break very strong resistance with got rejected multiple times.
Buy only above 915 with mentioned stoploss & target.


BAJAJELECBajajElec broke out of strong resustance with volume.
Buy BajajElec with sloss mentioned with tgts of 1356/1374/1394

TatasteelTatasteel breaking out of strong resistance zone.
Could be bought with mentioned sloss & tgts.

Cummins IndiaCummins breaking off resistance with decent kind of volumes.
Buy with mentioned sloss & tgt.

CiplaCipla Breaking out of multiple time resistance zone of 902-905.
Could be bought with mentioned sloss & tgts.

USDCAD Reversal?USDCAD just had it's highest daily close of 2021 on Friday 17th December, at 1.28912. Daily highs have exceeded this level 3 times this year but each time the price was rejected and the price failed to close above that level.
So as priced has reached the highest daily close since December 22nd 2020, it has entered this area of rejection shown on the chart, while also displaying clear Bearish RSI Divergence as price climbs to the high while RSI slopes down.
While we may be in a new uptrend - creating a new higher low in October and pushing for new 52week highs would suggest so - this looks close to a prime spot for USDCAD to take a breather and see a short term reversal.
That being said, this is absolutely a spot where waiting for some confirmation of a reversal is a must - at the time of writing the momentum on lower time frames is strong, and bulls will have their eyes set on the nice round number of 1.29500, just a hairs breadth above the high of year achieved on August 20th.

$TSLA - Rejected at Resistence Not the best look for $TSLA as we got a rejection off of the diagonal overhead resistance today.
We've got a decent supply zone below but I would avoid going long on this name until we break to the upside or get a bounce underneath.

TatasteelTatasteel is breaking out resistance zone of 1120-1124.
Could b bought with mnetioned sloss & tgts.

Last line of resistance! DOT :(Again, TAKE PROFITS!
Unless you put your money for a very large time you should be learning to take profits, manage your risk and pick the right assets. DOT is still great fundamentally but if it drops form this line it might be like ADA this last 3 months, but hold the logline that is in the previous analysis at $19
*Disclosure: I own DOT spot and not selling everything right away.
Trade like institutions

EURCAD AT KEY RESISTANCEEURCAD has reached a zone of strong previous rejection.
Touching 70 on the RSI with Bearish Divergence and having entered this area of previous rejection sets up for a potential short with tight stoploss above the area of rejection.
CAD CPI numbers came in line with expectation today with a continuation of trend but we're looking short term overbought with very positive risk/reward possibilities for shorts.

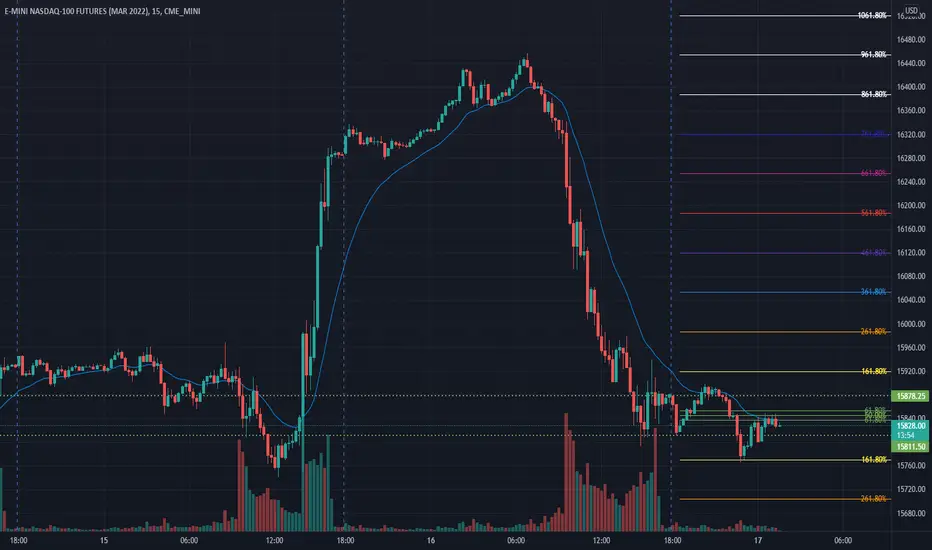
NQ Power Range Report with FIB Ext - 12/17/2021 SessionCME_MINI:NQH2022
- PR High: 15878.25
- PR Low: 15812.00
Evening Stats (As of 1:27 AM)
- Gap: = N/A
- Session Open ATR: 341.09
- Volume: 52k
- Open Int: 210k
- Trend Grade: Neutral
- From ATH: -5.5% (Rounded)
Key Levels (Rounded - Think of these as a range)
- Long: 16963
- Mid: 16391
- Short: 15819
Keep in mind this is not speculation or a prediction. Only a report of the Power Range with Fib extensions for target hunting. Do your DD! You determine your risk tolerance. You are fully capable of making your own decisions.
IGLIGL broke out of monthly resistance which was rejected multiple times. Finally IGL broke out og it.
Buy with sloss of 495 & tgt of 536.

EURUSD DESCENDING CHANNELGot a descending channel here, My first target is the purple zone, 2nd target is the bottom of the channel.
If you have any questions, leave a comment. Also if you have a different analysis of what is to come, let me know in the comments.
If you like this idea, like and follow my account :) I do weekly analysis for overall direction for the week, every sunday, as well as post daily on daytrades or short term swings I am planning to take.
DO NOT EXECUTE A TRADE JUST BECAUSE A STRANGER ON THE INTERNET HAS A COMPELLING ANALYSIS> DO YOUR OWN ANALYSIS.

US30 BETTER THAN EXPECTED JOBLESS DATAOANDA:US30USD
Today jobless data report was better than expected .
We have US30 at critical support, expecting a bounce from this level and re-test the previous "RESISTANCE" level for the week. at around 35700 range

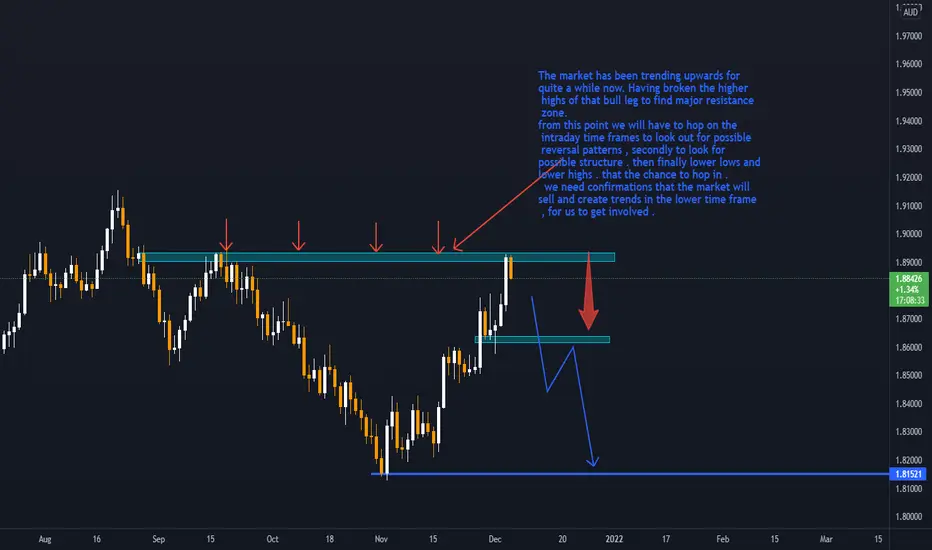
GBPAUD SELL The market has been trending upwards for quite a while now. Having broken the higher
highs of that bull leg to find major resistance zone. from this point we will have to hop on the
intraday time frames to look out for possible reversal patterns , secondly to look for
possible structure . then finally lower lows and lower highs . that the chance to hop in .
we need confirmations that the market will sell and create trends in the lower time frame
, for us to get involved .
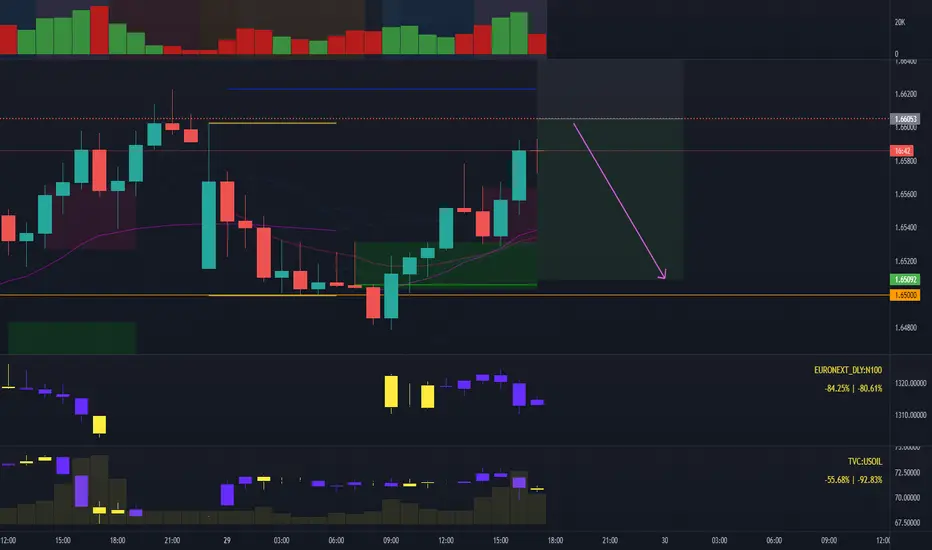
Simple resistane shortThis is a simple resistance bounce setup. There was a significant fall in oil and stocks as well as growth in EUR pairs. I don't believe the move was genuine. More likely, just a squeeze.
$LGVN entry PT 25 Target PTs 43-49 and higherLongeveron stock is up by a multiple of 11 after the FDA gave a Rare Pediatric Disease designation for a heart medication last week.
Longeveron Inc., a clinical stage biotechnology company, engages in developing cellular therapies for aging-related and life-threatening conditions. The company's lead investigational product is the LOMECEL-B, a cell-based therapy product that is derived from culture-expanded medicinal signaling cells that are sourced from bone marrow of young healthy adult donors. It is conducting Phase 1 and 2 clinical trials in various indications comprising aging frailty, alzheimer's disease, metabolic syndrome, acute respiratory distress syndrome, and hypoplastic left heart syndrome. The company was incorporated in 2014 and is headquartered in Miami, Florida.

BTCUSDT 58K local resistance is ahead breakout and pump?price again is near resistance zones and at previous times we had a correction from these resistance zones.
The main resistance ahead for BTC is 60K$ resistance and the main support is 52K$ support. (daily)
breaking these trendlines here can make price stronger and only after breaking 60K$ price can easily pump and the market is again bullish.
Else we have more range here like previous times.
DISCLAIMER: ((trade based on your own decision ))
<>

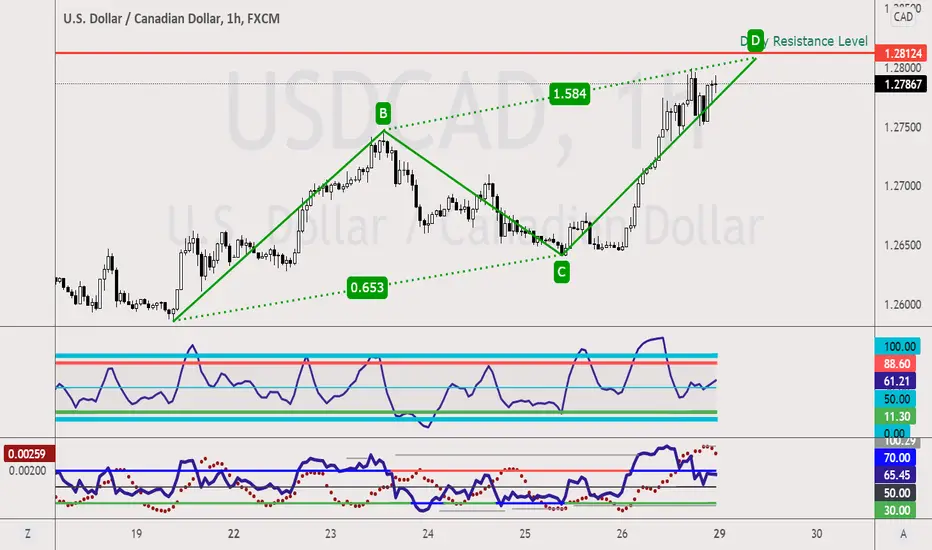
USDCAD - Bearish ABCD PatternThe market setup for this week is interesting. We have a couple of setups that work on the lower timeframe and we have seen a couple of AB=CD pattern setups and complete.
USDCAD has an AB=CD pattern setup on the 4-hourly chart that works on the 1-hourly chart as well. What I would like to see in this Bearish ABCD pattern is that it touches 1.2812 which is also the previous Resistance Level on the 1-hourly chart. A Double Top with RSI Divergence would sweeten the deal.