GILD 6-Year Resistance IdeaGILD is pushing a 6-year resistance line. It broke through for a few days a year ago before being battered back down. Let's see if it'll make the move stick this time.
Resistance_level

XAUUSD|Trading positions in multi-time framesHello guys, I hope you are doing well. We have the gold chart in 1 hour time frame:
For gold, if you remember, we had an bullish order block area, which moved up well upon reaching this area, and it has also started to move up in the return to the candlestick that was formed in one hour and the demand area was formed.
The point that is important in the one-hour timeframe is the level (2030), which is a resistance on the way of gold.
But if we have a close candle above this level, we can hope for its upward trend until the next supply area, which is around (2038-2041).
In the time frame of 15 minutes, we have the refined area of that one-hour supply area, which we can enter selling positions when the price reaches this area.
In the 4-hour time frame, we had a support, and when we reached it, we moved upwards. As long as it is maintained, gold can achieve higher targets, but if this area is broken down, the numbers that can be expected are the supply areas (2005 -2008) and the next area (1990-1995).

GBPNZDIs GBPNZD exhausting at resistance zone?
As the price is been on high bull run but now it seems like price is lacking bullish momentum after printing double top pattern at resistance level and bearish divergence( on lower time frame) suggesting the sell pressure is about to start.
If the bears took control , the 1st target could be 2.0300.
What you guys think of it?

⤵⤵DXY INDEX FULLBACK DOWN 👇he'll traders what do you think about dxy)
Dxy index hit resistance levels trandline fullback down 👇 101•000 100,000
TVC:DXY

Anticipating Prolonged Bearish Consolidation for BTCAnticipating Prolonged Bearish Consolidation for BTC: Brace for Support Levels as I Hold a Short Position
I hope my support zones will be visited soon. Planning to take partial profits within those zones...

FDC Facing resistance after 3 months.FDC is facing resistance after August 2023. If it breaks either we can go long or wait for it to retest. Or is on weekly timeframe so I may go long immediately instead of waiting for it to retest.
15% achievable.

Retesting is the real deal 164.IEX is retesting 164 and if it takes off then it will take off for good. It's a good stock and on the weekly time frame it looks to take off. If it does take off then get on the trade.
Anywhere between 12-18% is achievable in a fairly good timeline of a month or 2.

Is INFY at a great resistance?Is Infosys at a really important resistance? Can we go long if it breaks? Or should we wait for retest upon breaking the resistance?
Mukund

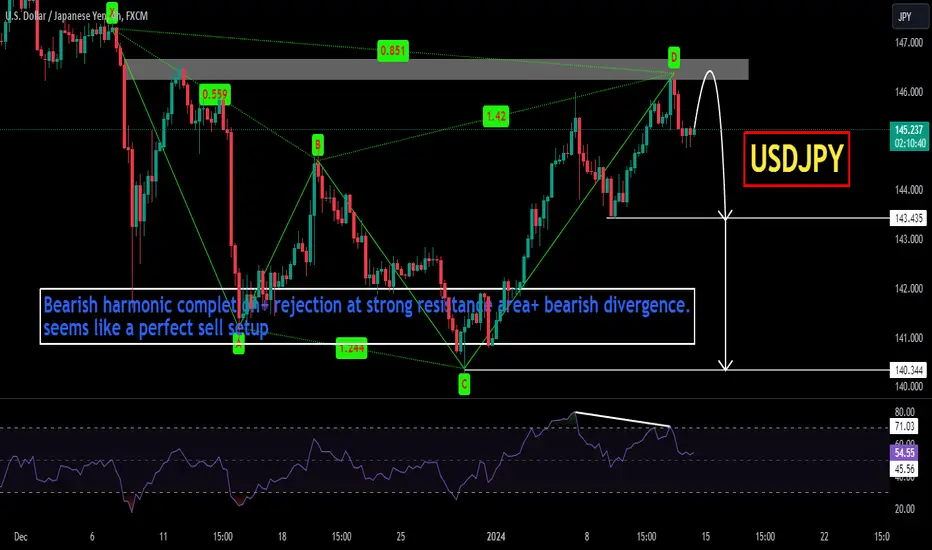
USDJPYIs USDJPY exhausting at strong resistance level?
As the price is been on high bull run but now it seems like price is lacking bullish momentum after reaching at resistance level and bearish divergence suggesting the sell pressure is about to start.
If the bears took control , the 1st target could be 143 followed by 140.
What you guys think of it?
EUR/AUD ↘️ Short Trade Setup ↘️Hello Everyone.
Resistance level
💲 Entry Point : 1.64310
🟢 TP 1.62435 🔴 SL 1.65190
Please support us with like & comment & Follow
Disclaimer
---------------
Trading is risky we all take loses
your responsibility is to not take more than 1% to 2% loss per trade and double your profits.

EURJPYIs EURJPY exhausting at resistance zone?
As the price is been on high bull run but now it seems like price is lacking bullish momentum after printing double top pattern at resistance level and bearish divergence( on lower time frame) suggesting the sell pressure is about to start.
If the bears took control , the 1st target could be 157.
What you guys think of it?

GBP/USD DELL ↘️ Short Trade setup ↘️Hello Everyone 🙋🏽♂️
Breakout + resistance not breaking
💲 Entry Point : 1.27153
✔️ Tp 1.23510
🔴 SL 1.28575
We are not responsible of any losses for anyone, our trades are profitable more for long terms and we take losses as everyone,
manage your lot size as well and your SL and TP and my opinion is 0.01 lot for each 500 $.
Don't forget to hit the like bottom and write a comment to support us.
Follow us for more 🙋🏻♂️
Best Regard / EMA Trading .
Disclaimer:
----------------
It's not a financial advise, As everyone we take losses sometime but for long term trading we are profitable traders, so manage your account well with SL and TP and your lot size to keep your account safe and stay in the market

Uncertain EURUSD, but These Levels are likely ImportantUncertain EURUSD, but These Levels are likely Important
Dear Esteemed Members,
I know when I say the EUR can go up or down, doesn't seem to be useful, but I believe the outcome depends on resistance or support break and fundamental factors.
As per the latest technical analysis updates, it is widely agreed that the EUR/USD exchange rate is currently experiencing a downtrend. Examination of the four-hour chart reveals that the pair remains below both the 50- and 100-hour exponential moving averages in a downward trajectory. The relative strength index (RSI) is also bearish, dipping below 40, reinforcing the prevailing bearish sentiment. Immediate support is identified at the 1.0920 level (200-hour exponential moving average), followed by the 1.0880 level (lower boundary of the rising regression trend channel) and the 1.0850 level (Fibonacci retracement of the latest rise).
Conversely, potential resistance levels for the EUR/USD are at the 1.0970 level (100-hour exponential moving average), the psychological and static level at 1.1000, and the 1.1050 level (midpoint of the rising channel).
In addition to technical factors, fundamental influences shape the EUR/USD exchange rate in the coming days. Attention focuses on the upcoming United States December labor market report, encompassing non-farm payroll (NFP) changes, average hourly earnings growth, and the unemployment rate. Market expectations project a 170,000 increase in NFP, a decrease from the 199,000 recorded in November. A higher-than-expected NFP could bolster the US dollar, exerting downward pressure on the EUR/USD exchange rate. Conversely, a lower-than-expected NFP may weaken the US dollar and elevate the EUR/USD exchange rate.
Kind Regards,
Ely

GBPJPYGBPJPY is trading in range bound with 500 pips range.
some time ranges are the best things to play just buy the support and sell the resistance.
as this one is 500 pips range which can deliver fine risk to reward.
currently the price is at resistance level and being rejected due to sell pressure.
will the pair head back to support area ?
what you guys think of this idea ?

BITCOIN|A correction and continuation of the BULLISH trendAfter reaching the 4H resistance zone, Bitcoin experienced a sharp drop.
In my opinion, this was a movement to correct the trend, and according to the previous analysis, we can hope for the continuation of the upward trend.
Continuing the movement of the new resistance area of 45100 and 46450 are still Bitcoin's targets for the future.

The Royal Trapping of Retailers - Pre-warnedOn Dec 20 - almost 10+ sectors in Nifty faced their individual resistances together - which " Triggered " a coordinated sell-off.
I once again say the word - Trigger because FIIs and DIIs just kick started a sell-off and Retailer investors fell into the trap when they saw all their stocks across sectors started falling together. Just panic selling. At the end of the day FIIs and DIIs bought all the stocks resulting in Net +3000 crore of Buy activity despite major fall across all sectors
I wrote a 8-part article already about this on same day. Additionally I Pre-warned on Dec 31 that similar situation is expected to happen on Jan 1st week as 6 out of 13 sectors are meeting their long term resistances together.
Today - it came to Life. Another big round of sell-off across many sectors but net activity of FIIs and DIIs are both on BUY side. So who got fooled ? Who got trapped Royally?? It's us the Retail investors who once again don't have the perseverance, the technical knowledge of charts , the conviction on their own portfolio falling prey to Panic Selling.
We need to " Learn to Ride the Tide irrespective of its Side "
Thats the moto of our group - Stocks-n-Trends
Team Stocks-n-Trends

Bitcoin(BTC): Rejected $45K Zone!!!We got what we came for!! We have a very nice rejection near the $45K zone, which shows demand for further movement to lower zoes.
Remember, the longer the tree grows, the harder it falls. We are still way too expanded and overbought on BTC, so keep your eyes open for potential further movement to lower zones!
The start looks promising, but we gotta be careful for any short-squeeze!
Swallow Team

Nifty - Surgical Precision Target & CorrectionOn Weekly Chart - After the Cup and Handle BO - Nifty retested the BO zone and bounced forming a Rounding Bottom BO. The Target for RB is 21820. The Multi-year trendline resistance is likely to cross around 21900-22000. Given India Vix BO, Nifty might face sharp correction after testing 21820-21900 levels. Keep a tab on individual stocks and their support levels
After reaching the Target of Rounding Bottom BO at 21,820 - Nifty faced with a Sharp Correction Precisely from the target level
This is the speciality of Technical Analysis. Technical Analysis is NOT based on Hope / Expectation / Trust on Management / Company / not a Future Forward state. A Chart Pattern is formed by "Herd Consensus" - How Majority People Behave, How Big Players / Operators create a situation of Demand / Panic Selling manipulating the minds of Majority Retailers.
Technical Analysis is simply a Scientific & Mathematical model of Human Behaviour and I see it as my Bhagavad Gita / Holy Bible / Quran. It already encompasses Hyped News messages from Media, Fraudulent attempts of some company management, Actions by Regulators, Company's product focus, future vision everything and is engraved in stone and hence cannot be changed.
This is why and how Technical Analysis works successfully
Disclaimer:
Stocks-n-Trends is NOT a SEBI registered company. We do not provide Buy / Sell recommendations - rather we provide detailed analysis of how to review a chart, explain multi--timeframe views purely for Educational Purposes. We strongly suggest our followers to "Learn to Ride the Tide" and consult your Financial Advisors before taking any positions.
If you like our detailed analysis, please do rate us with your Likes, Boost and share your comments
-Team Stocks-n-Trends

Can 1st Week of 2024 avoid the Thunderstorm of Dec 20, 2023 ???Remember the Great Sudden Multi-Sector Fall of Dec 20, 2023 where Almost all Sectors of NSE/BSE fell together ???
Refer our 8 Part Series - Decoding the Mystery of the Dec 20 Fall for more explanation of why we faced Major Selling Pressure Across Sectors
Is there a possibility of something Similar on the New Year Week ??? - Before we say Yes / No - let's first understand what happened on Dec 20, 2023.
If 1 particular Sector (ex: Small Cap) faces its resistance, major small stocks is expected to face a correction. When we have diversified portfolio with multiple sectors - we will still have a healthy Day P&L as other sectors provide some support
When All Sectors face their Resistance together - most of the stocks in your portfolio will see RED same day which triggers Panic Selling of weak hands - which aggravates the situation further.
1st Week of Jan 2024 is facing similar situation. 6 out of 13 Sectors what we reviewed are facing their Resistance together. Rather than saying its "Time to be Cautious", I would suggest "Its Time to be Brave". There could be a Panic Selling again from Retail investors, but its just a normal Correction. Those who held their nerve on the Dec 20 crash would vouch for the fact that their Portfolio recovered fully / more than the fall within next 2-3 (or max 5) sessions.
Small Cap
Mid Cap
Energy
Realty
IT
Nifty
The Remaining 7 Sectors - Look good with BO and more room for Upward move. So, this time, it won't be as bad as Dec 20 and if people realize their Mistakes from Dec 20 and hold their nerve - we can collectively overcome the situation
7 Sectors that are Bullish / Have more room for Upside:
Pharma
Media
Metal
Auto
Finance
Bank Nifty
FMCG
If you like our analysis - please do share your views, likes, Boosts and support us
- Team Stocks-n-Trends

STRAX: Building Momentum for a Breakout! 🚀💹Introduction: 🌐 STRAX is under the spotlight as the trader strategically accumulates for potential gains! The coin has been consolidating within the historical resistance zone of $1.19 - $1.27 for the past two months. With substantial accumulation and significant volumes, the trader anticipates an impending breakout, projecting bullish momentum in the coming weeks.
Trade Plan: ✅ The trader has acquired a mid-term position on STRAX, observing the coin's consolidation near the historical resistance zone. The accumulation phase, coupled with substantial volumes, fuels the expectation of an impulsive breakout and subsequent upward movement.
Technical Analysis: 📊 Examining the chart, STRAX has been approaching the historical resistance zone of $1.19 - $1.27 for an extended period. The trader identifies the impressive accumulation and substantial volumes, signaling a potential breakout. The anticipated breakout is expected to initiate a sustained upward trajectory.
Risk Management: 🚨 To manage risks, the trader suggests placing a stop, at the discretion of the investor, at approximately $0.897.
Targets: 🚀 The trader has marked potential targets on the chart, providing a visual roadmap for prospective gains.
Conclusion: 🌟 STRAX beckons traders to join the momentum-building phase as it eyes a breakout from the historical resistance zone. With strategic accumulation, substantial volumes, and outlined targets, the trader anticipates a bullish surge in the coming weeks. Prepare for potential gains with STRAX! 💹🚀

SOL Analysis: Navigating the $100 Milestone! 🚀💯Introduction: 🌐 Solana (SOL) has made an impressive journey, surging beyond the crucial $78 resistance and reaching the psychological milestone of $100. While breaching $100 remains a challenge due to profit-taking expectations, the analyst anticipates potential pullbacks from this level.
Key Levels: ❗️ The immediate focus is on solidifying above $80, ensuring a sustained upward bias. Maintaining this level is crucial for preserving the bullish outlook. Despite the struggle to breach $100, pullbacks are expected, given the profit-taking sentiment among many traders.
Short-Term Outlook: ⚠️ The primary goal is to establish SOL comfortably above $80, and ideally, surpassing $100. This strategy aims to secure an ascending priority, setting the stage for continued growth once profit-taking subsides.
Medium-Term Targets: 🎯 With a successful breach of $100, the analyst eyes medium-term targets at $120 and $140. These milestones appear achievable in the coming months, given the current positive trend.
Conclusion: 🚀 Solana enthusiasts are advised to closely monitor SOL's price action. The immediate focus is on consolidation above $80, with an optimistic outlook for breaching $100. As profit-taking stabilizes, the trajectory points towards $120 and $140 in the medium term. Stay tuned for further developments! 💹🌟

BTC Analysis (22.12): Bullish Flag Signals a Surge Towards $45-4Introduction: 🌐 Bitcoin (BTC) is painting a promising picture on the 4-hour chart with the formation of a "bullish flag" right above the breached resistance zone and below the -27% Fibonacci level. A breakout above the flag's upper boundary is anticipated to initiate a rally towards $45-46K.
Technical Analysis: 📊 The 4-hour chart showcases the development of bullish patterns, breakthroughs of crucial resistances, and compression leading towards potential bullish movements. The overall market sentiment is positive, with special mention of SOL, achieving the significant psychological mark of $100.
BTC ETF Approval Expectations: ⚠️ The anticipation of spot BTC-ETF approval early next year adds to the positive market outlook. This expectation, coupled with the formation of bullish patterns, contributes to the upward momentum, particularly in altcoins as BTC dominance locally declines.
Trade Scenario: ❗️ With a bullish flag in play, the analyst expects a breakout beyond $44K, paving the way for an ascent towards $45-46K. In the best-case scenario, a surge towards $48-50K is deemed plausible. These figures appear realistic, especially considering the positive ETF-related news.
Conclusion: 🚀 Bitcoin is gearing up for a potential surge, with the formation of bullish patterns and positive market factors. Traders are advised to watch for the breakout beyond $44K, setting the stage for an exciting journey towards $45-46K and beyond. Stay tuned for further updates as the market dynamics unfold! 💹🌟

ETH: Breaking Boundaries and Soaring High! 🚀💹Introduction: 🌐 Ethereum (ETH) is breaking free from the confines of a descending channel, signaling a pattern of continued upward momentum. Traders are eyeing a potential long entry, with the option to wait for a retest and bounce. Let's delve into the details of this exciting scenario.
Trade Details: 💰 Long enthusiasts are entering the scene, considering positions at ~$2300 - $2240 - $2200. The strategy aligns with the breakout scenario (as per the provided link) or opting to wait for a retest for a bounce.
Technical Analysis: 📊 Ethereum's price has breached the upper boundary of a descending channel, indicating a pattern conducive to sustained upward movement. The potential long entry points offer traders flexibility, either entering immediately upon the breakout or waiting for a retest.
Expectations and Targets: 🎯 Traders eye ambitious targets of $2340 - $2370 - $2400 - $2450 - $2500 as Ethereum ventures into a potentially robust bullish phase.
Stop-Loss: 👎 To mitigate risks, a stop-loss is set at $2150, safeguarding traders from unexpected market fluctuations.
Conclusion: 🚀 Ethereum invites traders to ride the wave of upward momentum. Whether you enter immediately or patiently wait for a retest, prepare for an exhilarating journey as ETH aims for new heights! 💹🌟
