USDJPY Potential Setup Here's a little video I've done analysis on USDJPY. A very good pair that generate major pips once you mark up properly.
I am currently waiting for a potential breakout and retest and then either ride to the downside or up. As we know sometimes the market can go the opposite but its your duty to have another potentially setup Breaking some form of Structure .
Resistancebroken

Is $PAG recovering from its pull back?Notes:
* Strong up trend on all time frames
* Great earnings track record
* Pays out dividends
* Coming up on the right side of its base
* Basing for the past ~9 months and creating a base within a base
* Just breaking above the ~112 (historical resistance weekly chart) area with higher than average volume and bullish price action
* In the Automotive industry which is pretty hot right now
* Using the 50 day line as a dynamic level of support for the past several sessions and now bouncing off with higher than average volume
Technicals:
Sector: Consumer Cyclical - Auto & Truck Dealerships
Relative Strength vs. Sector: 2.12
Relative Strength vs. SP500: 2.92
U/D Ratio: 1.02
Base Depth: 20.61%
Distance from breakout buy point: -8.45%
Volume 38.61% above its 15 day avg.
Trade Idea:
* You can enter now as the price is just bouncing off of its 50 day line with higher than average volume
* If you're looking for a better entry you can look for one around the ~110.5 area
* This stock usually has local tops when the price closes around 12.3% above its 50 EMA
* Consider selling into strength if the price closes 12.1% to 12.5% (or higher) above its 50 EMA
* The last closing price is 5.63% away from its 50 EMA

Is $MUSA ready for another run?Notes:
I last mentioned $MUSA on July 7th, 2022 and since then it has run up more than 12% hitting our target.
Since hitting our target $MUSA has been in an orderly pull back to the broken resistance of $262.58 and testing that as support.
* Ideally, this should now hold above $262.58 in order to stay constructive. A daily close, or two, would signal weakness.
Now that earnings are out better than expected we may be able to expect another run up.
Everything else remains the same as my previous post.
Technicals:
Sector: Consumer Cyclical - Specialty Retail
Relative Strength vs. Sector: 2.36
Relative Strength vs. SP500: 3.75
U/D Ratio: 1.27
Base Depth: 19.38%
Distance from breakout buy point: 1.66%
Volume 19.89% above its 15 day avg.
Trade Idea:
* You can enter now since the earnings are out of the way and it's bouncing off of support with higher than average volume.
* It may also consolidate for the remainder of this week so if you want a better entry you can look for one around the $262.58 level
* This stock usually has local tops when the price closes around 14.62% above its 50 EMA
* Consider selling into strength if the price closes 14.42% to 14.82% (or higher) above its 50 EMA
* The last closing price is 7.35% away from its 50 EMA

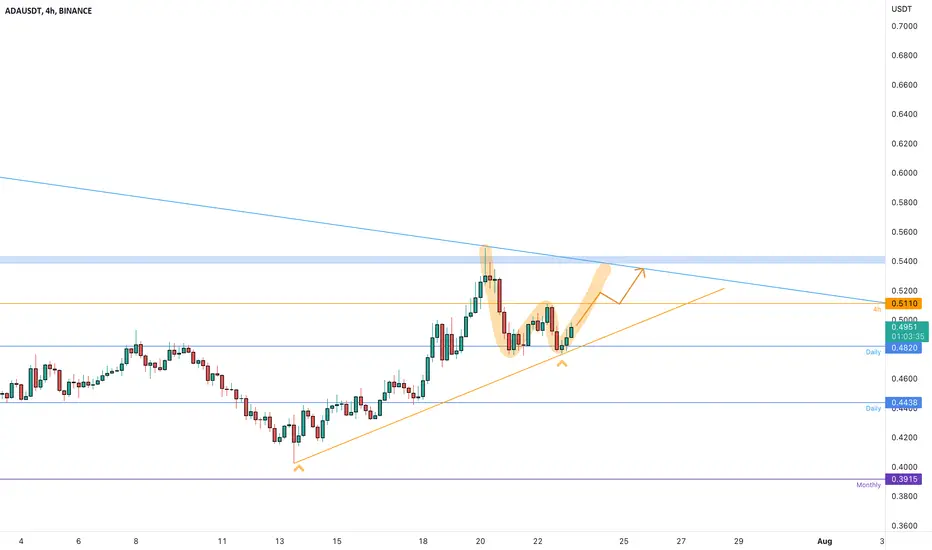
ADAUSDT is testing the resistanceThe price is testing the dynamic 4h support above the daily resistance at 0.48%.
The market is going to try to complete the W pattern below the daily resistance at 0.54$ where the price needs to grab more liquidity to create a new breakout from the historical resistance
how to approach it?
IF the price is going to have a breakout from the neckline and retest it as new support, According to Plancton's strategy , we can set a nice order
–––––
Keep in mind.
🟣 Purple structure -> Monthly structure.
🔴 Red structure -> Weekly structure.
🔵 Blue structure -> Daily structure.
🟡 Yellow structure -> 4h structure.
–––––
Follow the Shrimp 🦐
COFORGE , starting UPTREND after retesting hey guys ,
COFORGE stock is showing signs of UPTREND,
this stock was moving in a fixed downtrend ,
2-3 weeks before this stock has crossed it's RESISTANCE and broke the DOWNTREND AREA .
After breaking that area , the stock has retested
But instead of going into a straight uptrend ,
this stock started to follow a pattern called TRIANGLE PATTERN
and now this stock has CROSSED the RESISTANCE of that TRIANGLE PATTERN ,
and a big green candle is presented by this stock .
therefore guys , i suggest you that
try to grap this stock and earn high returns .
( but it is not sure that you will achieve your target
if stop loss is hit , pls cut ur position)
i have marked the RR RATIO , TARGET AND STOP LOSS
BUT FIRST CONSIDER THE GLOBAL MARKET SITUATIONS
1. INFLATION
2. WAR
3. RISING BANK RATES
AFTER CONSIDERING THESE SITUATIONS, YOU CAN BUY THIS STOCK
😀😀

$VRTX showing multiple signs of continuation!Notes:
* Very strong up trend on all time frames
* Great earnings track record since 2017
* Breaking out of a ~4 month base with higher than average volume
* Printed a pocket pivot
* And offering an early entry relative to its 50 day line
* Breaking above a historical resistance of $290.48 with volume once again (Third time's the lucky charm? ;))
* Formed a relatively flat handle to the double bottom
* Offering a low risk entry
Technicals:
Sector: Healthcare - Biotechnology
Relative Strength vs. Sector: 1.32
Relative Strength vs. SP500: 1.16
U/D Ratio: 1.97
Base Depth: 24.6%
Distance from breakout buy point: 0.03%
Volume 8.7% above its 15 day avg.
Trade Idea:
* You can enter now as it's just breaking out of its double bottom base with higher than average volume and it printed a pocket pivot
* If you're looking for a better entry you can look for one around the 290.5 area as that should hold as support
* One thing to keep in mind is that there are two more historical areas of resistance that will come in the way before we hit the target
* Look for confirming price action around those levels before adding to the position
* Or, if we see lots of rejection around those levels, consider exiting the position earlier
* This stock usually has local tops when the price closes around 11.93% above its 50 EMA
* Consider selling into strength if the price closes 11.73% to 12.13% (or higher) above its 50 EMA
* The last closing price is 6.9% away from its 50 EMA

$CSL continuing to move higher!Notes:
* I last spoke about this a couple of days ago as it was bouncing off of its 50 day line
* Since then it has gaped up and is now breaking above the resistance level of $254.44
* It's still offering an early entry as it's still close to its 50 day line and trading above average volume
* Everything else remains the same from my previous post.
Technicals:
Sector: Industrials - Building Products & Equipment
Relative Strength vs. Sector: 1.39
Relative Strength vs. SP500: 1.43
U/D Ratio: 2.03
Base Depth: 17.07%
Distance from breakout buy point: -5.86%
Volume 3.18% above its 15 day avg.
Trade Idea:
* This is still giving a pretty low risk entry opportunity so you may look to enter now as it's breaking above the 254.44 level

$CNC ready to break out of its ~5 month basse?Notes:
* Very strong up trend on all time frames
* Great earnings track record
* Building a base on base pattern
* Held up very well against the general market and its sector
* Recently bounced from its 50 day line
* Printed a pocket pivot with higher than average volume
* Saw a lot of demand around the 50 day line a few days ago with a strong bullish hammer
Technicals:
Sector: Healthcare - Healthcare Plans
Relative Strength vs. Sector: 1.15
Relative Strength vs. SP500: 1.1
U/D Ratio: 1.22
Base Depth: 18.61%
Distance from breakout buy point: -1.98%
Volume 39.0% above its 15 day avg.
Trade Idea:
* You can enter now as the price is still close to the 50 day line and just printed a pocket pivot
* If you want a better entry you can look for one around 86.8 as that should hold as support moving forward
* This stock usually has local tops when the price closes around 11.18% above its 50 EMA
* Consider selling into strength if the price closes 10.98% to 11.38% (or higher) above its 50 EMA
* The last closing price is 6.04% away from its 50 EMA

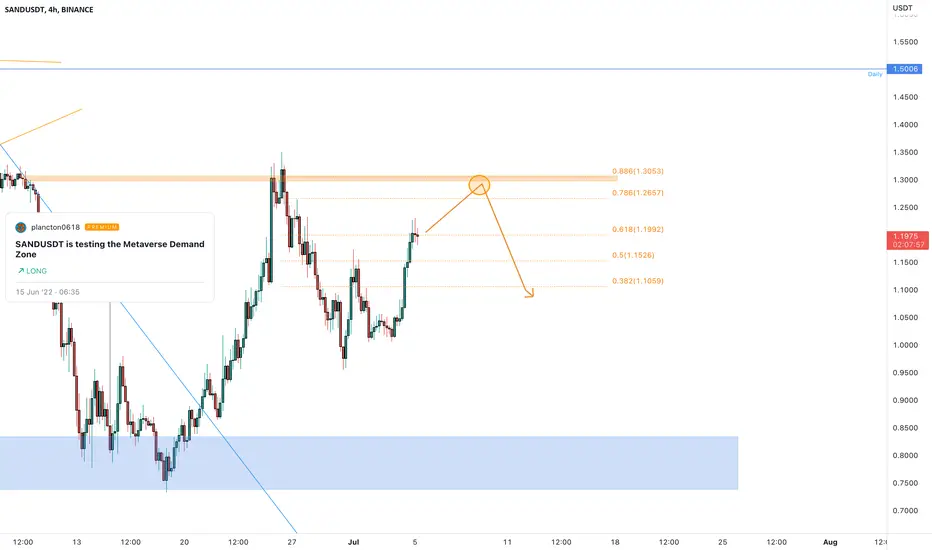
SANDUSDT is going to retest the resistanceThe price had a nice reaction from the daily support as I told you in my previous analysis on 0.8$.
The price could retest again the 0.786 - 0.886 Fibonacci level on the 4h timeframe and got a rejection.
a RETEST is NOT ENOUGH for a short position, the price needs to satisfy our rules
How to approach?
IF the price is going to have a reject from the key level, According to Plancton's strategy , we can set a nice order
–––––
Keep in mind.
🟣 Purple structure -> Monthly structure.
🔴 Red structure -> Weekly structure.
🔵 Blue structure -> Daily structure.
🟡 Yellow structure -> 4h structure.
–––––
Follow the Shrimp 🦐
$AFG is leading the financial sector. Is it ready to go higher?Notes:
* Very strong up trend on all time frames
* Great earnings
* Pays out dividends
* Breaking out of a base on base pattern of around 8 months
* Held up incredibly well as the general market and the financial sector were taking a beating
Technicals:
Sector: Financial - Insurance - Property & Casualty
Relative Strength vs. Sector: 1.15
Relative Strength vs. SP500: 1.16
U/D Ratio: 0.95
Base Depth: 22.15%
Distance from breakout buy point: 0.44%
Volume 9.09% above its 15 day avg.
Trade Idea:
* You can enter now as the price is just breaking out of its base and is still very close to its 50 day line.
* If you're looking for a better entry you can look for one around $136.75
* This stock usually has local tops when the price closes around 15.82% above its 50 EMA
* Consider selling into strength if the price closes 15.62% to 16.02% (or higher) above the 50 EMA...
* The last closing price is 5.02% away from its 50 EMA

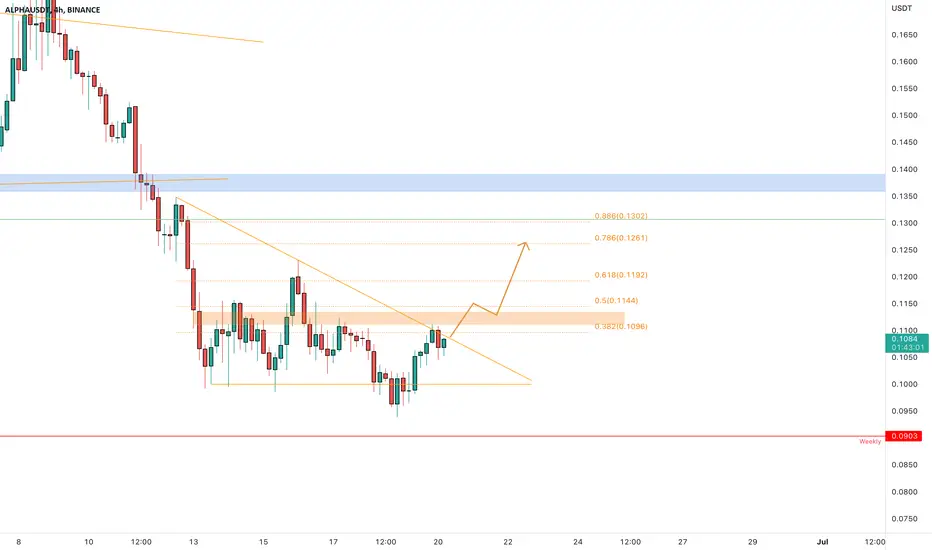
ALPHAUSDT is testing the resistanceThe price got the liquidity below the triangle, and now the market is testing the dynamic and static resistance below the 0.5 Fibonacci level, it's a key level.
How to approach it?
The price needs to create a new Higher High from here, and retest the current resistance as new support, According to Plancton's strategy , we can set a nice order
–––––
Keep in mind.
🟣 Purple structure -> Monthly structure.
🔴 Red structure -> Weekly structure.
🔵 Blue structure -> Daily structure.
🟡 Yellow structure -> 4h structure.
–––––
Follow the Shrimp 🦐
AUD/CAD BULLISH MOMENTUM 1H/4HIn my analysis on AUD/CAD, i see the rejection on 4H and 1H on the support, and now looking for the buy momentum.

AUD/USD More fallprice broke a support turned a resistance, going now to retest it and continue falling to support , when you show reversal take a sell position

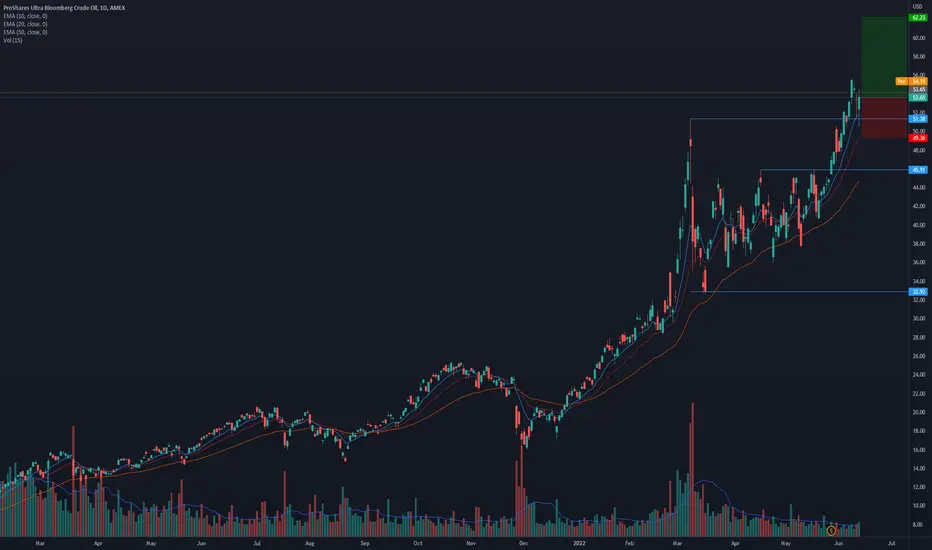
$UCO ready to go higher after retesting broken resistance?Notes:
* Strong up trend due to macro situations
* Printed a Pocket Pivot as it bounced off of broken resistance
* Looks good on multiple time frames
Technicals:
Sector: Exchange Traded Fund
Relative Strength vs. Sector: 3.02
Relative Strength vs. SP500: 4.05
U/D Ratio: 1.62
Base Depth: 56.08%
Distance from breakout buy point: 4.42%
Volume 37.69% above its 15 day avg.
Trade Idea:
* You can enter now as the price just bounced off of the broken resistance with higher than average volume
* If you're looking for a better entry you look to buy around the $52.20 area
* Manage risk accordingly
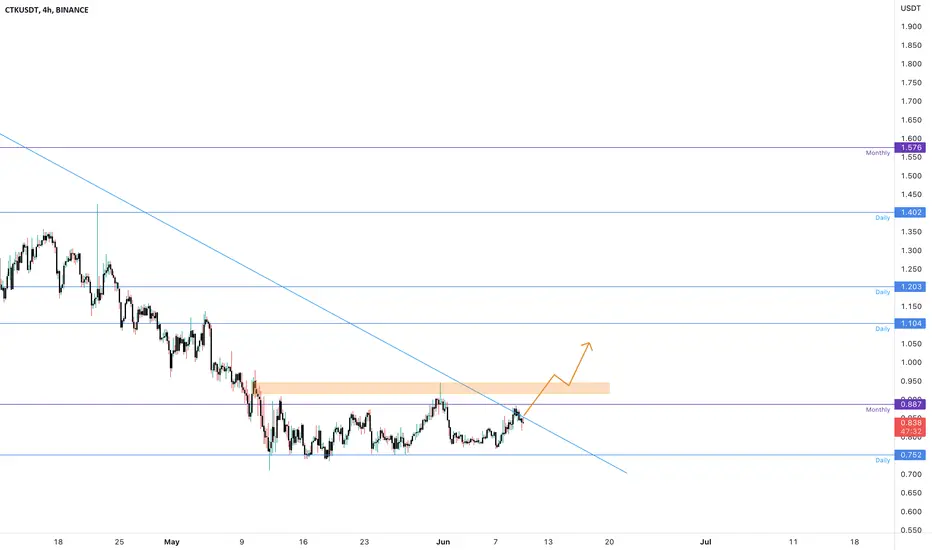
CTKUSDT is testing the monthly resistanceThe price is in consolidation phase above the daily support and below the monthly resistance (0.89)
The price got rejections from 0.95$ from the supply zone.
How to approach it?
IF the price is going to have a breakout from the monthly resistance and 4h resistance and retest it as new support, According to Plancton's strategy , we can set a nice order
–––––
Keep in mind.
🟣 Purple structure -> Monthly structure.
🔴 Red structure -> Weekly structure.
🔵 Blue structure -> Daily structure.
🟡 Yellow structure -> 4h structure.
–––––
Follow the Shrimp 🦐
$RXST looking to head higher?Notes:
* Coming up on the right side of its base
* Volume increasing with price
* Two levels of resistance at which we can take partial profits.
Technicals:
Ticker: $RXST
Sector: Healthcare - Medical Devices
Relative Strength vs. Sector: 25.97
Relative Strength vs. SP500: 8.57
U/D Ratio: 1.7
Base Depth: 82.72%
Distance from breakout buy point: 1.65%
Volume -8.06% below its 15 day avg.

$WCC ready to go higher?Notes:
* Great earnings in the recent quarters
* Strong up trend in the long run
* Price has been increasing along with volume
* Breaking out of a ~7 month base with higher than average volume
* Also breaking out with a pocket pivot
Technicals:
Ticker: $WCC
Sector: Industrials - Industrial Distribution
Relative Strength vs. Sector: 86.62
Relative Strength vs. SP500: 54.48
U/D Ratio: 1.05
Base Depth: 31.68%
Distance from breakout buy point: 2.1%
Volume 64.84% above its 15 day avg.
Trade Idea:
* You can enter now as the price just broke out of the base and is still close
* If you're looking for a better entry you can look for one around the $139.2 area as that should serve as short term support
* Manage risk accordingly

$ASH ready to move higher?Notes:
* Great earnings track record
* Very strong up trend
* Pays out dividends
* Breaking out of a ~7 month base with higher than average volume along with printing a pocket pivot
Technicals:
* Sector: Basic Materials - Chemicals
* Relative Strength vs. Sector: 4.49
* Relative Strength vs. SP500: 6.32
* U/D Ratio: 1.38
* Base Depth: 29.41%
* Distance from breakout buy point: 0.42%
* Volume 205.16% above its 15 day avg.
Trade Idea:
* You can enter now as the price is just breaking out with high volume
* If you're looking for a better entry you can look for one around the $108.63 area
* Manage risk accordingly

ETHUSDT is testing the 4h resistancesthe price tested the monthly support where the market got new liquidity as I told you in my previous idea.
Now the price is testing the 4h resistances, as you can see on the left, the price has several structures on that area.
How to approach it?
The price needs to create a new breakout from it, and retest the 2k resistance as new support, According to Plancton's strategy , we can set a nice order
–––––
Keep in mind.
🟣 Purple structure -> Monthly structure.
🔴 Red structure -> Weekly structure.
🔵 Blue structure -> Daily structure.
🟡 Yellow structure -> 4h structure.
–––––
Follow the Shrimp 🦐

ETHUSDT is testing the resistance. ready for the breakout?The price got liquidity from the monthly support as I told you in my previous video.
the monthly is an important key level on 1700$.
Now the price is testing the 1925$ resistance where the price bounced several times it means that this level is so important for the market.
How to approach it?
The price needs to have a new breakout from the level, thus, the price could retest the previous resistance as new support on 0.618 Fibonacci level, in order to get new liquidity for the next bullish impulse. According to Plancton's strategy , we can set a nice order
–––––
Keep in mind.
🟣 Purple structure -> Monthly structure.
🔴 Red structure -> Weekly structure.
🔵 Blue structure -> Daily structure.
🟡 Yellow structure -> 4h structure.
–––––
Follow the Shrimp 🦐

ETCUSDT is testing the 4h resistanceThe price bounced exactly in the 1.127 Fibonacci Extension on 17.25$ and the market started with a triangle on 4h timeframe.
now the price is testing the 4h resistance at 24.5$ where the price got a rejection a few days ago.
How to approach it?
the price needs to have a new breakout from the resistance and retest the resistance as new support. According to Plancton's strategy , we can set a nice order
–––––
Keep in mind.
🟣 Purple structure -> Monthly structure.
🔴 Red structure -> Weekly structure.
🔵 Blue structure -> Daily structure.
🟡 Yellow structure -> 4h structure.
–––––
Follow the Shrimp 🦐

$MUSA breaking a ~5week base. Can it move higher?* Very strong up trend since inception
* Great earnings in the recent quarters
* Breaking out of a ~5week base
* Pays out increasing dividends
* Has lots of accumulation indicated by the U/D Ratio
Technicals:
Sector: Consumer Cyclical - Specialty Retail
RS vs. Sector: 2.7
RS vs. SP500: 6.71
U/D Ratio: 1.66
Distance from breakout buy point: 0.17%
Volume 9.58% above its 15 day avg.
Trade Idea:
* You can enter now as the price is just above the broken resistance
* If you're looking for a better entry you can look to buy around the $245.9 area as that should serve as a short term support

$AVD breaking out of its ~14 month base * Broke its historical resistance of $23.55 which dates back to 2006 with tonnes of volume behind the move
Technicals:
* Sector: Basic Materials - Agricultural Inputs
* Relative Strength vs. Sector: 52.33
* Relative Strength vs. SP500: 8.92
* U/D Ratio: 1.61
* Base Depth: 71.26%
* Distance from breakout buy point: 2.35%
* Volume 196.27% above its 15 day avg.
Trade Idea:
* You can enter now as the price is really close to the broken resistance of $24.25
* If you're looking for a better entry you can look to enter around the $23.85 area or even a retest of $23.55 seems likely.
* A retest of this area ($23.55 to $23.85) would indicate that buyers are willing to push the price higher.
* Next historical resistance comes in around $27.9
