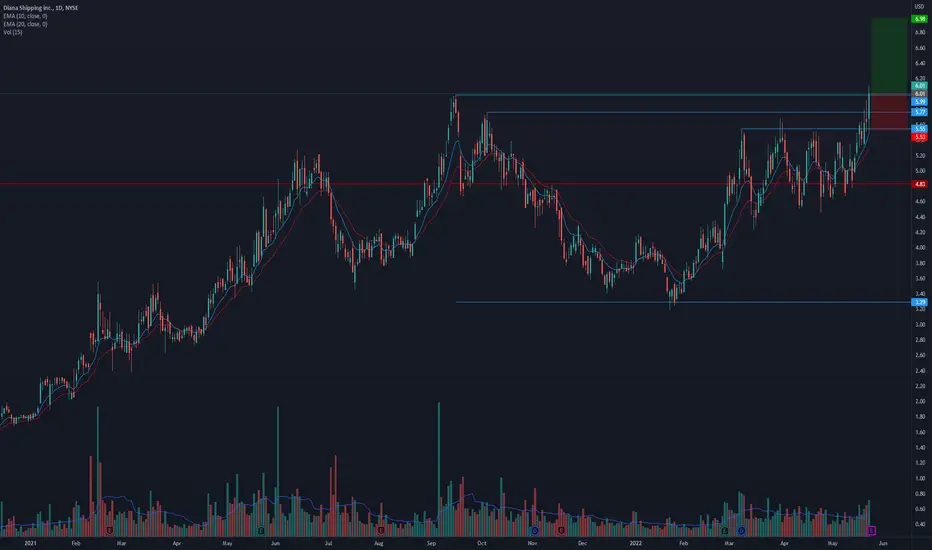
$DSX breaking out of a ~8 month base! Can it go higher?* Steady up trend over the past two years
* Consolidated for about 8 months
* Formed a cup and handle pattern
* Now breaking out of the cup base
Technicals:
* Sector: Industrials - Marine Shipping
* Relative Strength vs. Sector: 20.4
* Relative Strength vs. SP500: 18.49
* U/D Ratio: 1.38
* Base Depth: 82.07%
* Distance from breakout buy point: 0.33%
* Volume 73.26% above its 15 day avg.
Trade Idea:
* You can enter now as the price is just breaking out of its base
* If you're looking for a better entry you can look for one around the $5.77 area
* Given the macro situation of the world it does seem like shipping stocks will move higher in the near future
Resistancebroken
$ARIS ready to move higher?* Nice up trend
* Resisted the current bear market really well
* Looks good on all time frames
Technicals:
* Sector: Utilities - Utilities - Regulated Water
* Relative Strength vs. Sector: 3.09
* Relative Strength vs. SP500: 13.1
* U/D Ratio: 1.06
* Base Depth: 24.41%
* Distance from breakout buy point: 0.1%
* Volume 72.3% above its 15 day avg.
Trade Idea:
* You can enter now as the price is just breaking out of its base
* Or if you're looking for a better entry you can look for one around the $18.19 area as that should serve as a level of support.
* Looking at $XLU it does seem like Utilities are ready to move higher and ARIS seems to be a leader in this space.

FLMUSDT needs to recover the monthlyThe price is creating a falling wedge on the daily timeframe after the breakdown from the monthly support on the 0.12$
On the 4h timeframe the price bounced on the dynamic support
How to approach it?
The price needs to create new bullish impulse with momentum and volumes. IF the price is going to recover the monthly support as new resistance According to Plancton's strategy , we can set a nice order
–––––
Keep in mind.
🟣 Purple structure -> Monthly structure.
🔴 Red structure -> Weekly structure.
🔵 Blue structure -> Daily structure.
🟡 Yellow structure -> 4h structure.
–––––
Follow the Shrimp 🦐

Hindustan Unilever HUL is trading well above its resistance zone of 2200-2207, got rejected from these levels multiple times. Breaking resistance with above average volumes as well as made cup n handle pattern on smaller time frame.
Buy with mentioned stoploss & mammoth target of 2500 in 2-3 trading sessions.

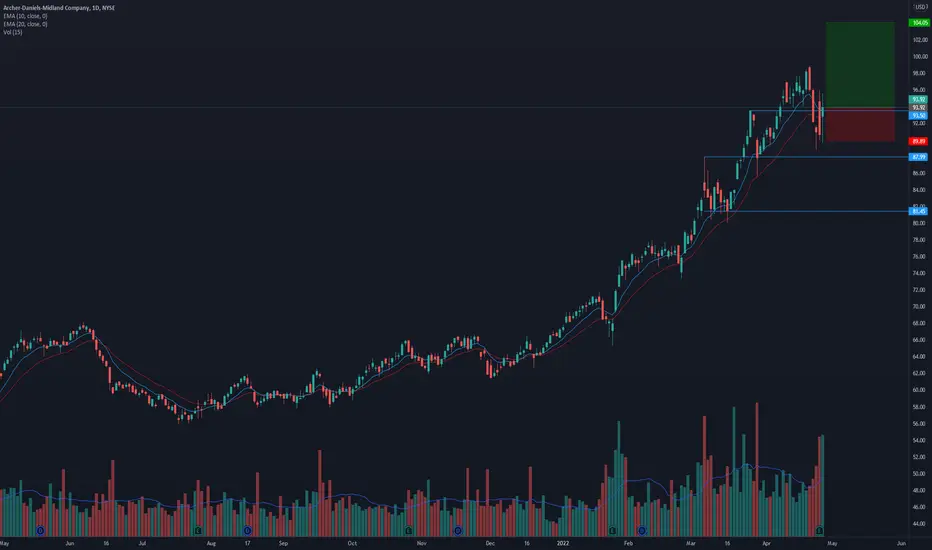
$ADM offering a pull-back recovery entry?Notes:
* Great earnings record in the past 2 years
* Very strong up trend in all time frames
* Offering a potential pull-back recovery entry
* Recovering with well above average volume
Technicals:
* Sector: Consumer Defensive - Farm Products
* Relative Strength vs. Sector: 4.42
* Relative Strength vs. SP500: 8.38
* U/D Ratio: 1.62
* Base Depth: 14.79%
* Distance from breakout buy point: 0.45%
* Volume 73.23% above its 15 day average.
Trade Idea:
* You can enter now as the price is recovering from the pull-back with higher than average volume.
* If you're looking for a better entry you can look for an opportunity around $93.5
* Or even $92.1 given the current market conditions
* Manage risk accordingly
$CHD breaking out of a ~4month cup and handle!Notes:
* Excellent earnings record
* Very strong up trend in the long term
* Breaking out of a ~4 month base
* Formed a larger cup with high handle on the monthly time frame
* Broke out with higher than average volume before earnings
Technicals:
* Sector: Consumer Defensive - Household & Personal Products
* Relative Strength vs. Sector: 1.3
* Relative Strength vs. SP500: 2.47
* U/D Ratio: 1.3
* Base Depth: 9.52%
* Distance from breakout buy point: 0.05%
* Volume 61.09% above its 15 day average.
Trade Idea:
* You can enter now as the price is extremely close to the breakout level
* If you're looking for a better entry you can look for an opportunity around $103.37
* Or due to the current market conditions $103 is also possible
* Manage risk accordingly

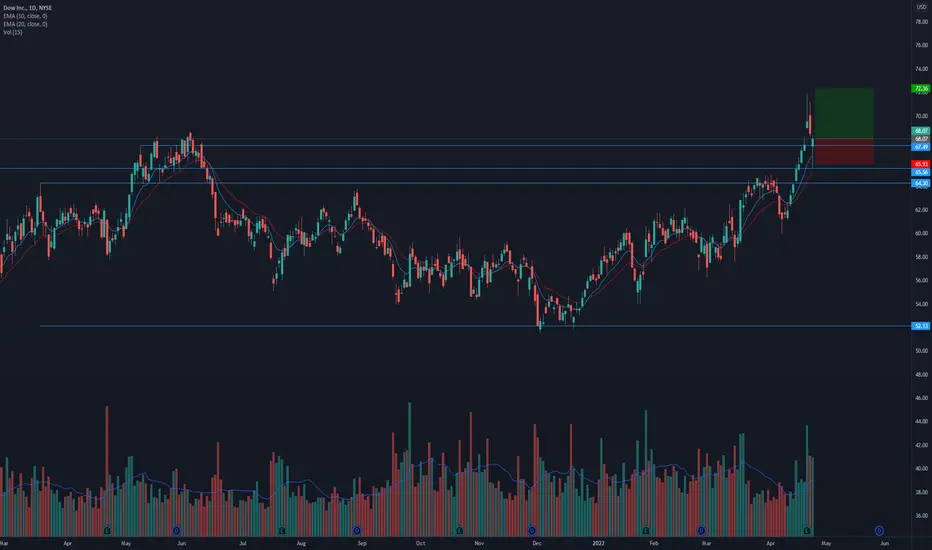
$DOW breaking out of a ~13 month base. Can it go higher?Notes/Thoughts:
* Great earnings record
* Strong up trend
* Breaking out of a ~13 month base with higher than average volume
* Recently used historical highs of $65.56 as support
* Last bullish hammer indicating tonnes of demand below $67.49
* Extremely close to the broken resistance of $67.49 offering a great risk/reward
Technicals:
* Sector: Basic Materials - Chemicals
* Relative Strength vs. Sector: 9.19
* Relative Strength vs. SP500: 8.08
* U/D Ratio: 1.2
* Base Depth: 29.46%
* Distance from breakout buy point: 0.86%
* Volume 46.06% above its 15 day average.
Trade Idea:
* You can enter now as the price is really close to the broken base resistance
* Manage risk accordingly
* If you're looking for a slightly better entry you may wait for the price to pull back to $67.49
* Due to the nature of this choppy market I've reduced my stop and targets accordingly.
$WLK ready to head higher?Notes/Thoughts:
* Strong earnings in the recent quarters
* Strong up trend in the longer time frames
* Broke out of its base and started to move higher but due to recent market conditions it pulled back and is now showing signs of continuation
* Close to the pullback recovery area of $127.11
* Recently tested historical all-time-highs of $114.47 as support
Technicals:
* Sector: Basic Materials - Specialty Chemicals
* Relative Strength vs. Sector: 13.47
* Relative Strength vs. SP500: 11.83
* U/D Ratio: 1.45
* Base Depth: 12.05%
* Distance from breakout buy point: 0.75%
* Volume 19.05% above its 15 day average.
Trade Idea:
* You can enter now as the price is still close to the pull back recovery buy area
* Manage risk accordingly
* Due to the current choppy market conditions I've tightened my stop to 4% and reduced my target to 6%.

VLXUSDT is testing the historical support! Ready for the bounce?the price is testing historical support on 0.19$ as you can see on the upper chart, where the previous bullish impulse started.
On the 4h timeframe, the price is creating a descending channel
How to approach?
The price needs to hold the support and have a new breakout from the descending channel and static resistance and retest it as new support.
According to Plancton's strategy , we can set a nice order
–––––
Keep in mind.
🟣 Purple structure -> Monthly structure.
🔴 Red structure -> Weekly structure.
🔵 Blue structure -> Daily structure.
🟡 Yellow structure -> 4h structure.
–––––
Follow the Shrimp 🦐

USDCAD weekly outlookHello guys,
Based on the chart, a breakout happened on a resistance area last week and now we are waiting for a pullback on our support area (change of polarity feature) and if all the things go well, we can consider a good buy opportunity for following days.
Note: This post will be update base on market reaction.
✅✅ If you found our analysis useful, please like and follow us to receive more signals in future. ✅✅

XMRUSDT is testing the resistance The price is in the accumulation phase below the daily and weekly resistance on 226$
As you can see on the daily timeframe the price created a double bottom in 140$ area, created a W pattern retested it for a new bullish impulse until the current resistance.
on the 4h timeframe, the price is creating a channel between the 209 and 226$
How to approach?
The price needs to have a CLEAR breakout from the weekly resistance, According to Plancton's strategy , we can set a nice order
–––––
Keep in mind.
🟣 Purple structure -> Monthly structure.
🔴 Red structure -> Weekly structure.
🔵 Blue structure -> Daily structure.
🟡 Yellow structure -> 4h structure.
–––––
Follow the Shrimp 🦐

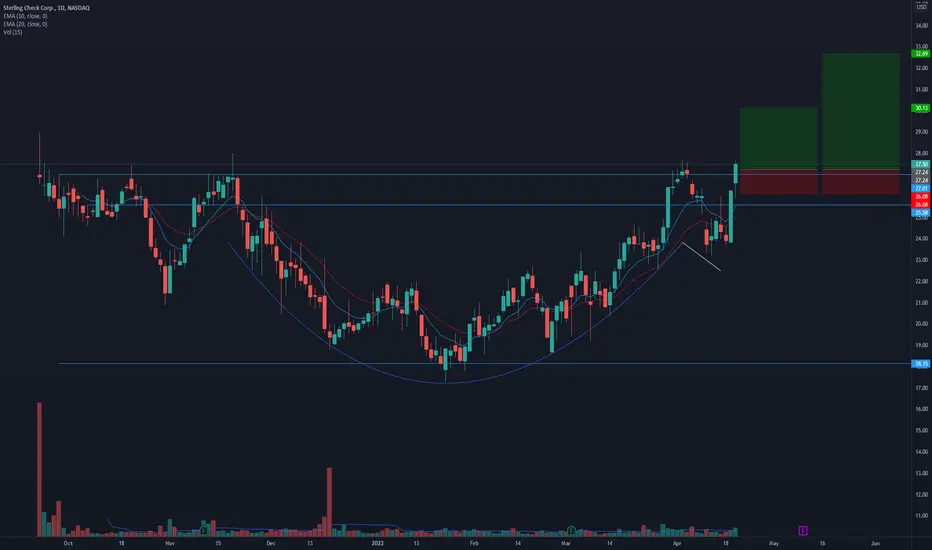
$STER breaking out of its IPO base with cup and handle!* Great earnings so far
* Breaking out of its IPO base with a cup and handle pattern
* Sector: Technology - Software - Infrastructure
* Relative Strength vs. Sector: 10.83
* Relative Strength vs. SP500: 406.08
* U/D Ratio: 1.68
* Base Depth: 48.82%
* Distance from breakout buy point: 1.81%
* Volume 39.73% above its 15 day average.
Trade Idea:
* Playing the break of the handle
* You can enter now as the price is still close to the broken base
* Or if you're looking for a better entry you can look for an opportunity around $27.24.
* Manage risk according to your entry and tolerance
$VIST ready to push higher?Notes/Thoughts:
* Strong up trend in the recent years
* Okay earnings with growth expectation
* Closed just above resistance of $9.07
* During the consolidation from March 23, 2022 the volume was decreasing; now it's increasing and back above the average
* A high Relative Strength along with the high UD Ratio shows this may be ready to move higher.
Technicals:
* Sector: Energy - Oil & Gas E&P
* Relative Strength vs. Sector: 1.79
* Relative Strength vs. SP500: 11.04
* U/D Ratio: 1.68
* Base Depth: 21.26%
* Distance from breakout buy point: 0.11%
* Volume 6.71% above its 15 day average.
Trade Idea:
* You can enter now as the price is just above the broken resistance
* The entry now is providing a good risk/reward ratio
* Manage risk according to your tolerance

$EW breaking out of a ~8month base!Notes:
* Good earnings record
* Very strong up trend on the monthly
* Breaking out of a ~8 month base for the second time
* Has been ranging tightly for the past few weeks between $123.27 and $119.94
Technicals:
* Sector: Healthcare - Medical Devices
* Relative Strength vs. Sector: 1.2
* Relative Strength vs. SP500: 3.88
* U/D Ratio: 1.13
* Base Depth: 20.9%
* Distance from breakout buy point: 1.01%
* Volume 18.81% above its 15 day avg.
Trade Idea:
* You can enter now as the price is still very close to the breakout point
* If you're looking for a slightly better entry you can wait for an opportunity around $123.27 or 119.94
* Manage risk accordingly

$GGB breaking out of a ~11month base!Notes:
* Great earnings in the recent quarters
* Strong up trend in the recent years
* Breaking out of a ~11 month cup shaped base with higher than average volume
* During the recent pull back the volume was decreasing indicating bullishness.
Technicals:
* Sector: Basic Materials - Steel
* Relative Strength vs. Sector: 7.19
* Relative Strength vs. SP500: 13.71
* U/D Ratio: 0.8
* Base Depth: 56.93%
* Distance from breakout buy point: 0.31%
* Volume 14.02% above its 15 day avg.
Trade Idea:
* You can enter now as the price is just breaking out of the base
* Manage risk accordingly

$PLD breaking out of a cup with handle!Notes:
* Excellent earnings
* Very strong up trend in the longer time frames
* Breaking out of a ~5month cup with handle pattern with higher than average volume
Technicals:
* Sector: Real Estate - REIT - Industrial
* Relative Strength vs. Sector: 2.29
* Relative Strength vs. SP500: 7.54
* U/D Ratio: 0.96
* Base Depth: 20.72%
* Distance from breakout buy point: 0.3%
* Volume 34.89% above its 15 day avg.
Trade Idea:
* You can enter now as the price is just breaking out with higher than average volume and good earnings report.
* If you're looking for a slightly better entry you can wait for an opportunity around the $168 area

$SBLK ready to push higher after printing a Pocket Pivot?Notes/Thoughts:
* Broke out of $29.87 once again this time with tonnes of volume and a printed a pocket pivot!
* With increased hedge fund activity it makes sense to get in now
* Has the relative strength and the UD Volume indicating that it's ready to move higher
Technicals:
* Sector: Industrials - Marine Shipping
* Relative Strength vs. Sector: 11.25
* Relative Strength vs. SP500: 10.98
* U/D Ratio: 1.24
* Base Depth: 21.77%
* Distance from breakout buy point: 1.98%
* Volume 106.73% above its 15 day avg.
Trade Idea
* The idea here is to play the pocket pivot.
* The pocket pivot seems to be valid as it's emerging from the 10/20 EMAs
* This seems like a good entry as it broke out from $29.87 with tonnes of volume and we can expect it to continue higher
* Managing risk tightly as I don't want to lose more than 4% on this trade
* If you're looking for a better entry you can look for an opportunity around the $29.87 area and manage risk accordingly

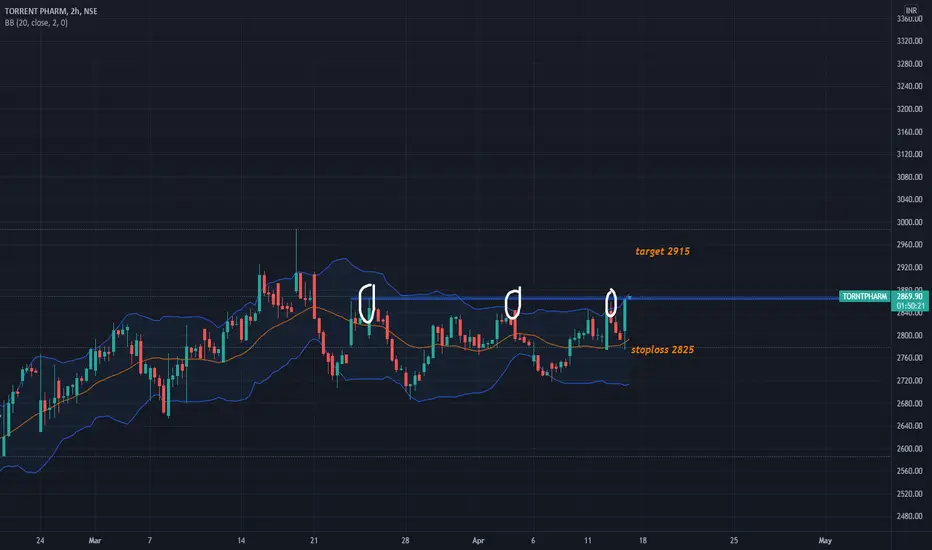
torrent pharmatorrent pharma broke out of multiple resistance zone of 2860-2862 with decent volumes.
could be bought with mentioned stoploss & targets.
AUDIO resistance breakoutNFA
I decided Ima start sharing my ideas with the community so here is one
BINANCE:AUDIOUSDT retested the 1.0 supply zone and went for a lil uptrend
it's now trying to break the 1.3 ish resistance , so I'm interested in a LONG if it properly fixes above
+ it formed a wedge on 1h tf that looks ready to be broken , which is about to give some more confirmation
let me know what you think in the comments please

$NVO giving another entry opportunity before moving higher?* Good earnings
* Very strong up trend in the long term
* Broke out of a ~4month base and now retested it as support
* Sector: Healthcare - Drug Manufacturers - General
* Relative Strength vs. Sector: 8.35
* Relative Strength vs. SP500: 2.56
* U/D Ratio: 2.21
* Base Depth: 26.05%
* Distance from breakout buy point: 1.01%
* Volume 145.18% above its 15 day average.
Trade Idea:
* Given the amount of volume that came in around $116.55, it seems like there's quite a bit of demand for this stock around this price.
* You can look to enter now as the price is very close to the broken base
* The U/D ratio indicates that the stock's under accumulation
* If you're looking for a better entry you can look to enter around $115.16

$HSIC looking to make the next leg higher!Notes:
* Solid earnings in the recent quarters
* Strong up trend in the long term
* Broke out of a base on base pattern
* Initially created a base of ~9 months, broke out and created a smaller base of ~4 week and is now breaking out again
* The ~9 month base was just above historical highs of $73.19 setting it as support
* Making new all-time-highs
* For the past 3 weeks it has been testing $87.55 as a new level of support with the volume drying up indicating that buyers and sellers are agreeing on this price
Technicals:
* Sector: Healthcare - Medical Distribution
* Relative Strength vs. Sector: 2.11
* Relative Strength vs. SP500: 5.05
* U/D Ratio: 1.79
* Base Depth: ~19.68%
* Distance from breakout buy point: 2.25%
* Volume 1.04% above its 15 day avg.
Trade Idea:
* You can look to enter now as the price is still pretty close to the broken level of $87.55
* Manage risk under $87.55
* If you're looking for a better entry you can look to buy around $88.72.

DOTUSDT is testing the monthly resistanceThe price is testing the monthly resistance, as you can see on the upper chart, the price got rejections for that area in the past. 23.5$ is a key level for DOT.
on 4h Timeframe, the price is creating an ascending channel.
How to approach?
The price could have a pullback on the 4h support on 22.30$ before a new breakout from the 23.4$ (monthly resistance.). So if the price is going to have a breakout, According to Plancton's strategy , we can set a nice order
–––––
Keep in mind.
🟣 Purple structure -> Monthly structure.
🔴 Red structure -> Weekly structure.
🔵 Blue structure -> Daily structure.
🟡 Yellow structure -> 4h structure.
–––––
Follow the Shrimp 🦐

CAKEUSDT is testing the resistanceThe price had a breakout from the daily dynamic resistance and now is trying to have a breakout from the static resistance.
On the 4h timeframe the price is below a supply zone on 7$.
How to approach?
The price needs to create a new bullish impulse and breakout from 7$ and retest that area as new support. According to Plancton's strategy , we can set a nice order
–––––
Keep in mind.
🟣 Purple structure -> Monthly structure.
🔴 Red structure -> Weekly structure.
🔵 Blue structure -> Daily structure.
🟡 Yellow structure -> 4h structure.
–––––
Follow the Shrimp 🦐
