$SBLK ready to move higher?* Good earnings in the recent quarters
* Strong up trend in the recent years
* Sector: Industrials - Marine Shipping
* Relative Strength vs. Sector: 66.27
* Relative Strength vs. SP500: 15.88
* U/D Ratio: 1.21
* Distance from breakout buy point: 0.44%
* Volume 48.37% above its 15 day avg.
* Broke out of an ascending triangle and move ~32% higher from there before consolidating
* Yesterdays candle shows tonnes of demand along the 10/20EMAs
* Has been using it's 10EMA as a dynamic level of support
* Broke resistance of $29.87 with higher than average volume
Trade Idea:
* You can enter now as the price just broke out once again with higher than average volume
* Setting a 10% target seems achievable as it's just above a historical level ($32.32)
* Manage risk accordingly as shipping stocks have been hard to trade recently.
Resistancebroken

$SD recovering from pullback and forming a cup and handle!* Great earnings in the recent quarters
* Strong up trend in recent history
* Breaking out of a 6 month base
* Sector: Energy - Oil & Gas E&P
* Relative Strength vs. Sector: 1.07
* Relative Strength vs. SP500: 11.5
* U/D Ratio: 1.33
* Base Depth: 51.12%
* Distance from breakout buy point: 1.49%
* Volume 28.83% above its 15 day average
Trade Idea:
* You can enter now as the price is still close to the broken resistance.
* The target of 2.5 to 1 is close enough to reach
* If you're looking for a better entry you can look for one around the $14.22 area and manage risk accordingly.

$GOGL ready for the next leg higher?* Great earnings in the recent quarters
* Strong up trend in the recent years
* Sector: Industrials - Marine Shipping
* Relative Strength vs. Sector: 37.17
* Relative Strength vs. SP500: 9.02
* Very strong stock in the sector as well as against the SP500
* U/D Ratio: 1.48
* Base Depth: 10.26%
* Distance from breakout buy point: 0.33%
* Volume 15.45% above its 15 day average
* Created a base for about 8 months before breaking out from $9.86
* Moved up ~26% before creating another base for the past ~5weeks and is now breaking out again
Trade Idea:
* Now's a great time to enter as the price is just breaking out.
* The high U/D Ratio of 1.48 shows that the stock is being accumulated

ETHUSDT is testing the resistanceThe price is testing the 2800$ resistance on the 0.618 Fibonacci level after a nice breakout from the 2770$ daily resistance.
the market is testing the previous resistance as new support.
How to approach?
the price needs to grab liquidity for a new breakout from the 4h resistance on 2800$.
If the price is going to have a breakout, we can apply our rules for a new long position.
The New valid resistance is the supply zone on 3k.
––––
Keep in mind.
🟣 Purple structure -> Monthly structure.
🔴 Red structure -> Weekly structure.
🔵 Blue structure -> Daily structure.
🟡 Yellow structure -> 4h structure.

$DSKE to move higher as it recovers from pullback?* Okay earnings
* Strong up trend since 2019
* Sector: Industrials - Trucking
* Relative Strength vs. Sector: 13.48
* Relative Strength vs. SP500: 12.37
* U/D Ratio: 1.21
* Base Depth: 39.33%
* Distance from breakout buy point: 0.34%
* Volume 24.81% above its 15 day average
* Created a base on base pattern
* Was trading in a tight range earlier before the breakout
* Then pulled back into the range and is now breaking out
* The red horizontal lines indicate previous all-time-highs from 2017/18
Trade Idea:
* You can enter now as the price is just breaking out of the range for the second time and it also seems like a pullback recovery.
* If you're looking for a better entry you can look for a buy opportunity inside the range if it comes back in.
Note:
* First target should be achievable given that it's inside the recent range.

$CHKP breaking its 15 month base! Pullback recovering.* Excellent earnings
* Very strong up trend on the longer time frame
* Breaking out of a 15 month base
* Sector: Technology - Software - Application
* Relative Strength vs. Sector: 3.81
* Relative Strength vs. SP500: 10.48
* U/D Ratio: 1.95
* Base Depth: 25.82%
* Distance from breakout buy point: 1.75%
* Volume 13.76% above its 15 day avg.
Trade Idea:
* You can enter now as the price is very close to its breakout point.
* Or if you want to look for a better buy opportunity you can look to enter around the $137.47 area as that should serve as support moving forward.

Mullen broken resistance of 3.00, pushing upwards.Insane, with an aftermarket that brought the vide down, we see an INCREDIBLE jump. This almost seems unreal. Mullen is off to the races, and there is no slowing down anytime soon. Keep holding everyone, this is a wild ride.

2.00 resistance line broken, Pushing on safety to new resistanceOutstanding today, MULN has hit and broken the 2.00 resistance line and is now pushing into the safety area (2.30-2.70) while advancing towards our next resistance line. What does this mean you may ask> It means dont sell, let it go up, you don't need a cash out. Refer to my Other chart down below.

$IMXI broke out with a tonne of volume! Will it hold?* Great earnings
* Possible start of a stage 2 up trend
* Sector: Technology - Information Technology Services
* Relative Strength vs. Sector: 2.82
* Relative Strength vs. SP500: 4.8
* U/D Ratio: 1.53
* Base Depth: 27.85%
* Distance from breakout buy point: 7.07%
* Volume 153.75% above its 15 day avg.
Thoughts:
* This, at the moment, seems short term extended and may offer a pull back entry.
* Looking at the weekly/monthly charts it does seem like the start of a stage 2 up trend.
* If it does offer a pullback entry, the best case scenario would be a buy opportunity around the $18.96 area.
* Given how it broke out, it may consolidate around the highs for a while and offer an entry somewhere around there.
This is one to keep an eye on for sure.
Trade Idea:
* Not actionable at the moment.

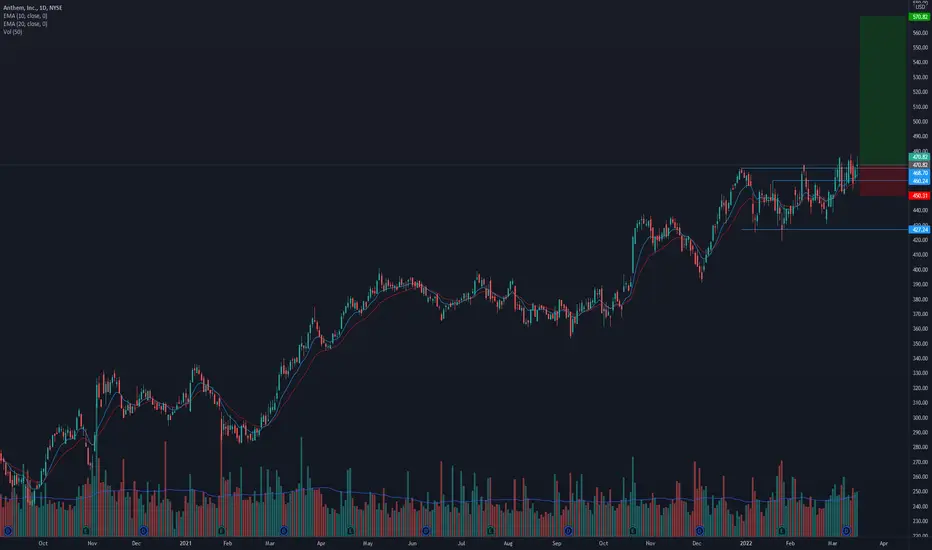
$ANTM attempting to break out for a second time! Will it hold?* Great earnings
* Very strong up trend in the long term
* Sector: Healthcare - Healthcare Plans
* Relative strength vs. Sector: 2.19
* Relative strength vs. SP500: 1.03
* U/D Ratio: 1.17
* Base Depth: 9.7%
* Distance from breakout buy point: 0.45%
* The setup is giving a great risk/reward ratio allowing us to manage risk tightly
* Hasn't been effected by the current world affairs at all
* Weekly price action also looks very healthy
Trade Idea:
* You can enter now as the price is just above the breakout and volume is higher than average.
* Alternatively you can look for an entry around the $468.7 area or if you think this will pull back a bit more; you can look for an entry around the $460.25 area.
Manage risk accordingly.
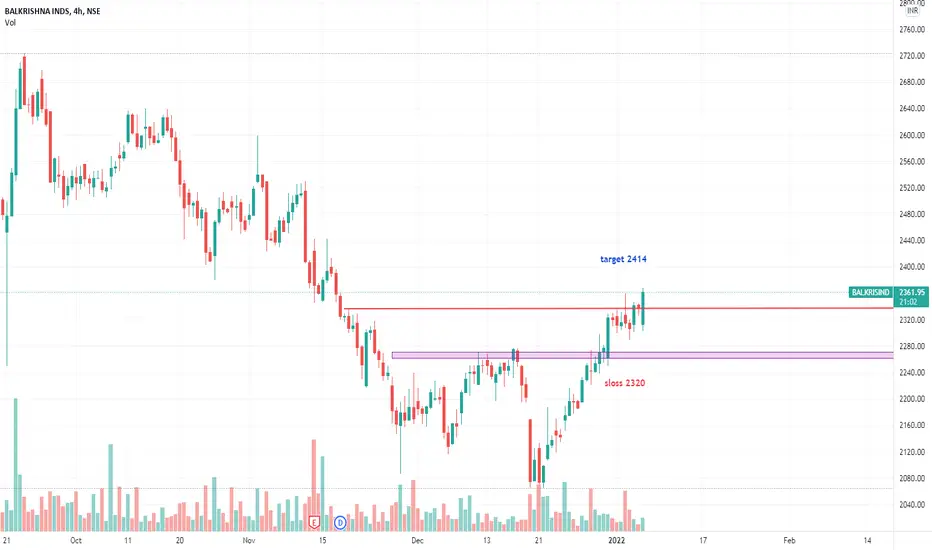
BalkrishnaBalkrishna break out of resistance on 4th January couldnt sustain, made an high of 2361 n reversed. Today, again it broke out of resistance zone & also break above 4th jan's high of 2361.
Could be bought with mentioned stop-loss & targets.
$CRDO ready to move higher after a great ER?* New IPO with a strong up trend even in this market
* Great earnings report
* Sector: Technology - Communication Equipment
* Relative Strength vs. Sector: 2.62
* Relative Strength vs. SP500: 4.18
* U/D Ratio: 1.07
* Base Depth: 28.05%
* Distance from breakout buy point: 0.31%
* Volume 66.03% above its 15 day average.
* Bullish candle with high volume with a great ER
Trade Idea:
* Now's a great time to enter as the price is just above the breakout level.

$FMC breaking out of a 16 month base!* Great earnings
* Very strong up trend
* Relative Strength vs. Sector: 5.07
* Relative Strength vs. SP500: 3.23
* U/D Ratio: 1.6, meaning it's under accumulation
* Base Depth: 37.54%
* Distance from breakout buy point: 1.47%
* Volume 22.29% above its 15 day avg
* Breaking out of a 16 month base
Trade Idea:
* You can enter now as the price is really close to the breakout level of $119.52
* Or if you're looking for a better entry you can look for a buy opportunity near the $119.52 area or wait for a pull back near the $116.57 area.

$INVA to head higher after pulling back to broken resistance?* Good earnings in the recent quarters
* Good up trend in the recent 2 years
* High 3-month RS of 34.4 in the Healthcare sector and a RS of 4.0 against the SP500
* UD Ratio of 1.57 meaning it's under accumulation
* Has been holding the earnings gap really well during this time
* Trading well above the 50 day avg volume
Trade Idea:
* You can enter now as this is its second attempt at breaking out.
* If you're looking for a better entry you can look for buying opportunities near the $18.97 area as that should continue to hold as support.
Caution:
* The red lines at $19.84 and $20.54 are from historic highs. We may see resistance around those price levels.

DaburDabur is facing resistance @ 570 level from past 2 trading sessions, it broke 570 level today with decent kind of volumes.
Could be bought with mentioned stoploss & targets.

SOLUSDT is testing the resistanceThe price is creating a descending channel on the daily timeframe and after a retest of the demand zone, the price bounced to 100$.
On the lower timeframe, we can see a breakout from the 4h and 1d channel and the price is testing an important resistance on 103$ on the 0.618 Fibonacci level.
How to approach?
We are monitoring the price we want to see a clear breakout from the 0.618 Fibonacci retracement and daily resistance. If the price is going to have a breakout, According to Plancton's strategy , we can set a nice order
–––––
Keep in mind.
🟣 Purple structure -> Monthly structure.
🔴 Red structure -> Weekly structure.
🔵 Blue structure -> Daily structure.
🟡 Yellow structure -> 4h structure.
–––––
Follow the Shrimp 🦐

CVCUSDT is testing the monthly resistanceThe price is testing an important resistance of 0.3$ after a bounce on the weekly support. The price is trying to have a breakout from the dynamic daily resistance and static monthly one.
On the 4h timeframe we can see how the price had a breakout from the previous resistance on 0.28$ with a nice retest.
How to approach?
If the price is going to have a breakout from the monthly resistance and retest it as new support, we can add in our watchlist and wait for applying our rules for a new long position
––––
Keep in mind.
🟣 Purple structure -> Monthly structure.
🔴 Red structure -> Weekly structure.
🔵 Blue structure -> Daily structure.
🟡 Yellow structure -> 4h structure.

Hindustan Unilever HUL broke last week's high of 2316.70 & trading well above it.
Could be bought with mentioned stoploss & targets.

BIG news! BTC broke 45k! Bull market cycle getting closer! Another HUGE move by BTC. I didnt think we would cross 45k this week. Maybe next week but it happened TODAY. There is some serious strength going on with the market now and all indicators are showing this is the start of a full reversal. As i always note this isnt 100%, we are marking off check box after check box and we have just a little bit more to confirm before we can ring the BULL MARKET ARRIVAL bell. Exciting times. Good luck everyone!
I also go over SHIB a bit in this video and I go over showing how BITCOIN affects the crypto market as a whole.

$CHD ready to move higher after breaking out of ~17 month base?* Excellent earnings quarter over quarter
* Very strong up trend on the monthly time frame
* High relative strength of 2.75 in the Consumer Defensive sector
* Pays out a quarterly dividend
* Breaking out a ~17 month base
* Both monthly and weekly candles show a large bullish hammer candle
* The weekly chart used the base resistance of $97.53 as support and mad a very strong move higher on earnings today
Trade Idea:
* Now's a great time to enter as the price is just breaking back higher.
* Held up very well during a massive correction.
* If you're looking for a better entry you can look for opportunities near the $100.7 area as that should serve as a temporary support level.

TatacommTatacom broke out of triangle pattern on smaller timeframes.
Could be bought with mentioned stoploss & targets

$MATX breaking out of a base on base pattern!* Great earnings
* Very strong up trend on the monthly time frame
* Very high 3-month relative strength of 2.73 in the Industrials - Marine Shipping sector
* U/D Volume Ratio of 0.85 (above 1 is preferred)
* Upper base depth of 19.06%
* Currently trading with volume 184.01% above its 15 day average
* During the formation of the upper base it also created a cup and handle pattern
* And is now breaking out with tonnes of volume.
Warning:
* Given the current market conditions, it's considered better to sit in cash and wait for the general conditions to stabilize.
Trade Idea:
* Now's a great time to enter since the price is really close to the broken level.
* If you're looking for a better entry, you can look for an entry opportunity near the $91.49 area.
* Consider keeping a tight stop since the general market conditions are unfavorable and also consider booking profits early for the same reason.

$CHRW ready to move higher after breaking its ~17 month base?* Great earnings in the recent quarters
* Strong up trend
* High 3-month relative strength of 3.82 in the Industrial sector
* Has a U/D Volume Ratio of 0.94 (ideal would have been > 1)
* Pays out a generous dividend
* Breaking out of its ~17 month base
* Due to the recent volatility it had a slight pullback after its previous breakout
* Has been holding up really well over the past week when the general market was selling off like crazy. This is showing relative strength and institutional demand.
* Used the broken level as support and pushed higher from there
Trade Idea:
* It is not advised to trade breakouts in the current market conditions.
* If you want to enter with a small position, now would be a great time to enter as the price is just breaking out once again.
* If you're looking for a better entry you can look for a buying opportunity around the $105.7 area as that should continue serving as support moving forward.
