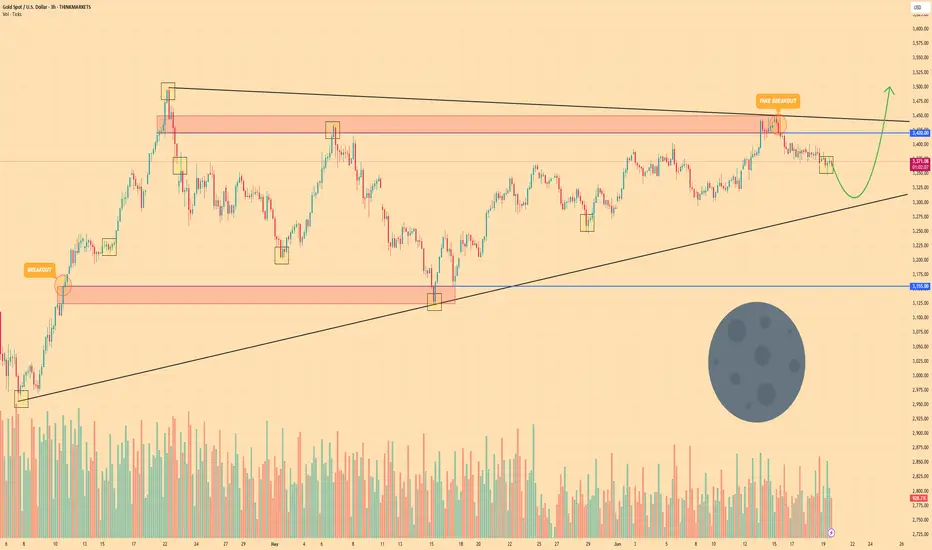
GOLD - Price may bounce up from wedge to $3500 points Hi guys, this is my overview for XAUUSD, feel free to check it and write your feedback in comments👊
A few moments ago, price entered to wedge, where it at once made an upward impulse from the support line.
Price broke $3155 with $3420 level and reached resistance line, but soon turned around and started to decline.
After this, Gold broke the $3420 level one more time and later tried to grow, but when it reached the resistance zone, it dropped.
Next, price bounced from support line of wedge and started to grow and in a short time rose to $3420 level.
Recently, it declined below, making a fake breakout of the resistance level, and now it continues to decline.
In my mind, Gold can decline a little more and then bounce up to $3500, breaking the resistance level.
If this post is useful to you, you can support me with like/boost and advice in comments❤️
Disclaimer: As part of ThinkMarkets’ Influencer Program, I am sponsored to share and publish their charts in my analysis.
Resistancelevel
#GOAT/USDT Short-Term Rally or Wave 5 Decline ?#GOAT/USDT is currently forming a descending channel with a 5-wave Elliott Wave structure. The price shows potential for a short-term upside move toward $0.69, which acts as a crucial resistance level at the upper boundary of the channel. If rejected at this level, the price may continue its downtrend toward $0.32, aligning with the lower channel boundary and Wave (5) target. Traders should watch for a breakout or rejection at $0.69, as it will determine the next significant move. A breakout could signal further bullish momentum, while rejection would confirm the continuation of the bearish trend. BYBIT:GOATUSDT.P

PANACEABIO long consolidation about to BOIt looks like the stock is gearing up for a breakout after a period of consolidation.
There's a significant supply zone around the 500 psychological level.
For a successful breakout, we should ideally see a strong 1Month candle on our chart—it’s crucial to use that timeframe.
Following the breakout, the ideal entry point would be after a consecutive candle that breaks above the breakout candle
As always, remember to do your own research before making any investment decisions!

AGLD/USDT Bullish Breakout: Two Resistance TargetsAGLD/USDT has formed a bullish pennant pattern, and we’ve already seen a breakout. My first target is the pink zone, which acts as the initial resistance. If the price continues upward, my second target is the next pink resistance zone. Additionally, if the price reaches this second resistance, there could be an opportunity to short, depending on how the price reacts to this key level.

USDCHF short bullish expectations
USDCHF short bullish expectations, based on trend pattern. Price looks like its find, create strong base on supp zone. +We have today FOMC where i expect bullish power for USD on short term.
For stronger bullish trend confirmation we can follow break of 0.84700 zone.
There is and chance for creating of ASCENDING PATTERN, violet line is top zone/resistance of ascending triangl
TP: 0.85400 (80)
SL: 0.84100

Simple Strategies for NZDUSDA complicated trading strategy doesn't guarantee profits. Sometimes, a simple trading strategy works best. Here are two straightforward approaches I have for the NZDUSD trade.
Strategy:
1. Retest of Resistance at 0.6096:
- Setup: Watch for a retest of the resistance level at 0.6096.
- Entry: Enter a short position on confirmation of resistance holding.
- Stop-Loss: Place a stop-loss just above the resistance level.
- Target: Aim for key support levels below for potential profit.
2. Retest of the Tip of the Bearish Channel:
- Setup: Look for a retest at the tip of the bearish channel.
- Entry: Enter a short position if the price respects the channel boundary.
- Stop-Loss: Place a stop-loss just above the bearish channel.
- Target: Aim for the lower boundary of the channel or key support levels below.
Key Points:
- Simplicity: Simple strategies can be effective and easier to manage.
- Risk Management: Ensure proper stop-loss placement to manage risk effectively.
- Confirmation: Always wait for confirmation of the levels holding before entering trades.
Sometimes, simplicity is the key to effective trading. What’s your take on NZDUSD?
Do you have any other straightforward strategies that work for you?
Share your thoughts and strategies below!

GBPAUD Trade Setup: Bearish ChannelGBPAUD has piqued my interest from a mid to long-term perspective. I'm looking at two potential shorting opportunities:
Key Levels:
- Short Entry on Resistance Retest: 1.9212
- Bearish Channel Indication: As long as this channel isn't violated, it strengthens the bearish bias.
I'll be looking for shorting opportunities on both the 4-hourly and 1-hourly charts based on these indications.
What's your trade plan for GBPAUD? Comment down below and share your thoughts!
Happy trading!

BITCOIN in a range.The price of Bitcoin has been moving in sideways for some time now. Any time the price moves into the 70,000 range the bears step in and push the price lower.
I think it will be the same this time.
Look for opportunities to sell into the 60,000 level.

Price at Resistance Level The upper trendline seems to be holding price effectively. Price as reacted to that zone 6 times now. The pair is in a downtrend therefore look for an opportunity to sell.
The target should be 1.06150 .

Bitcoin can break support line and continue fall to 61000 pointsHello traders, I want share with you my opinion about Bitcoin. By observing the chart, we can see that the price a not long time ago started to trades inside the downward channel, where it rebounded from the resistance level, which coincided with the seller zone and rose to the channel's resistance line. After this movement, BTC turned around and quickly declined to support line of the channel, breaking the 64500 resistance level, but soon backed up to the seller zone. Later, the price finally broke the 64500 level and some time traded below, after which BTC rose to this level, which coincided with the resistance line of the channel, and rebounded down to the 59200 support level, which coincided with the support area. Also, Bitcoin left the downward channel and soon broke the 59200 level too. After this, the price turned around and made impulse up to the resistance level, breaking the 59200 level one more time and when BTC reached the 64500 level, it rolled down to the support line. Now, I think Bitcoin can reach the resistance level again and then rebound down lower than the support line, breaking it. For this case, I set my target at 61000 points. Please share this idea with your friends and click Boost 🚀

GBPUSD Analysis: Trend Continuation TradingTrade Strategy: Trend Continuation
- Key Level (1-hourly chart): Retest at 1.2419
- Additional Setup (4-hourly chart): Bullish Shark Pattern at 1.2141
Analysis:
- Approach: Identifies potential opportunities for trend continuation trading
- Key Level: Looks for a retest at 1.2419 on the 1-hourly chart as an entry point
- Additional Setup: Considers stretching the target to 1.2141, the completion of a Bullish Shark Pattern on the 4-hourly chart
Trade Plan:
- Entry Point (1-hourly chart): Consider entering a short position on a retest at 1.2419
- Upsize Trade Management: Utilize Upsize Trade Management to extend the target to 1.2141
- Risk Management: Implement effective risk management techniques to safeguard trades
Insights:
GBPUSD exhibits potential for trend continuation trading, with a retest at 1.2419 offering an entry point on the 1-hourly chart. Additionally, consideration of stretching the target to 1.2141 aligns with the completion of a Bullish Shark Pattern on the 4-hourly chart. Employ prudent risk management practices to navigate market volatility.
📉📈 Exercise caution and prioritize risk management when trading GBPUSD based on trend continuation setups!

HelenP. I Euro will rebound from trend line and rise to $1.0700Hi folks today I'm prepared for you Euro analytics. A few moments ago price reached the resistance zone, breaking resistance 2, but soon it turned around and in a short time declined to resistance 1, making a fake breakout. Soon, EUR turned around and made a strong impulse up to the trend line, breaking resistance 2 one more time and even soon broke the trend line too. But later price started to decline and broke resistance 2 again, after which the Euro made a little movement up and then continued to decline. Later price turned around and made an impulse up from the trend line to resistance 2 again, but when it reached this level, the EUR at once turned around and made an impulse down to resistance 1, which coincided with one more resistance zone. Soon, the price broke this level and fell to the trend line, where the Euro some time traded near. But a not long time ago price rebounded and started to move up, for my mind, the Euro will make a correction movement to the trend line again and then rebound up to the 1.0700 resistance level, which is my target also. If you like my analytics you may support me with your like/comment ❤️

EURUSD Update: Shorting Opportunity IdentifiedTrade Setup:
- Entry: Sell at 1.0797 (Retest Level)
- Target: Extended towards potential Bullish Harmonic Patterns setup
- Risk Management: Implementing trade management system for upsized trades
Analysis:
While many analysts are focused on the potential Bullish Butterfly Pattern and ABCD Pattern on the 4-hourly chart, my attention is on a shorting opportunity using a trade management system. I'm looking to short EURUSD upon another retest at 1.0797, aiming to extend my targets towards potential Bullish Harmonic Patterns setup.
Trade Management:
- Upsized Trades: Stretching Final Target to next pattern completion.
- Entry: Selling at the retest level of 1.0797.
- Targets: Extending targets beyond traditional levels towards potential Harmonic Patterns setup.
Risk Management:
- Always prioritize risk management to protect capital.
- Adjust position sizes to align with risk tolerance and trading strategy.
Your Thoughts?
Do you also see a shorting opportunity on EURUSD? Share your insights and trading strategies in the comments below!
👍 Like if you found this update helpful! Remember to conduct your own analysis before making any trading decisions. Trading involves risk.

GBP/CAD: Bullish Consolidation or Bearish Reversal? WeeklLooking at the weekly GBPCAD chart, we see signs of potential bullish continuation, but a pullback towards the trendline is a likely scenario before further upside.
GBP gaining traction: The recent price movement suggests GBP is strengthening against CAD. This is evident by the upward trend: ... on the weekly chart.
Pullback expected: A retracement towards the established weekly trendline support: ... is a reasonable expectation. This is a common occurrence after a price surge, allowing for a pause and potential entry points for long positions.
Support confluence: The trendline coincides with a monthly pivot point: ..., creating a stronger support zone. This confluence of technical indicators increases the significance of this level.
Here's what you should watch for:
Price action at the trendline: A decisive break below the trendline support would weaken the bullish case and indicate a potential reversal. Conversely, a bounce off this level alongside bullish confirmation signals (e.g., increasing volume) could signal continuation of the uptrend.
Resistance level: The key resistance area to overcome is . A clean break above this level would open the door for further bullish momentum.
Overall, the GBP/CAD weekly chart presents a mixed picture. While the uptrend suggests potential for further gains, a pullback towards the trendline support is a likely scenario. This support zone, coinciding with a monthly pivot point, presents a possible buying opportunity if bulls can defend the level.
This analysis is for informational purposes only and should not be considered financial advice. Please always consult with a qualified financial professional before making any investment decisions.

gold bullish after retest of supprt zonebullish trend on the background of favorable fundamental. the price is testing the support. growth may continue
With further collisions with the resistance level, it is possible that the price will not be able to return and we will see that in the next collisions the price will pass through this area and reach the next levels of 2075 2082

RECOGNISING CHART FORMATION 🧠Hello Traders!
In this post, I want to present how important is to recognize chart formation, set up correctly resistance levels, and find a good position to execute the trade.
For better practice, I will recommend analyzing the history of any chart and trying to search for resistance levels, order blocks, and breakout points, and anticipate a good position for trade execution.
This exercise will help us to have better visibility of the chart and will help us to anticipate future movements.
Keep in touch!
Follow me for more trade ideas and perspectives!
www.tradingview.com

GBPNZD | Short idea!GBPNZD went face first into a resistance zone. This zone has seen a lot of price action before and must be treated with careful and brutal precision. If price continuous to go down tomorrow, I will be looking for shot positions on the lower time frames!
Be patient, trade safely and manage your risk!

BTC/USDT 1H ChartHello everyone, let's take a look at the BTC to USDT chart on a one hour time frame. As you can see, the price is moving above the local downtrend line.
When we unfold the Trend Based Fib Extension grid, we can see a strong support zone from $33,442 to $33,152.
Looking the other way, there is a resistance zone from $34,551 to $34,861, followed by strong resistance at $35,260.
Looking at the CHOP indicator, we see that the energy is slowly starting to grow, on the RSI we are moving around the middle of the range, but when we look at the STOCH indicator, we can see that we are approaching the lower limit, which may result in a greater price recovery before rising again.

Critical Resistance Reached, Trend Change or Short Play? INFAHi guys! This is a Technical Analysis on this relatively new company Informatica, Inc. (INFA). But the focus is not the company but rather on finding these specific trends in price action.
This analysis is done on the 1 Week timeframe.
Main takeaway is that its powerful to be able to identify when Price action reaches a Major Resistance or Support level. It can make for taking short or long positions.
Notice how INFA is in this Downward Channel.
We've had some touch points on the Support trendline in black.
With every touch, we've had Uptrends.
With our most recent touch of Support, we've had an Uptrend that brought us to our Resistance trendline in RED.
Note, this recent uptrend has created a Higher high from a previous lower higher. Good sign for trend change attempt.
We have also printed our 1st Golden Cross between the 21 EMA(Purple) and the 50 SMA (Green).
This is a powerful bullish sign, even more so that it has happened on the 1 Week. This can provide necessary momentum to break out.
Our current Price action is in a crucial zone. We are attempting to breakout of this Major Resistance trendline.
If we can break through and CONFIRM, it may indicate a Trend Change.
However, do note that this is our 2nd time directly touching this trendline. Trendline theory states it requires atleast 3 touches for that trendline to break. This being a powerful Resistance area, It is important to also look for signs of Rejection.
One sign currently is the presence of Upper Wicks of candles. This shows sell pressure off this trendline.
A Clear sign of rejection would then make this area a solid spot to take short positions.
Target being the Support line below us which coincides with the previous Lower Higher or the 21 EMA.
Now going back to if we can breakout ABOVE the Major Resistance Red Line and Confirm. Our target would be the Horizontal Resistance line Above us.
In my opinion if we can break through the horizontal resistance line. Reaching all time highs becomes very likely. As we dont have much Market Structure above.
One sign to assess if we breakout is VOLUME to increase or spike. That would show signs of increased liquidity which is what we need when trying to trend change. If we breakout with Low Volume, it may lead to a FAKEOUT.
If we reach ABOVE Major Resistance and CONFIRM, this would make for an area for Long positions especially Longer Term Positions/ Investment. This would also signify a Trend Change.
Look to the 1 Day for further signs of whats to come. I will be sure to update as well.
__________________________________________________________________________________
Thank you for taking the time to read my analysis. Hope it helped keep you informed. Please do support my ideas by boosting, following me and commenting. Thanks again.
Stay tuned for more updates on INFA in the near future.
If you have any questions, do reach out. Thank you again.
DISCLAIMER: This is not financial advice, i am not a financial advisor. The thoughts expressed in the posts are my opinion and for educational purposes. Do not use my ideas for the basis of your trading strategy, make sure to work out your own strategy and when trading always spend majority of your time on risk management strategy.

BionTech Fastly Approaching Major Resistance, Will we Break?Hi Guys, this is a Technical Analysis on BionTech (BNTX) on the 3 Day Timeframe.
We are currently approaching a MAJOR RESISTANCE Trendline.
This Trend started from the TOP in 08/2021.
Everytime we've interacted with it in the past, we've been REJECTED.
Will we get Rejected again?
Well, we've had 3 touch points already. In trendline theory, it states that atleast 3 touches are required before a trendline is weak enough to break through. So, it is possible that a break can occur.
With risk of new variants, hospitalizations of COVID increasing and a push of government to get people to get boosters, this could be a chance for Trend change to UPSIDE for BNTX.
BUT just looking at it in a pure TA lens, i wouldn't just start buying now.
I would wait for a break above the Trendline and CONFIRMATION above it.
Also with the break, note that VOLUME should be spiking and increasing.
We should not see a DECLINE in Volume as we break through.
That can be signs of a FAKEOUT.
We are also reaching some Resistance from a Support line turned Resistance line.
Now lets look at our indicators for more evidence.
RSI -> We've had the Lowest RSI reading on May 09,2023 EVER in BNTX history. This could be a catalyst for more buying pressure and a trend change. We also broke above RSI Red Resistance line.
MACD-> A momentum indicator, has crossed BULLISH, below the 0 level. If we continue this bullish momentum and the Blue/Orange lines move above the 0 level, this can be inject the well needed momentum for BNTX to increase in price.
STOCH RSI -> Is also in a BUllish cross and it shows that theres plenty of room for momentum to continue.
__________________________________________________________________________________
Thank you for taking the time to read my analysis. Hope it helped keep you informed. Please do support my ideas by boosting, following me and commenting. Thanks again.
Stay tuned for more updates on BNTX in the near future.
If you have any questions, do reach out. Thank you again.
DISCLAIMER: This is not financial advice, i am not a financial advisor. The thoughts expressed in the posts are my opinion and for educational purposes. Do not use my ideas for the basis of your trading strategy, make sure to work out your own strategy and when trading always spend majority of your time on risk management strategy.

DWARKESH: RESISTANCE ZONESNSE:DWARKESH is near its Resistance zones. Position can be taken only after breakout and closing of candle above resistance. Stop Loss should be followed.

Sarda energy approaching breakoutKeep and eye on SARDAEN,
Looks good setting up on resistance zone.
Wait for clean breakout.
Personally entered at 1345, will add more if breakout happens.

GAIL making setupGAIL
In range bound mode since 2 years.
Now staying near resistance area.
Keep it on watchlist and trade on confirmation
