Aeron Feeling Strong Against the BitcoinAeron formed the strong bottom at 13k satoshis and rejected that level for 3 consecutive times. The most recent bounce occurred on the 11th of May, after which price started to produce higher highs and higher lows.
ARN/BTC broke above the 200 Moving Average and then above the ascending channel, suggesting the beginning of an uptrend. The strong resistance is seen at 161.8% Fibonacci retracement level, that is 31.5k satoshis. This means that it could potentially outperform the Bitcoin by almost 3 times in the medium term.
It seems that the downside risk at this point is very low and probability of the uptrend is much higher. Nevertheless, break and close below the 13k support could invalidate bullish outlook and extend the consolidation.
Resistnace

GBP/CHF Potential Resistance BounceGBP/CHF hitting an important resistance level. Also bouncing from the top Trendline. Before entering a sell trade I will wait for downside confirmation. This is a long term swing trade.
- Always risking 1% or 2% on each trade. Never more.

Article 50 Trigger to compound a short term correction in USD?technically GBPUSD set to drop back to 1.21 add the fundamentals with article 50 triggering next week on the 29th, will we see a sell off in GBP in anticipation of what may happen.
DX short term correction for me will add more downside to this trade, nice R:R

KBR short entryKBR plunged down on earnings, and quickly recovered to its ~15.65 resistance level. It is showing a lot of long wicks at this level on decreasing volume, and the 15 minute chart shows further bearish signs.
A short entry into this position with a price target at the 14.74 resistance level could yield positive gains when combined with an options play.

Nike (NKE) short play off resistanceNKE is showing the following strong short entry signals:
- descending price channel (examine weekly chart to see this easier)
- Currently at top of descending price channel
- Showing strong resistance, a successive lower peak (not quite a true head and shoulders), and divergences.
This is a good short trade that could be played several ways.
- Swing play: Enter immediately. Set stop loss above resistance line ($56.85) and set price target below previous daily triple top at $53. This is approximately a 5-10 day trade estimate.
- Medium term play: Enter immediately or after confirmation. Same stop loss. set price target at actual lower resistance channel, plus some. Depending on variable time value this could be as low as $47-48. Continue extending channel to provide updated price estimate based on the slope over time.

Rectangle Pattern - AUDJPY (4Hrs)Hello Traders,
I hope everyone had a profitable week.
Here is something for the next week..
AUDJPY is in consolidation zone in a rectangle channel since last few days. It seems like price is resisting and will make downward move to retest the support area. Latest Engulfing Candle on resistance level and an overbought RSI indicate short entry.

#USDJPY Short Idea Butterfly Pattern with Previous Resistance#USDJPY Short Idea Butterfly Pattern with Previous Resistance

Apple potential short, testing major resistanceApple is testing a key level... i will watch price action for bearish signals as well as watching for a break down of the ascending channel

CADCHF Resistance LevelsDISCLAIMER: Hi everyone, I'm new to trading and this is just a log book for me on applying everything that I have learned and continue to learn as I go along. That being said, I do not advise you to base your trading on these "ideas".
So I've had a pretty crappy week of trading. Lost my focus last week after leaving money on the table on a trade and messed up my whole week. I started making impulsive trades instead of studying my way into trades. During one of my impulsive trades I noticed the CADCHF has been on an uptrend for a good while now. I remembererd what I've studied and learned and took a look to the left. Founf that it broke previous resistance from November 2015 and from April 2016. Now, Although it did break that resistance the price closed downards if you take a look at an hourly time frame. So I will stay put for now, just put this pair on my watch list. If it passes that resistance again, where will the next target be? Could it be the price from April 2015? Or could this be it for the bulls and now the bears kick in?
Always remember to not revengre trade, to study and know why you are getting in a trend and where you want it to go. Remember not to get attached. Trade it dont date it!

CADJPY JUST HIT A MAJOR RESISTANCE ZONECADJPY Has been up for the last weeks. Just reached a major resistance zone. Great opportunity for a short on CADJPY.

At 50% retracementWe have retraced 50% of the fall and this area will act as resistance for now. There might be either a consolidation or another pullback to test the 710-720 area. If the price breaks up from here right away it will be very bullish.

We will have maybe a bearish move ? I think yes.lets see if the price action respects the resistance line and will move downside.

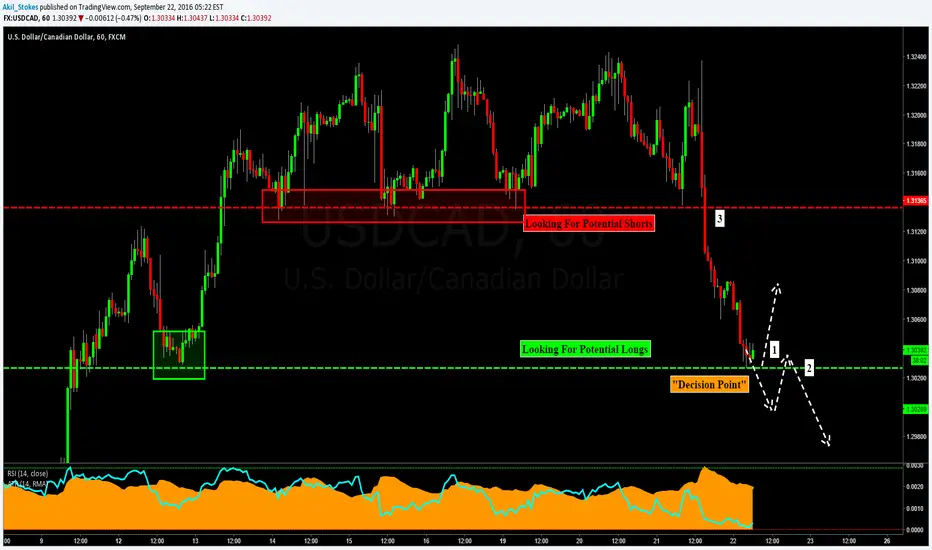
USDCAD: Sitting at a Decision Point After holding higher timerframe resistance the USDCAD has made 220+ pip move to the downside and has now found previous structure support.
I like to call this area a "decision point" when doing my analysis because a few trading opportunities are offered at this level depending on how price reacts.
1) IF support holds THEN we have a potential buying opportunity.
2) IF support fails THEN we have a potential selling opportunity as it turns to resistance
2) IF Support holds and retraces back towards the 1.3130's level THEN we also have a potential selling opportunity
These are the type of pairs that I put at the very top of my watch list as potential opportunities are right around the corner
Short NZDUSD : Simple Trend Continuation SetupHi Guys,
This one is simple trend continuation setup as it reaches to our resistance zone NZDUSD may reverse. So on valid confirmation in resistance area initiate shortpositions in NZDUSD
Thanks for your support...
Happy Trading !

Dabur : Resistance retest (Short)Price is raising up towards our region as expected and I will be going short here with my stops above the double top
Not describing in detail bcos market is very near to our zone & we may miss trade chance.
Happy trading

GPBAUD Spike Trade Rejection or BreakThese spikes are starting to show strong rejection. There is a trend line bringing the price up, and with a change in the head of the Reserve Bank of Australia, anything could happen. The blue rectangle represents the unknown zone. I would suggest targeting the short term short, and put your stop loss at the top of the blue rectangle. If the price closes above the rectangle, close the short, and go long, otherwise, stay short and target those 100 pips. If price breaks the blue rectangle, it will easily cover your loss on the short position and still give you profit. There should be profits either way.


SPY is strongly bullish in front of resistanceDespite the fact that every day we see negative news (oil freez failed) and different comments in articles, the action in market is bullish. That is why I prefer to listen the price, not analysts with their opinion.
So, as we are approaching major resistance area after a long run, I wouldn't be chasing (initiating new positions) here. Better to wait for another "consolidation and break" setup or maybe even reversal setup just to catch tactical pullback.
I will put my levels in front of me, to measure the sentiment. For active traders, the higher it holds the higher is probability of continuation move to the upside. We have $208.60 active support level, then $207 gap support

Short Aussie Dollar at ResistanceAussie Dollar today bounced off of a key area of resistance at around 0.757. I have an order to sell AUDUSD at 0.7485, a break of the pin bar's low. Our first target is around the 0.737 level.

EURUSD MAYBE LONG ON THE DAILY (NO TRADE TAKEN)Hello again,
Just doing some more analysis on another pair, this is what I think may happen as the FED will be increase their information on whether to keep or change interest rate in the next couple of days which may weaken the dollar.
Again I welcome any feedback good or bad as mentioned I am only testing my knowledge before I go LIVE trading.

GBPUSD: As We Approach A Trend Rotation, Will the Bulls Protect?Usually I share EURUSD ideas with you guys, but I wanted to switch it up and look at something different since the Euro is still playing out yesterday’s prediction. (By the way, if you want to see a breakdown that we’ve been doing on it over the past few days in my live trading room check out this video www.youtube.com) There’s also a special cameo in the video ;-)
GBPUSD is at an interesting level as we’re currently at the top end of what to me is a major level of support. If you look at the ebbs and flows on the daily chart (above) you’ll see that we’re approaching the previous outside return (retracement) and a violation of this level would cause a rotation in trend. For that reason I expect the bulls to be on the defensive fighting hard not to give up that area.
Technically this is an at market buy right now as we’ve double bottomed at the zone, due to the retest of structure on the peak, I’d like to see a push lower into the 1.5350’s level reducing my potential risk as well.
Depending on if/how this completes will dictate targets but I would expect a move back up into the 1.5420’s-1.5450’s level for first targets.
Have a great Weekend Traders! And do me a favor, if you’ve been enjoying my post, please hit that like button and leave a comment. I’m close to making the “All-Time” top author list here at Tradingview and I think that would be awesome.
Lastly make sure you check out the interview from my client and good friend Jason Graystone “On Losing, Losing Some More, Then Winning” It’s a great read for all up and coming traders. tradingstory.com
Akil Stokes
Chief Currency Analysis at Trade Empowered
Click here for 20+ hours of FREE Training
tradeempowered.com
Click the link below to subscribe for more FOREX TRADING videos
www.youtube.com
Facebook: www.facebook.com
Twitter: twitter.com

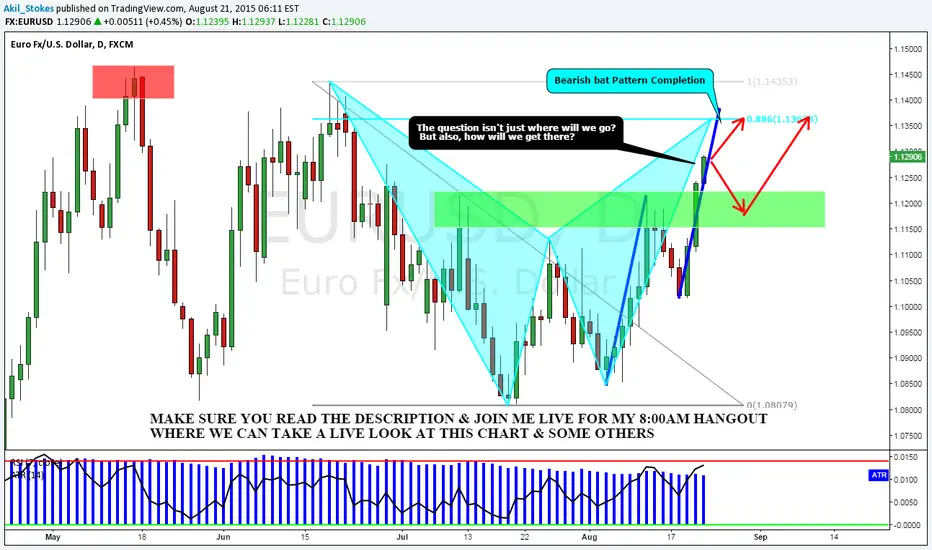
EURUSD: Bat Pattern Setting Up, How Will We Get ThereIn yesterday’s post I mentioned that the EURUSD was at a decision point. Well, it looks like the markets didn’t decided to go with my decision to get short as I was stopped out on the 2618 opportunity. Luckily Jason had a monster day in the Syndicate bringing in just under 300 pips himself. That’s what friends are for!
Now that the Euro has broken and closed above the previous resistance level it’s time to redo that IPDE process and prepared for the next move. Our next structure level starts around the 1.1360’s area which would also line up with a bearish bat pattern completion here on the daily. I’m not a daily chart trader, but this information will be useful for building a CTS score as I do analysis on the lower timeframes. One thing to be careful with is the higher level of structure looking left. In my experience I’ve noticed that when two levels of structure are close to eachother, the higher one is typically tested. Something to keep in mind when placing those stop losses.
In the mean time, there are two ways that price action can reach that level, it can either go directly there, or we may see a pullback into previous resistance which should now act as support
Because I didn’t have the chance to record a Weekend Review video last night I’m going to do another Live Google Hangout for the first 20 minute so of today’s Live Trading Room. Here’s the link if you want to join. And make sure you subscribe to my channel.
Click here to join the hangout www.youtube.com
Akil Stokes
Chief Currency Analysis at Trade Empowered
Click here for 20+ hours of FREE Training
tradeempowered.com
Click the link below to subscribe for more FOREX TRADING videos
www.youtube.com
Facebook: www.facebook.com
Twitter: twitter.com
VZ Riding SupportVZ has come to trade in a nice little squeeze of a channel here for the past week. This support level also happens to be the .618 of the bigger picture leg. Momentum continues to see higher lows which should lead to this level holding up and a retest to the next resistance level.
