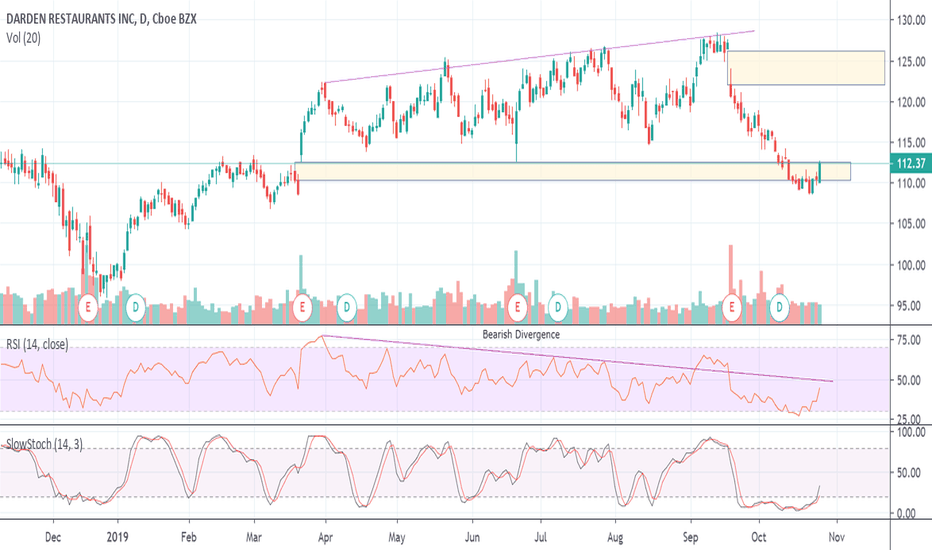
DRI - Let's Go Out For A BiteDRI had a gap up on an earnings announcement back on March 21st. The top of this gap became support while the stock price continued to rise. This rise in price created a bearish divergence with the RSI indicator.
The earnings release in September led to a gap down. The price actually consolidated just below the March gap. Friday's trading has the price testing the resistance level of the March gap zone with the stock finding strength.
DRI is finding relative strength within the Restaurant industry but still needs some more time to see if it is gaining strength on the SPX. If the price continues to rise I would expect a re-test of the bottom of the gap down zone around $122.
Restaurants
Starbucks: The selling isn't over.Starbucks is being under heavy selling pressure since the start of September having fallen over -12% since its All Time High. This is not alarming for long term investors as the rise since July 2018 has been extremely aggressive (that aggressive that the Monthly chart is still bullish with RSI = 67.474, MACD = 8.570, Highs/Lows = 8.7721), but the selling isn't over yet.
According to its long term set up since 2012, the price always touches the MA50 on the 1W chart (illustrated with blue) after a market peak. Currently that is at 77.50, within the 81.65 - 73.65 range made after the % decline of the last 2 ATH falls. We expect that to be the Demand Zone for the stock and is where we are turning into long term buyers again towards a target value above 100.
** If you like our free content follow our profile (www.tradingview.com) to get more daily ideas. **
Comments and likes are greatly appreciated.
McDonald’s: Where to buy for a long term investment.MCD (McDonald’s Corporation) has been trading within a very strong 1M Channel Up (RSI = 70.206, MACD = 17.720, Highs/Lows = 10.6514), which as seen by its technical action is on the Higher High zone.
Based on its historic volatility within the Channel Up, we expect MCD to pull back for a Higher Low towards 190 before resuming the uptrend. A potential Death Cross (MA50 under MA200) should come as confirmation of a sideways phase (bottom is in) and a Golden Cross (MA50 over MA200) as confirmation of the next bullish leg.
The RSI pattern seems to also be cyclical and in that sense we have hit the Higher High and are in anticipation of the Higher Low. Our long term Target is at least 240.00.
** If you like our free content follow our profile (www.tradingview.com) to get more daily ideas. **
Comments and likes are greatly appreciated.


