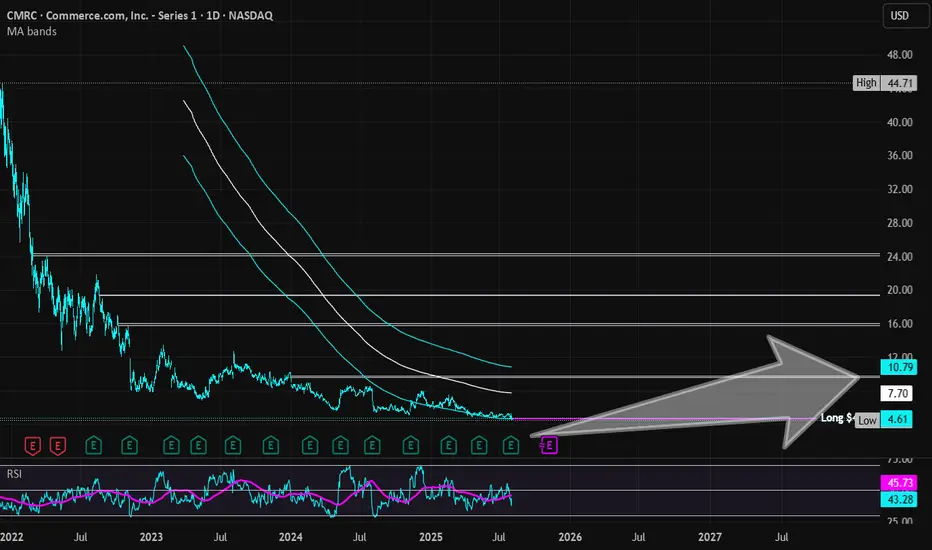
Commerce.com | CMRC | Long at $4.68BigCommerce recently rebranded to Commerce.com NASDAQ:CMRC . Full disclosure: I am an initial stockholder at $7.15, but grabbing more shares below $5 - average current holding is $5.68.
During the most recent earnings call for NASDAQ:CMRC , the company announced AI-driven partnerships with Google Cloud (Gemini) and PROS Holdings to enhance product discovery and pricing. They are now focused on "agentic commerce" (a new paradigm in online shopping where AI-powered agents autonomously handle the entire shopping process, from product discovery to purchase, on behalf of users) and B2B growth (Quick Start Accelerator program). The shift of this company focusing away from standard shopping experiences to new AI-powered ones is a major catalyst for me believing this company can grow significantly. Companies like NASDAQ:URBN , NYSE:TPR , NYSE:DELL , NYSE:VFC use NASDAQ:CMRC and others will surely hop on board if the AI shopping enhances consumer experiences.
However, the economy is VERY shaky right now and consumers are spending less. There is a chance the growth outlook for NASDAQ:CMRC (4.6% annual revenue growth through 2028) may not occur. Thus, this is a **highly speculative** investment. I would not be surprised if the economy flips and this tanks to near or below $1 in the near-term. With that in-mind, this is a long-term position build for me until targets are hit. If I have to hold for years, I am okay with that as long as the major fundamentals do not change. Those without thick skin should stay away...
From a technical analysis perspective, the price has entered and is riding my historical simple moving average area. This usually signifies the accumulation phase of a stock cycle and is what I will be doing - which is why I am adding shares at $4.68.
Targets into 2028:
$7.00 (+49.6%)
$9.50 (+103.0%)
Retail
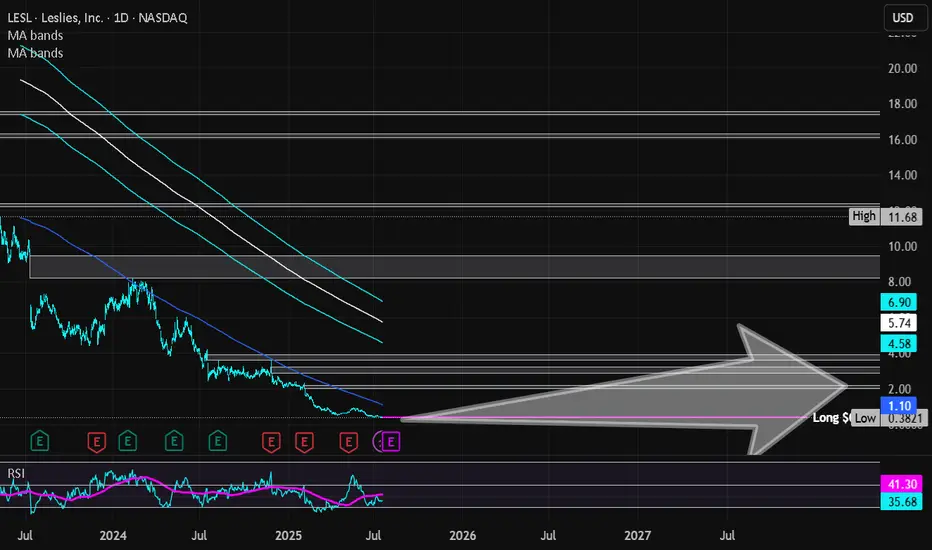
Leslies Inc | LESL | Long at $0.41**VERY risky trade - 25% or more risk of bankruptcy**
Leslies NASDAQ:LESL is a direct-to-consumer pool and spa care brand in the U.S., selling chemicals, equipment, and services. The stock dropped 88.86% last year due to weak demand, flat revenue, shrinking gross margins from stock write-downs, higher rent, shipping costs, and an earnings miss (-$0.25 vs. -$0.244). High debt, market share losses to e-commerce, and a competitive pool supply market also contributed.
On a positive note, the company generated $1.33 billion in revenue for fiscal year 2024. New leadership has entered the picture, cost-cutting is starting to happen, and summer season may boost pool sales. While 2025 is still projected to be a rough year, revenue is forecasted to grow 6.4% in 2026 and 2027 and earnings are likely to turn positive (based on company statements). While this is a *highly risky* play and there are absolutely better companies out there, I think there is a chance this ticker may get some steam in the near future. 7% short interest, 176 million float.
Thus, at $0.41, NASDAQ:LESL is in a personal buy zone.
Targets into 2027:
$1.00 (+143.9%)
$2.00 (+387.8%)
Bark | BARK | Long at $0.84BARK, Inc. NYSE:BARK is a dog-focused company offering subscription-based products like BarkBox and Super Chewer, delivering monthly toys, treats, and pet supplies. It operates in Direct-to-Consumer and Commerce segments, selling through its website, retail partners, and e-commerce platforms. While not overly bullish here, especially given the economic / recession-fear headwinds, I think this is one of those stocks that may have a future "pop" as interest rates are lowered, or news emerges of the company expanding to new retail partners. A few insiders have recently purchased shares (~$75k under $1.00) and others have been awarded options. The book value currently rests near $0.64. It may dip between that price at $0.50 in the near-term. However, that's just been the trajectory of SO many of these SPAC stocks... dip then pop or bust.
Fundamentally, nothing to uproar over and this is a risky investment (Nasdaq delisting may occur). The positive is the debt-to-equity in 0.9x, which is pretty good for a small company. But 2026 is expected to be its worst earnings year. The future may look bright in 2027 and beyond, but can the company last? Time will tell.
Thus, for a swing trade, NYSE:BARK is in a personal buy zone at $0.84 with a risk of further near-term decline between $0.50 and $0.64.
Targets into 2027
$0.95 (+13.1%)
$1.25 (+48.8%)

JD.cm | JD | Long at $33.16Like Amazon NASDAQ:AMZN and Alibaba NYSE:BABA , I suspect AI and robotics will enhance JD.com's NASDAQ:JD automation in warehousing, delivery, and retail. There is some risk here, like other Chinese stocks, that they could be delisted from the US market if trade/war tensions rise. But I just don't think that is likely (no matter the threats) due to the importance of worldwide trade and investment. I could be way wrong, though...
NASDAQ:JD has a current P/E of 8.1x and a forward P/E of 1.2x, which indicates strong earnings growth ahead. The company is healthy, with a debt-to-equity of 0.4x, Altmans Z Score of 2.6, and a Quick Ratio of .9 (could be better).
From a technical analysis perspective, the historical simple moving average (SMA) band is still in an overall downtrend but starting to level out (accumulation of share area). It is possible, however, that the price may drop into the $20s to close out the existing price gaps on the daily chart as tariff threats arise. But that area is another personal entry zone if fundamentals hold.
Thus, while it could be a bumpy ride and the risk is there for delisting, NASDAQ:JD is in a personal buy zone at $33.16 (with known risk of drop to the $20s in the near-term).
Targets into 2028:
$44.00 (+32.7%)
$52.00 (+56.8%)

Potential outside week and bullish potential for CQREntry conditions:
(i) higher share price for ASX:CQR above the level of the potential outside week noted on 6th June (i.e.: above the level of $4.10).
Stop loss for the trade would be:
(i) below the low of the outside week on 2nd June (i.e.: below $3.91), should the trade activate.

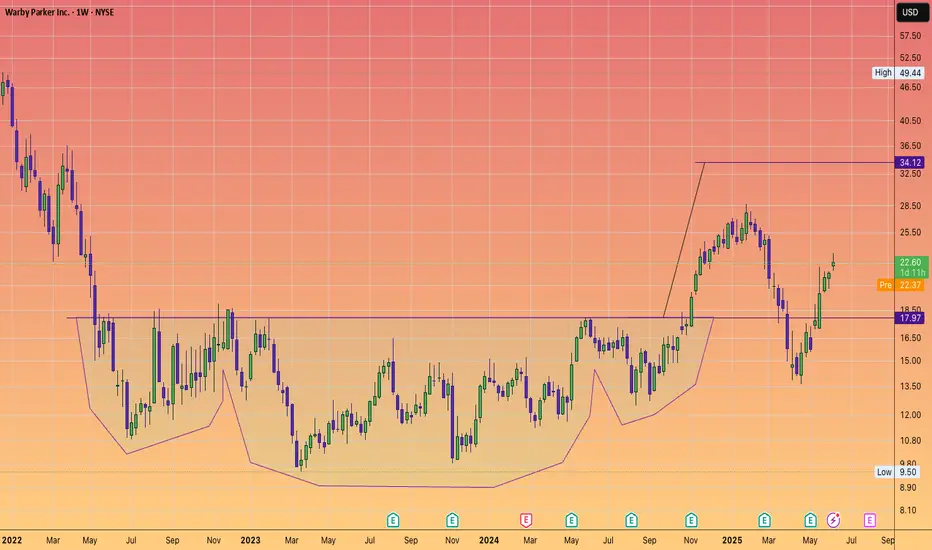
WARBY PARKER to continue its recovery to $34 and beyond#inverseheadandshoulders
They want to have 900 retail locations
currently operating 271 in the US and 5 in Canada.
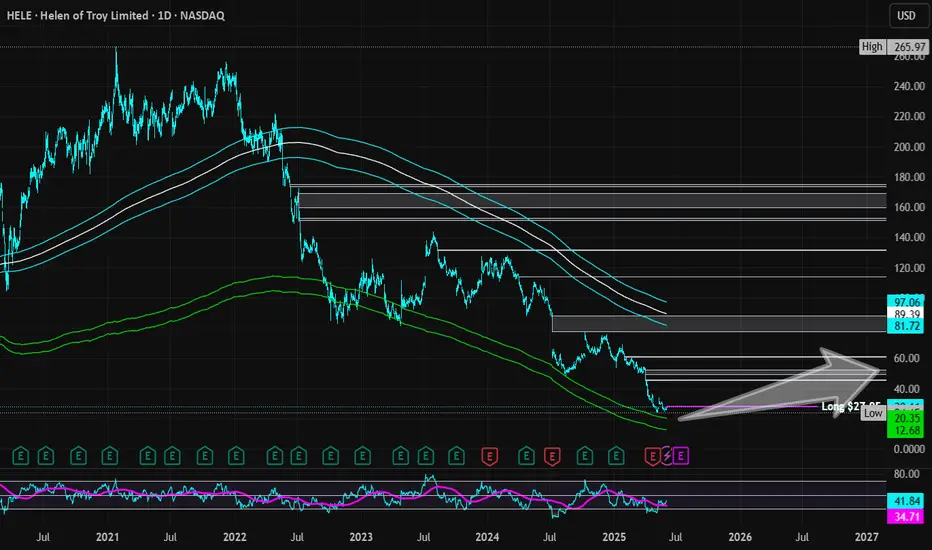
Helen of Troy | HELE | Long at $27.95Helen of Troy NASDAQ:HELE , owner of brands such as OXO, Hydro Flask, Osprey, Vicks, Olive & June, etc, has witnessed an immense decline in share price since its peak in 2021 when it hit just over $265. Now, trading in the $20s... Growth has been a problem for this company (now and future projections) and a major turnaround is needed. However, NASDAQ:HELE is implementing several growth strategies for 2025-2030 under its Elevate for Growth plan and Project Pegasus, so they are very aware of the need to re-inspire investor confidence. They also announced last month the appointment of an interim CEO and CFO. With a 22M float and 12% short interest, this could get interesting.
Excluding the current growth issue, the fundamentals of NASDAQ:HELE are quite strong:
P/E Ratio: 5x (undervalued)
Book Value: ~$70.00 a share (undervalued)
Debt-to-Equity: 0.6x (healthy)
Quick Ratio: Over 1 (healthy)
From a technical analysis perspective, it may have just formed a double-bottom near $24-$25, but a quick drop between $10-$20 is absolutely possible if bad economic news emerges.
At $27.95, NASDAQ:HELE is in a personal buy zone with a caution regarding the US economy and this company's ability to turn things around moving forward.
Targets:
$40.00 (+43.1%)
$52.00 (+86.0%)
GROUPON IS UP 10X - But more upside to come. #GRPN has been on fire.
It has also smashed through a major downtrend line and key horizontal level.
I expect the trend to continue.
"The company expects 2025 revenue between $493 million and $500 million and adjusted EBITDA of $70 million to $75 million, both topping Bloomberg's consensus estimates of $491.3 million in revenue and $74.8 million in EBITDA. Groupon also projects at least $41 million in free cash flow for the year."
#Roaring20's

Game-changing analysis technique that will elevate your strategyAs many of my loyal followers know, my analysis toolkit goes beyond just the standard fare of CME options data and COT reports. I dive deeper, utilizing additional filters like the average long and short positions of retail traders. These insights are publicly available, and while I won’t name specific sources to avoid any hint of hidden promotion, I’ll give you a clue: look for a website with the word "book" in its title. 📚
For years, I’ve relied on this data, and it has proven to be both reliable and insightful. The average positions of market participants serve as both filters and indicators. But what do I mean by indicators?
Let’s break it down. When the price interacts with these levels, it reveals the market sentiment. For instance, if the price is below the average long position and breaks through easily, it’s a bullish sentiment. Conversely, if it hovers below the level and struggles to break through, that’s still bullish, as it indicates buyers are being drawn into profitable territory.
Now, let’s flip the script for the bears: if the price breaks down from above or struggles below the average short position, that’s a bearish sentiment. The price isn’t responding to sellers, dragging them into a profit land.
There’s more. Often, you’ll notice different behaviors near these key levels, allowing you to enter positions with an incredible risk/reward ratio of 3:1, 5:1, or even better! This clarity gives you insight into the current market mood—who’s being punished and who’s favored at that moment.
Now, let’s take a look at the screenshot of the British Pound futures chart. Here’s what you’ll see:
- A green line representing the average long position of retail traders.
- A red line for the average short position.
- The breakeven point of a put option contract for the June futures expiring on May 22, with 1,320 contracts at a strike of 1.295.
Take a moment to study the chart. What do you observe? 🤓
Ok, breathe in, breathe out. Tomorrow, we’ll dive deeper into this analysis. Don’t forget to subscribe so you won’t miss the continuation of this story! The insights I’ll share are definitely worth your time, as I aim to shift your perspective on the market by demonstrating a clear methodology without relying on indicators or technical patterns.
Stay tuned; it’s going to be incredibly valuable! 🚀✨

Miniso: Holding SteadyMNSO showed little volatility last week, recording only minor single-digit percentage pullbacks. Still, we expect further downside ahead. As the decline continues, the stock should reach the green Target Zone between $9.90 and $7.33. Within that range, we anticipate the low of the green wave . This bottom should then set the stage for a new upward move, which should eventually break above the resistance at $35.22 via a turquoise five-wave structure.

Time for a bounce and drop another 50%This is sitting right on support line and may bounce for some time. I think it will eventually come down to mid 20s, may be, with in a year.

UPS looking DOWNSNice head and Shoulders on the United Parcel Service
#UPS and FEDEX are the new dow transport indicator.
An underlying determinant of how the consumer is faring
Since the US is a consumer economy and Online shopping is the majority of retail
if we see new highs on the Indicies, and the home delivery carriers continue to deteriorate
it would give your non confirmation Top
Similar to Dow theory of new High's in the Industrials , but the transports lagging and indeed falling.

NikePoor results mean Nike has broken out of a triangle pattern which started forming in March 2022.
Clean break down with large sell side volume.

Walmart on Major SupportWalmart is quite a bit above it's last solid trend line. That suggests it could range out on this support for a while before it does another big move again. But it could also keep on the current trend and run to $145. Either way owning the stock here seems like a good idea.
Good luck!

AMAZON Is it worth buying now?Amazon (AMZN) broke below its 1W MA50 (blue trend-line) last week for the first time since the week of August 05 2024 and opened this week below it. As you can see, the stock has been trading within a 2-year Channel Up and today's candle is as close to a technical Higher Low (bottom) as it can get.
The previous Higher Low was in fact that Aug 05 2024 candle, which despite breaking below the 1W MA50, managed to post a strong intra-week recovery and close above the it. Technically that was the 'Max pain' situation on every 1W bottom candle in those 2 years.
Every Bullish Leg that followed was around +65.24%, so that gives us an end-of-year technical Target of $300.
-------------------------------------------------------------------------------
** Please LIKE 👍, FOLLOW ✅, SHARE 🙌 and COMMENT ✍ if you enjoy this idea! Also share your ideas and charts in the comments section below! This is best way to keep it relevant, support us, keep the content here free and allow the idea to reach as many people as possible. **
-------------------------------------------------------------------------------
💸💸💸💸💸💸
👇 👇 👇 👇 👇 👇

(RL) ralph lauren Crazy high price for Ralph Lauren right now. The RL stock is doing excellently; as I just noticed today. I was unable to find any clothing that fit me or fashion styles that looked both vintage and modern at the same time during the Holidays this year; or any year. On average, inside the RL store in Lehi, UT the quality of styles is limited and the prices are typical of what one would expect from RL. I wish RL would offer more styles that they used to based on the 90s and early 2000s here in Utah. I wish the discounted styles in my size were offered or not completely gone as soon as the sale arrives during the Holidays. RL is a highly sought after brand but I've only ever owned one piece of cotton blue button up Ralph Lauren Levi's-esque shirt that ripped at the elbow due to the cotton material being so tender. I'm not rating RL as a short due to the fact that I don't own the clothing and can't afford the clothing. The MACD is really high right now.

$COIN The Retail Money PitCoinbase stock has consistently underperformed due to growing concerns about the companies long term viability. Despite good earnings, smart money knows strong quarterly reports will come and go with each cycle. Save your hard earned money and invest in a more fruitful buisness model.

$GRAB yourself some GAINS!NASDAQ:GRAB yourself some GAINS!
The longer the base, the higher the space!
Lots of retail and super investors buying this name.
A train that goes in motion stays in motion...
- Wr% is in motion to the Green Support Beam.
Typically, this name would probably pull back with the direction of the Wr%, BUT... this stock is getting hyped up by a lot of super investors and retail investors right now. I think this week we will see a large move upward as HYPE creates FOMO which takes the stock HIGHER!
Staying patient here...
Not financial advice

Under Armour | UA | Long at $6.74Under Armour $NYSE:UA. Price may break my historical simple moving average area/lines and dip into the low $6s, but the convergence of price with these lines often means a future price increase. Fundamentally, the stock continues to surprise with earnings beat after earnings beat. While economic headwinds are likely ahead in the retail market, global exposure may ease the likely troubles. Starter position entered at $6.74.
Targets
$7.50
$8.00

$BITF - Bottom In?Hello Friends,
For those of you looking to capitalize on NASDAQ:BITF you may want to add to your position, or start accumulating for the first time.
Posting a fresh idea here for NASDAQ:BITF now that the bottom should be in.
Keeping with the Bullish narrative of CRYPTOCAP:BTC we can assume NASDAQ:BITF will once again see another projection higher back to its 2024 ATH (All Time High) of $3.91.
I will post further Exit/ TP objective as we see NASDAQ:BITF move out of its current consolidation.

$COIN - Update: Buy + TPHello Friends,
For those of you looking to capitalize on NASDAQ:COIN you may want to add to your position, or start accumulating for the first time.
My original post:
UPDATED IDEA:
NASDAQ:COIN moving nice with CRYPTOCAP:BTC in this 2024-2025 Bull Run!
Remember, NASDAQ:COIN basically mimics CRYPTOCAP:BTC so we want to trade them in a similar fashion.
As you can see NASDAQ:COIN is still trading below the $368.90 High & the ATH of $429.54.
I am expecting those levels to be traded to as CRYPTOCAP:BTC continues higher.
The chart showing "Swing Protection TP 1" based on our current swing we left ($283-$149) is giving us a projection of $419.61.
That being said, if you wish to add to your NASDAQ:COIN holdings at ~$318 (or lower), you have upside available to take profits.
Please note: $429.54 ATH is a good objective.
Will NASDAQ:COIN go higher with this bull run? IT all depends on when CRYPTOCAP:BTC tops out - I will update you then or follow along with my CRYPTOCAP:BTC exit strategy...
Check out this link for my BTC Exit Strategy :

Aditya Birla FashioMcap: Rs 30,000 cr
Losses as Capex still growing
Rumours of splitting the company.
Technically, in a downturn but has posted 26% for the year and outperformed Nifty.
Target 190 !!
timeline: Mid May 25.

LULU, a stock to watch!Lululemon stock (LULU) has traded down into the $230's for the first time since the COVID-19 Crash of 2020. I believe that LULU is a stock to keep your eye on, for a few reasons.
- The stock is trading at a 20x p/e whereas its historical p/e is in the mid 40's.
- Margins for the company have all been steady, and remain an industry leader.
- Lululemon is still set to see 10% CAGR for EPS in the next 5 years. (consensus)
- The stock is seeing a severe correction, on par with its past decade corrections.
Above is bullish sentiment on LULU, and can be considered the "bull/base case"
Personally, I have not turned bullish on LULU yet, but with the levels it is reaching it has most certainly caught my eye and has been added to my watch list. While the stock is seeing oversold levels, I think the midterm outlook can still remain bearish for Lululemon. Below are reasons why the short/midterm outlook for LULU may not be optimal.
- Weaker forward projections compared to last 5 years.
Though LULU is expecting 10% CAGR EPS for the next 5 years, that is just a fraction of its last 5 year CAGR of 38.55%. While projections are still positive, they have certainly dampened compared to recent years' growth.
- Macroeconomic environment.
Though the economy remains hot/fine for now, there have been warning signs flashing of a rising unemployment figure across the country. With suboptimal economic conditions, the average consumer may cut down on expensive Lululemon clothing.
These Macro conditions may also continue to dampen the economy, which can cause an overall market correction, where LULU would likely follow the sentiment.
Overall, I believe that LULU offers significant reward, but the shorter term horizon is still worrisome for Lululemon and the global economy. Lululemon is a leader in the Retail Trade sector and dominates when it comes to profitability. The stock is definitely one to keep an eye on if it continues to get crushed.
Regarding technicals, I am watching this demand zone around the 200 level. The stock could trend down to this area, and reach close to COVID-19 lows if sentiment does not change. This area could also offer significant R/R for an entry point.
Disclosure: I currently hold no position in LULU stock, and have never been a shareholder.
