Bed Bath and Beyond after hours earnings playBBBY reported mixed earnings results, which has the after hours price hovering right around its closing price for the day. Adjusted earnings beat slightly, while revenue and sales missed slightly.
Guidance was also a bit mixed, since the revenue forecast is slightly lower than expected ($11.4 billion actual vs. $11.77 billion estimate), but the earnings forecast beats analyst estimates by a significant margin ($2.11 per share at the midpoint, vs. the $1.81 per share estimate).
On the strength of the earnings forecast, I'd think think this should end the day slightly up tomorrow. This news isn't a really strong catalyst, but the stock is cheap at the current price, and this could help start to reverse the long-term downtrend. However, given how pessimistic the market is right now, this could totally drop instead. Watch the after-hours and pre-market price action and be careful out there.
Retail

SFIX buy the dip and hold for a couple quartersStitch Fix is down over 8% after hours. It beat analyst earnings estimates by 75%, although it slightly missed analyst estimates of revenue and customer growth (an almost negligible difference). The midpoint of its earnings guidance for 2020 was slightly above analyst estimates (again, an almost negligible difference).
The reason Stitch Fix is down is that on the conference call, the company CEO predicted a "soft" start in Q1 2020. Stitch Fix's marketing team noticed that summer is their strongest season, so they spent less capital marketing for the winter. To me this sounds like smart and efficient capital allocation, especially given Stitch Fix's steep marketing costs. In the short term, however, it means that Stitch Fix's stock price could languish this winter, and then recover in the spring and summer.
A couple thoughts. First, Stitch Fix has short-term support around 18.24, and I think tomorrow it will rally on the strength of its earnings beat. So this could be a great one-day swing trade if you can get an entry near the support level. Mid-term the price could fall as low as $15 per share during the slow winter season, which would be a great price to buy and hold for a couple quarters to benefit from the seasonal upswing in summer.
For free news analysis and educational videos, check out my new beginner investing channel on YouTube, "Wall Street Petting Zoo!"

150 pips for the patient.AUDNZD - textbook setup.
This one can be sold into 1.05340 for a cool 150 pips profit.
Let's get it!

Walmart Readying Itself for EMA Correction After Island ReversalNYSE:WMT has been beaten around lately after a report found they were mistreating a group of 178 female workers. After a gap down, more selling off, and then a rebound just above the widely used 200-EMA, it is now seemingly gearing up for a a bullish reversal out of an island reversal chart pattern.
Green line: island reversal trajectory
Orange rectangle: Gap zone with necessary breach for bullish confirmation.
I would not enter a bullish position on NYSE:WMT without seeking this confirmation first.

Michaels looks good for a call optionMichaels has been down, down, down for months. With its positive earnings report today, that trend could change in a big way. Despite rising China tariffs, Michaels has increased its operating income and opened more stores than it's closed. Barring additional tariffs, Michaels should start to pull out of its down trend. At the very least, I expect to see a test of my blue trend line soon.

Trapping Breakout and Retracement TradersThis is by no means to be anti-breakout/anti-retracement. I find these entry methods as a valid entry method. As valid as it is, the triggers for such entry method are mostly obvious hence easily to be taken advantage of by the institutional traders.
For breakout traders, how these banks would trap is the normal fake breakouts. We all know this as it is a guarantee that it is part of a retail trader, to be the receiving end of this stop hunt. Even if the breakout turns out to be the start of a trend, the institution would tap into the breakout traders stop-loss first (if there is not enough liquidity) before the move continues away from the breakout level.
For retracement traders (who prefers the price to retrace first upon the breakout before entry) are not safe with this stop hunt as well. Whatever triggers it was, the stop loss for this traders tends to reside the recent highs or lows of the underlying move. In this example, let's assume the trigger was a bearish engulfing candle. The stop loss would normally be a few pips above the high of the candle.
This is just my personal preference with all due respect for those who trades breakouts and retracements (and I am sure some of you made tons of profits trading this way, I just can't make it work and I never able to be comfortable with it, for these reasons I tend to fade breakouts and avoid "retracement" and "continuation" trade triggers respectively.
Read my other posts on that has titles like "Navigating the Market" and other educational posts which I share how I navigate the market to eliminate the noise and finding the optimal time to trade.

Trade the Other Side of RetailSpotting where the buy stops and sell stops (which the institutional traders would look for and eventually consume it) is not that difficult. All you need is to think "when I was a newbie trader, where would I put my stops based on xyz method"
The most common stop losses that is easy to spot are ones for reversal traders (using reversal candlestick pattern such as the bearish engulfing candle for a short signal) and retracement traders (and MA crossover traders)
You can refer to the chart what I am talking about.
Once you determine the potential stops, then that becomes your own discovered liquidity pool. It will come very handy for your own entry points, bias setting or simply knowing which levels to avoid to put your stops. Remember, institutional traders have BIG positions to make and with big positions you need liquidity so there will be no slippage when they make their market order
(i.e Bank Trader in Canada wants to buy 500 million units AUD at 0.90600 but not enough supply/sellers at that price, so to avoid being filled at much more expensive price (slippage), then he wait and/or manipulate the price where there are enough sellers for him to buy the AUD that is at a better price than 0.90600.
Liquidity Pool is the area where the Bank Trader in Canada would look to buy the AUD and where that liquidity pool would be? Where there are a lot of stops. 0.89800 resides a lot of stops that would be enough for the 500 million order to be filled without slippage (This is just an oversimplification, sometimes Banks would split their orders)
Using my own personal market navigational method, I draw Friday High and Low, and see where the price would close above/below.
If price breaks above Friday low, I would see if it could breaks above the blue line where the bank would take out all the stops around 0.90400-0.90800 (the higher the better) there and then perhaps push the price down after that.
If price breaks below Friday low, I would see if it could break the stops around 0.89800-0.89600 (the deeper the better) and then I would be looking for a bullish trigger to long AUDCAD

Tesco - Bouncing from the 61.8% Fibonacci supportBUY – TESCO (TSCO)
Tesco PLC (Tesco) is a retail company. The Company is engaged in the business of Retailing and associated activities (Retail) and Retail banking and insurance services.
Fundamentals
It’s been a tough few months for Tesco shareholders with the shares having slumped over 13% from the 2019 high. The business has embarked on a massive overhaul over the past 5 years to make the operation a lot more efficient, which has put the company in a good position overall. The operating margin is continuing to rise, and management believe 4% is achievable in the short term. The company looks set to maintain its position in the market and continue to grow its earnings.
Best Broker Target Price: 285p (Deutsche Bank 19/06/2019)
Worst Broker Target Price: 230p (Goldman Sachs 02/04/2019)
Technical Analysis
2019 started off so well for Tesco share holders with the shares rising from 187p to 254p in the space of just over 4 months. The recent decline from those highs has not been so impressive, but some support appears to be forming around the 61.8% Fibonacci support level at 212.7p. There have been a number of bullish candle around this price, which is an indication that buyers are returning.
Recommendation: Buy
Buy between 215-225p
Stop: 210p
Target: 250p

Idea about UCad.I'm seeing a nice triple Top Resistance combined with a strong Trendline from the past that are holding the price above 1.3330, let's short.

Howden Joinery - Throw the kitchen sink at it?Technical
Howden Joinery looks interesting on a technical basis. The shares shot higher to new highs following a bullish update to the market. We have since seen the share price unwind to some sensible levels as the overall market continues in this condolidaiton phase. The shares have reached a confluence of Fibonacci support levels, which I have highlighted on the chart. We have seen buying interest emerge and a gap higher in price to break out of a consolidation wedge. The overall trend remains bullish and a move to new highs is expected.
Fundamentals
The UK’s leading manufacturer and supplier of fitted kitchens, appliances and joinery products has been paying dividend yields of around 2.5%. Howden ended the reporting period with net cash of £217.1m, which makes its forward P/E multiples of around 14-15 look attractive.
Stop: 505p
Target: 600p

Iconix Brand Group Technical Analysis Higher lows since it bottomed out at 52 week lows (.65) back in June. Built new support @ $1.20. Would be ideal if it can continue to hold above new support.
Next major resistance up @ $1.65. Pivot $1.93 and I believe we can see retracement back to (April highs). PT: $2.40

Delayed tariffs "for Christmas" might help HASBRO
News/fundamental
The USTR says that the tariffs on some items, including “certain toys,” will be delayed until Dec. 15.
September is a key shipping month for those companies as they prepare for the holiday shopping season, when the majority of the industry’s business occurs.
Hasbro told CNBC earlier this month that it would have “no choice but to pass along the increased costs to our U.S. customers” if the tariffs were put into place.
--
Great risk reward ratio.

GBP/JPY Short!! Pound/Yen will continue to go down further.
This is due to the following listed below;
> USD/JPY having a downtrend that may continue
> UK slowing inflation
> UK slowing retail sales
It's in my opinion that a short sell position is made on the 1 day chart, the downtrend is speculated to continue until mid next week.

Stitch Fix's down trend broke todayAhead of earnings, SFIX got an upgrade from the analytics firm Stifel, which cited SFIX's history of strong earnings and its attractive valuation. That appears to have driven a breakout above the stock's downward trend line today. Trend line breaks are usually bullish, and can lead to big gains like the PG&E trend line break I identified the other day. Others are slower gainers, like my LFVN trend line play.
SFIX has recently made an inverted cup, and could now make a handle. Sell any breach of SFIX's new upward trendline.

SFIX may rebound from this levelStitch Fix plummeted today, but it's getting some late-day buying volume at this support node near 27.
We could see a rebound tomorrow, forming something of a bullish bat pattern.
Chewy day trade potentialChewy missed analyst earnings estimates by 1 cent per share, but posted good year-over-year improvement. It's down a lot today, but has support around 31 and could rebound from there. Below the previous low of 30.81 would be a good spot for a stop loss.

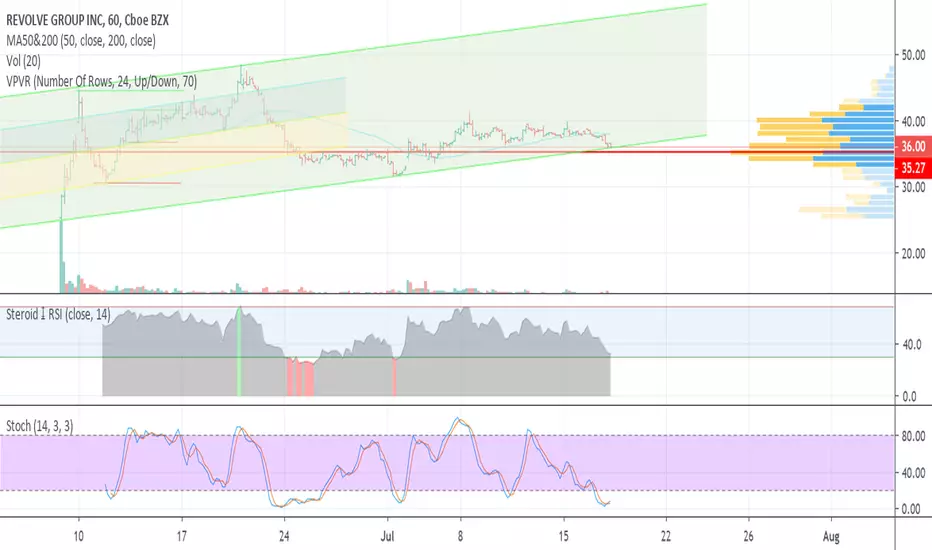
Revolve will establish new channelRevolve has had a rocky time since its IPO, with lots of volatility and several breaks below critical trend lines. However, this company is profitable, undervalued, and highly rated, and in my opinion it's still a great value.
With Revolve having breached the bottom of its parallel channel today, it's likely to establish a new channel. I've drawn a couple possible channels and some trend lines, and I've marked the breakout zones with the play for each zone. I've also marked support and resistance from all-time highs, and you can also see the high-volume support node at 35.27.
Currently I'm playing this long on the basis of that volume support node.

Internet retail meeting resistance near previous highsAs my followers know, I've been following Stitch Fix and Revolve as both stocks take a dive today.
The plummet comes, surprisingly, just a day after strong retail sales data for June. It was the strongest quarterly retail sales growth since they started recording this data in 1992! However, that's mostly because Q1 was so weak that Q2 looks strong by comparison. Year-over-year, the numbers look much weaker.
Most of the strength, however, comes in the retail and consumer staples sectors, while the weakness is mostly in cars, building supplies, and furniture. (Incidentally, that means grocers and retailers are likely to beat estimates on next earnings, while hardware and auto companies are likely to miss them.) Overall, this should be good news for retailers like Revolve and Stitch Fix.
However, not only Stitch Fix and Revolve, but also the whole Internet retail sector is falling today against the S&P 500. That's partly because Internet retail is approaching highs from last May and the previous June-September, and it's partly because Internet retail got overbought against the S&P 500 on its hourly chart.
However, we're still above our moving averages and our MACD signal line. The sector will oscillate downward in the short term, especially amidst overall market weakness, but it should continue to outperform in the medium term. With strong retail data and excellent profitability, I remain confident in companies like Revolve and Stitch Fix.

RVLV testing channel bottomToday looks like a good entry on RVLV, with the price testing the bottom of its parallel channel. RVLV also has a volume support node at 35.27 and is close to oversold on the RSI. We just got an upward stochastic cross as well.
RVLV is undervalued and has bullish analyst ratings.
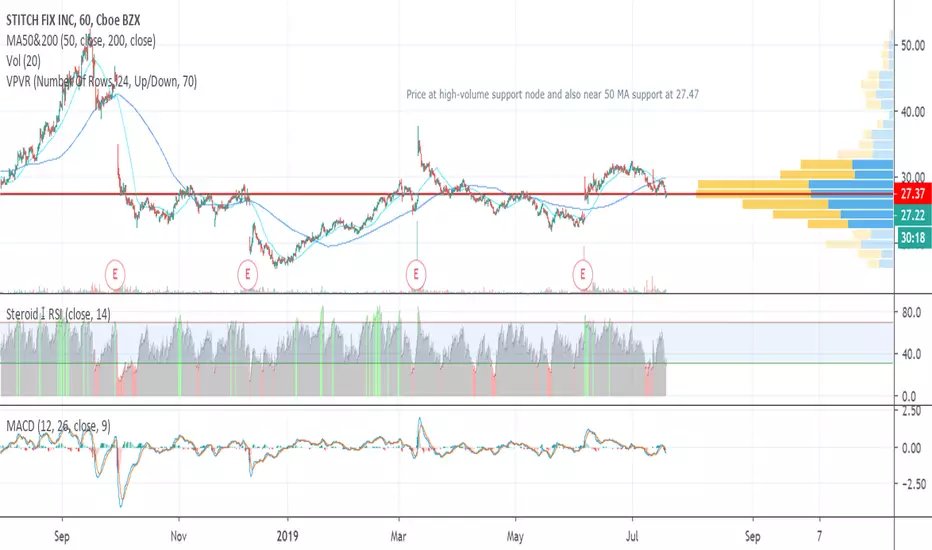
Stitch Fix poised for a turnaroundStitch Fix is at support from a high-volume node on the volume profile and from its 50-day moving average. It also has some RSI support around 38.
The stock just got some big analyst upgrades from Zacks and Goldman, which could serve as upside catalysts. The Internet retail sector is currently outperforming the S&P 500. S&P Capital IQ rates Stitch Fix as undervalued, with stable growth potential. Overall, both fundamentals and market sentiment are looking up for the stock.
However, Stitch Fix has some downward momentum, so it could fall through the 50-day MA before rebounding from 200-day MA support near 26. I don't expect it to fall any further than that, but in the worst-case scenario we could get as low as the high-volume node at 23.

PAYS DAZEmicro cap, high velocity momentum stock
neutral on this, but leaning toward bullish. possible to hit $15-16 profit zone still

Hibbet Sports on solid supportHibbett Sports took a pretty decisive jump after touching its next support level the other day. Hibbett's had a bunch of recent analyst upgrades, and on Friday a single trader bought a huge number of July calls (79K shares) with a price target of 18.65 or better.
Having said all that, Recognia's Elliott Wave analysis of Hibbett suggests it will keep heading downward to 14.92. I don't put a ton of stock in Elliott Wave analysis, but it does seem to have some predictive power.
I may follow the option buyer's trade if I can get a price close to 17.70.

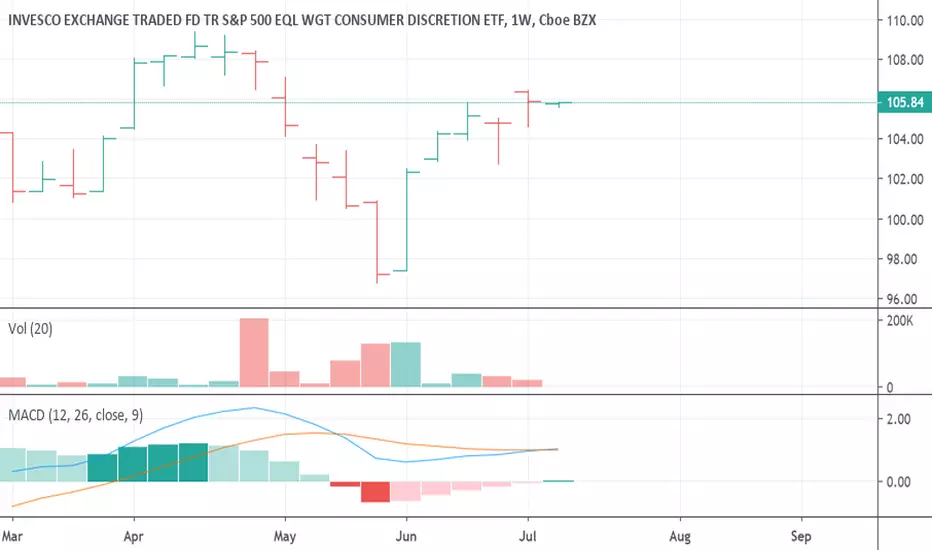
Consumer discretionary MACD cross on weekly chartThe consumer discretionary (i.e. retail) sector has made a bullish MACD cross on its weekly chart. It's also above signal line on the daily chart. This suggests the sector is entering a new medium-term uptrend. Now should be a good time to buy and hold the sector.