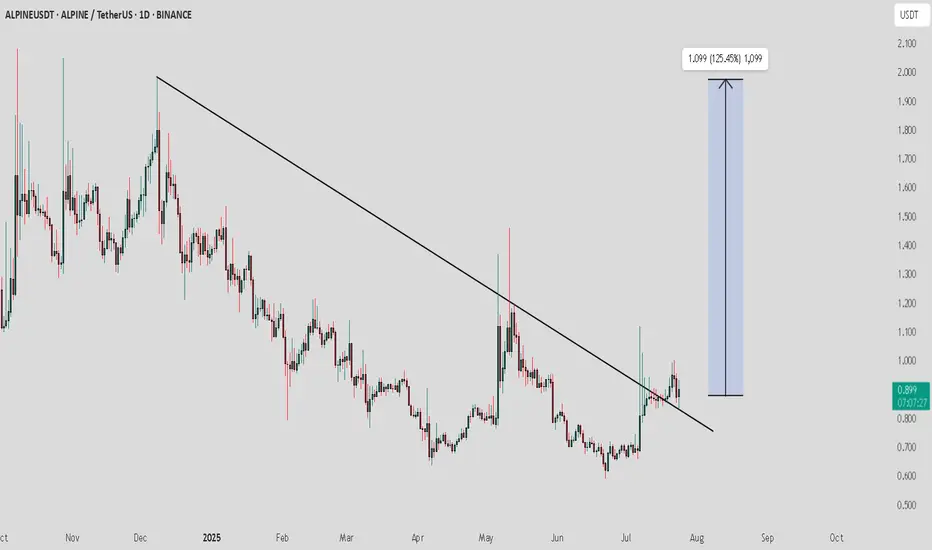
ALPINE / USDT : looking bullish ALPINEUSDT Analysis:
The price is currently retesting the downward trendline. This is a crucial point where the price may either bounce off or fail to hold the trendline, signaling the next major move.
Bullish Scenario:
Trendline Retest and Bounce: If the price holds above the trendline and shows bullish momentum, we could see a rise towards 1.099 (125.45% potential upside).
Confirmation: Look for strong buying volume during the retest to confirm the bounce.
Bearish Scenario:
Trendline Breakdown: If the price fails to hold the trendline and breaks below it, this could trigger a downward move.
Target: Watch for the next support levels to gauge the potential downside.
Retest
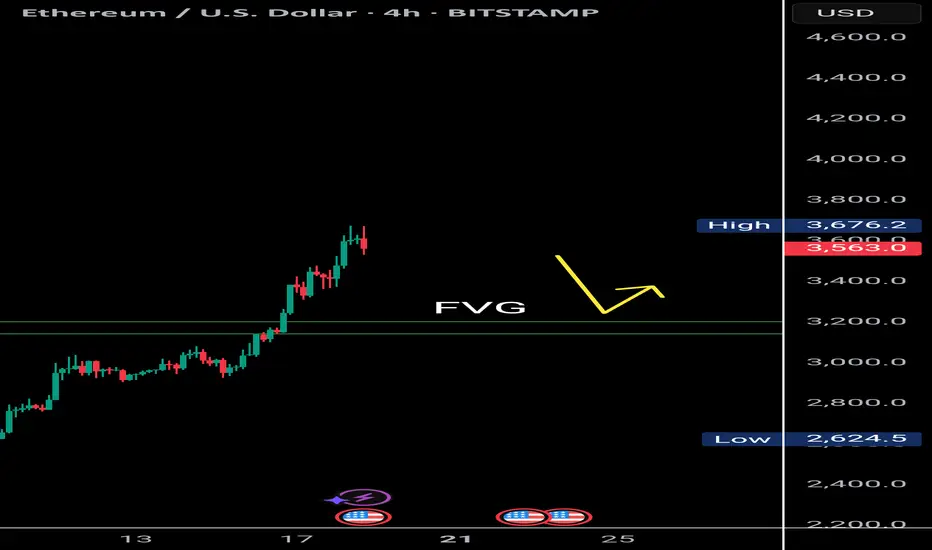
$Eth Faces Double Top Resistance with Bearish RSI DivergenceETH/USDT | 4H Analysis
Ethereum is currently showing signs of weakness on the 4H chart, forming a potential double top pattern around the $3,700-$3,680 range.
Adding to this, the RSI is exhibiting bearish divergence, suggesting that bullish momentum is fading. There's a visible liquidity gap between $3,200–$3,180, which might act as a magnet in the short term. A retest of this zone is likely before ETH attempts to resume its upward move.
Key Observations:
🟠 Double top structure on 4H chart
🔻 Bearish RSI divergence
🕳️ Favorable gap: $3,200 – $3,180
🔁 Watch for price reaction after retest
⚠️ If ETH holds the $3,180 support after filling the gap, a bullish bounce toward higher levels could follow.
📌 This idea is for educational purposes. Trade wisely with proper risk management.
Elecon Engineering: Pre-Breakout Momentum Building!🚀 Elecon Engineering: Pre-Breakout Momentum Building! 🚀
📉 CMP: ₹716
🔒 Stop Loss: ₹652
🎯 Target: ₹952
🔍 Why It Looks Promising?
✅ Rounding Bottom Breakout: Strong breakout above ₹652 with a successful retest.
✅ Fresh Upside Move: Momentum picking up—on track to challenge all-time highs.
💡 Strategy & Risk Management
📈 Staggered Entry: Accumulate gradually near support to manage risk effectively.
🔒 Strict SL: Maintain a disciplined stop loss at ₹652 to protect capital.
📍 Outlook: Elecon is well-positioned for a fresh rally with strong technical structure and volume support.
📉 Disclaimer: Not SEBI-registered. Please conduct your own research or consult a financial advisor before investing.
#EleconEngineering #BreakoutStocks #TechnicalAnalysis #RoundingBottom #SwingTrading #StockMarketIndia #InvestSmart

ARB — 4H Supply Break & Trend Reversal1. Watch for confirmed trendline break
2. Retest & hold above 0.3275 for entry
3. TP1: 0.345–0.35 / TP2: 0.38 / TP3: 0.41
4. If fails, watch demand zones below

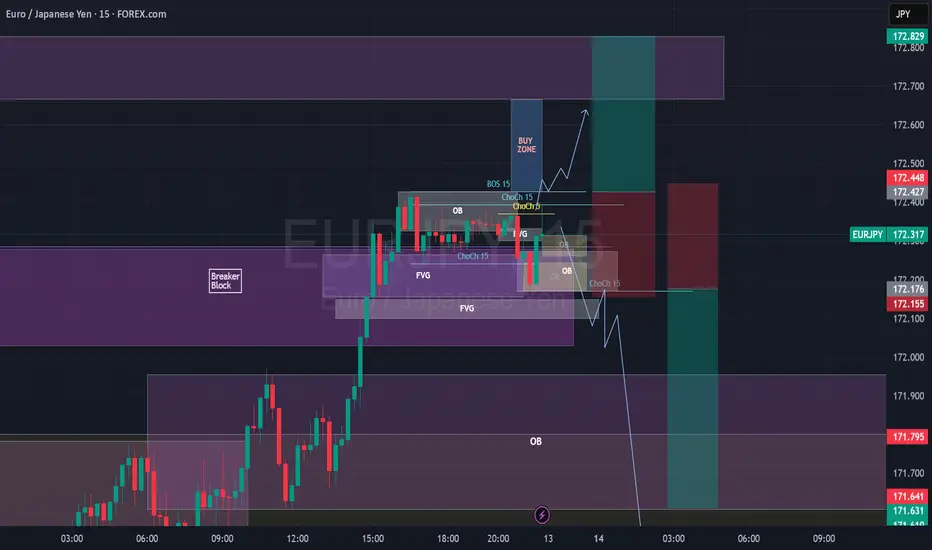
EURJPY Break of Structure, Retest and Fly5m - Monthly timeframes Bullish.
Price body candle closed and retested a 1H BB on 1H Timeframe.
Also retesting a 5M Bullish OB.
I want to wait for price to body candle close above the 15m BoS, create 3m/5m ChoCh, retest and look for Buys towards 172.665 (at the 1H OB or potentially 172.829, top of the 1H OB. SL under the 15m ChoCh.
Wyckoff Structure Targets 92K–94K Retest Before Continuation!A rare and highly instructive market structure is currently unfolding, presenting a textbook case of Wyckoff pattern integration across multiple timeframes.
Over the past weeks, I’ve been tracking a series of smaller Wyckoff accumulation and distribution patterns nested within a larger overarching Wyckoff structure. Each of these smaller formations has now successfully completed its expected move — validating the precision of supply/demand mechanics and the theory’s predictive strength.
With these mini-cycles resolved, the spotlight now shifts to the final, dominant Wyckoff structure — a larger accumulation phase that encompasses the full breadth of recent market activity. According to the logic of Phase C transitioning into Phase D, price appears poised to revisit the key retest zone between 92,000 and 94,000, a critical area of prior resistance turned demand.
📉 Current Market Behavior:
📐 Multiple minor Wyckoff patterns (accumulations/distributions) have played out as expected, both upward and downward — lending high credibility to the current macro setup.
🧩 All formations are nested within a major accumulation structure, now in the final phase of testing support.
🔁 The expected move is a pullback toward the 92K–94K zone, before the markup phase resumes with higher conviction.
📊 Wyckoff Confidence Factors:
✅ All Phase C spring and upthrust actions respected
✅ Volume behavior aligns with Wyckoff principles (climactic action → absorption → trend continuation)
✅ Clean reaccumulation signs within current structure
✅ Institutional footprint visible through shakeouts and well-defined support/resistance rotations
💬 Observation / Call to Action:
This setup is a rare opportunity to witness multi-layered Wyckoff theory in motion, offering not only a high-probability trading setup but also an educational blueprint. I invite fellow traders and Wyckoff analysts to share their interpretations or challenge the current thesis.
➡️ Do you see the same structural roadmap?
Let’s discuss in the comments.

FARTCOIN — Choppy Zone, Support Buy Setup1. Choppy price action likely until sale is done
2. Buy on retest and bounce from 1D support ($0.90)
3. Only long above support, stop below $0.90

What’s EURUSD Telling Us on the 30-Minute Chart?🌅 Good morning, my friends,
EURUSD just made a pullback within the last 30 minutes, so I entered a sell position based on that move.
🎯 Targets:
- TP1: 1.17607
- TP2: 1.17475
- TP3: 1.17174
🛑 Stop Loss: 1.17938
📊 Risk/Reward Ratio: 2.00
Your likes and support are what keep me motivated to share these analyses consistently.
Huge thanks to everyone who shows love and appreciation! 🙏

PEPE/USDT – Falling Wedge Breakout!Hey Traders — if you're into high-conviction setups with real momentum, this one’s for you.
CRYPTOCAP:PEPE has finally broken out from the falling wedge structure on the 4H chart after weeks of consolidation. This is a bullish reversal pattern that historically leads to explosive upside moves.
✅ Breakout Confirmed
✅ Above the 100 EMA
✅ Volume picking up post-breakout
🎯 Targets:
$0.0115/0.0126 / 0.0138 / 0.0147+
🛑 Stop Loss: 0.00975
⚡ Leverage: 5x-10x max (Scalp/Short-term swing)
If momentum sustains, we might see 40%+ move.
Let’s ride the wave. Stay sharp!

DXY Update: Monthly Low Retest on the RadarIn our previous update, we mentioned that our target had been reached and even noted the potential for higher prices. However, we also emphasized the need to wait for fresh signals at that point. After hitting the target, the price faced a sharp drop followed by another sell-off rally.
At the current level, we’re seeing a slowdown in DXY’s selling momentum. However, this alone isn’t sufficient to determine direction. While momentum may be fading, if sellers remain dominant, we’ll see bearish signs on the chart. If buyers regain control, bullish signs will emerge. With this straightforward logic in mind, we’re currently watching for a potential return to the fractal low level at 97.921, which was swept on the monthly chart.
Since it’s monthly close day, sharp intraday pullbacks may occur. As July opens, we believe there’s a possibility of a retracement toward the 97.921 level.
We’ll share any volume-based confirmations in the comments under this post.

USDCAD SHORT IDEA- USDCAD Is EXTREMELY WEAK AND READY FOR SELLOANDA:USDCAD USDCAD Is extremely weak I expect price to drop hard from here.
TRADE BREAKDOWN
Weekly Trend is Bearish.
Daily Trend is Bearish.
4H Trend is also Bearish.
This is 100% a trend following strategy trade.
The entry is taken on 4H time frame targeting the recent weekly swing low.
This is a 4RR Trade.

Trendline Break Retests: The Setup Nobody Talks AboutHello, Traders! 😎
It’s one of crypto's most overlooked yet commonly recurring structures: the trendline break and retest.
You’ve probably seen it without even realizing it. A clean trendline gets broken, price pulls away, and then, quietly, almost politely, comes back to “kiss” the line before taking off again. Or dropping.
That’s the retest. And in the chaotic crypto world, where hype often drowns out structure, this simple behavior deserves more attention.
🔍 First, What Is a Trendline Really?
A crypto trendline connects key highs or lows on a chart, not to predict the future, but to help visualize the mean price trendline: the market's directional bias. In rising markets, we draw support lines connecting higher lows. In falling markets, resistance lines link lower highs.
Learning how to draw trendlines in crypto properly is a skill in itself. Use wicks or closes? Log scale or linear? Everyone has a method, but consistency is key. If you’re unsure, zoom out and let the chart speak first. But once that line is broken, something changes.
🧠 Why Breaks (Alone) Are Not Enough
In theory, a break of the trendline means momentum has shifted. But in practice? Breaks happen all the time in crypto; many are fakeouts or short-lived. That’s where the trendline break and retest come in. It’s the market asking: “Are we done with this trend?”
Retests often create the cleanest entries for trend continuation, not because they guarantee success, but because they offer structure. They provide a technical “moment of truth” when buyers or sellers show their true strength. And if the retest holds? The move that follows tends to be more confident and less noisy.
📐 Trendline Break & Retest: Mapping the Larger Structure
Looking across the full BTC/USDT weekly chart, several major shifts can be framed through the lens of trendline crypto behavior, particularly the classic sequence of break → retest → continuation.
🔻 2021–2022: Macro Breakdown
After the bull run to ~$69K in 2021, Bitcoin started forming a descending series of lower highs, which gave rise to a macro-level downward trendline — a key reference point for many traders at the time.
🔴 Upper Zone: Failed Retest Cluster
The upper horizontal band (~$47K–$52K) highlights a zone where BTC repeatedly attempted to reclaim the broken structure. Each time the price rallied into this region, sellers stepped in, forming local highs and multiple failed retests (marked with red circles). This wasn’t just resistance — it was a battleground where buyers tried to flip the trend… and couldn’t. This behavior often signals a trendline break rejection, where the market tests the underside of prior structure, then resumes the existing trend.
🔴 Lower Zone: Breakdown and Retest That Held
The lower zone (~$28K–$32K) was formerly a strong support area during mid-2021. Once it was broken in early 2022, the price returned to retest from below, failing to reclaim it, confirming it had turned into resistance. This is a textbook example of trendline retest turned supply, and after the failed reclaim, BTC slid further into the ~$16K range.
✂️ Late 2023: The Breakout
In late 2023, BTC finally broke above the descending trendline, confirming a long-term shift in momentum. Importantly, this wasn’t just a clean breakout. The market returned shortly after to retest the broken trendline, around the $42K–46K range, forming a consolidation zone.
🟩 And Then Came the Retest from Above
Let’s fast-forward to early 2024. After months of chop, Bitcoin finally breaks through that upper red zone (the same one that previously acted as resistance and rejection city). But here’s the part many miss:
It didn’t just moon.
It came back.
Look closely at the green zone around ~$46K–$48K, the same area where BTC got rejected multiple times in 2021–2022. And now? Price pulls back, taps that level from above, and holds.
That makes this zone so interesting: 👉 It’s a classic “retest from the other side”, where former resistance becomes support. The market is saying: “This level matters. Let’s make sure it holds before we go further.” It’s a quiet confirmation and a great example of how crypto trendlines and price memory shape behavior, even months or years later.
🪞 It’s Not Just About Lines — It’s About Psychology
Why does this pattern repeat?
Because breakouts are emotional.
They create FOMO. Traders rush in. Then the market pauses, tests your conviction, and shakes out the impatient.
Retests act like a filter.
They flush out the noise — and confirm who’s really in control.
That’s why drawing trendlines in crypto isn’t just about geometry. It’s about crowd behavior. When enough traders see the same line, and price respects it after the break, it becomes a self-fulfilling zone of interest.
🧭 A Word of Caution
This isn’t a secret formula. Not every trendline crypto setup will play out cleanly.
SOME BREAKS NEVER RETEST.
SOME RETESTS FAKE YOU OUT.
AND SOMETIMES, THE LINE YOU DREW ISN’T THE ONE THE MARKET IS ACTUALLY WATCHING.
But if you learn to draw trendlines in crypto clearly, stay patient, and observe the trendline break retest behavior, you’ll begin to see this pattern appear again and again. Quietly. Consistently.
It won’t make the headlines like “BTC Hits 100K,” but it might just tell the story behind that move. This is just one example. In reality, charts are full of these zones. Each one tells a part of the story. And honestly, why not listen?

Bitcoin Dominance Update – Key Levels in Play!Hey Traders!
If you’re finding value in this analysis, smash that 👍 and hit Follow for high-accuracy trade setups that actually deliver!
BTC Dominance is testing a major resistance zone after a sustained rally from late 2024. The structure is showing signs of exhaustion near the 64-65% zone.
🔶 Pattern: Rising wedge breakdown
🔶 Current Action: Retesting broken support zone as resistance
🔶 Key Resistance: 64.5% - 65%
🔶 Rejection zone: Strong supply sitting overhead
Why this matters for Altcoins:
A rejection from this zone could open the door for capital rotation into altcoins.
BTC dominance stalling = potential for ETH, SOL, and midcaps to gain momentum.
If dominance goes down, it may keep altcoin rallies capped for now.
Monitor closely — dominance breakdowns often align with altseason rotations.
💡 Stay patient, stay prepared.

ETH/BTC : Ready to Lead the Altcoin Season?Hey Traders!
If you’re finding value in this analysis, smash that 👍 and hit Follow for high-accuracy trade setups that actually deliver!
Ethereum just broke out of a multi-week symmetrical triangle against Bitcoin — a classic continuation pattern! After consolidating for over a month, this breakout could signal a major shift in market dynamics.
Pattern: Symmetrical Triangle
Measured Move Target: +38.7% from the breakout
Timeframe: 12H
Current Ratio: 0.02517 BTC
🔍 Why ETH/BTC Matters for Altcoins:
When ETH/BTC rises, it often marks the beginning of an altcoin rally. Here's why:
✅ ETH leads altcoins — It’s the largest alt by market cap, and capital often rotates from BTC → ETH → mid/small caps.
✅ Rising ETH/BTC = Bitcoin dominance weakening, giving altcoins room to breathe.
✅ Confidence returns to the broader alt market when ETH outperforms BTC.
If this breakout sustains, we may be entering a strong altcoin season. Keep an eye on ETH strength and look for high-potential setups across the altcoin board!
What are your top altcoin picks for this potential rally? Drop them below 👇

NXPC/USDT: FALLING WEDGE BREAKOUT ALERT!!NXPC Breakout Alert – 100%+ Potential on the Table
Hey Traders — if you're into high-conviction setups with real momentum, this one’s for you.
NXPC has broken out of a falling wedge pattern on the 4H timeframe and is now retesting the breakout zone. As long as it holds above the green support box, a strong upside move remains likely.
Entry Range: $1.38 – $1.44
Targets: $1.70 / $2.30 / $2.70 / $3.10
Stop-loss: $1.26
Leverage: Use low leverage (Max 5x)
This setup has the potential to kick off a powerful rally.
Keep it on your radar and trade with discipline.
Let me know if you're in this one or watching from the sidelines.

DEXE/USDT: FALLING WEDGE BREAKOUT!!DEXE Breakout Alert – 80% Move Loading?
Hey Traders! If you're into high-conviction plays and real alpha — hit that like and tap Follow for trade setups that actually deliver.
DEXE has broken out of a falling wedge pattern on the daily timeframe and has successfully retested the breakout level. The structure looks strong, and momentum is starting to build.
Entry Zone: $13.4 – $14.4
Targets: $16.1 / $18.2 / $21.2 / $24.4
Stop-loss: $12.60
Leverage: Use low leverage (Max 5x)
This could be the beginning of a powerful upward move.
Keep this setup on your radar and manage risk accordingly.
Let me know your thoughts or if you're riding this one too.

USDCAD Makes Retest At 200 EMA After Bull Trap BreakoutOANDA:USDCAD here on the 1Hr Chart has printed an Ascending Channel and Bears have made a Breakout!
Price currently looks to be on its way to retesting the Breakout of the Channel with the 200 EMA and Upper Bollinger Bands sitting at the Rising Support adding some heavy Bearish Pressure.
Fundamentally, BOC will be releasing GDP m/m ( Gross Domestic Product ) numbers tomorrow morning at 0730 AM CST with analysts forecasting a .3% Increase at .1% with Previous being -0.2%.

SIGN/USDT – Bullish Breakout Alert!🚀 SIGN Breakout Alert – 80% Potential Incoming?! 👀🔥
Hey Traders! If you're all about high-conviction plays and real alpha, smash that 👍 and tap Follow for more setups that actually deliver! 💹💯
SIGN has just broken out from a symmetrical triangle after consolidating tightly for weeks. The breakout is supported by strong volume and a solid bounce from the base of the structure.
Entry: $0.082 - $0.085 (post-breakout zone)
Targets:
• $0.095
• $0.112
• $0.134
• $0.159
Stop-loss: Below $0.076
Risk-Reward: Over 6:1 — Excellent setup for trend traders.
This move could mark the beginning of a strong upside wave. Keep it on your radar and manage your risk accordingly!
Let me know your thoughts or if you're riding this one too!

GUN/USDT: FALLING WEDGE BREAKOUT ALERT!!🚀 GUN Falling Wedge Breakout – 35%+ Potential Incoming?! 👀🔥
Hey Traders! If you're all about high-conviction plays and real alpha, smash that 👍 and tap Follow for more setups that actually deliver! 💹💯
GUN has officially broken out of the falling wedge structure on the 2H timeframe — a classic bullish reversal pattern. 🚨
Right now, it's retesting the breakout zone, which is a key confirmation step before the next leg up. If this retest holds, we could see a strong continuation move soon.
📊 Technical Setup:
✅ Falling wedge breakout
🔄 Retesting resistance as new support
🎯 Targets:
TP1: $0.053
TP2: $0.057
TP3: $0.061
TP4: $0.067
🛑 Stop-Loss: Below $0.046
⚙️ Leverage: 5x–10x (use proper risk management)
This is the make-or-break moment — if the retest holds, GUN could fire off big. Stay sharp.

BTC DOMINANCE AT CRUCIAL LEVEL! When Alt season? 🚀 Hey Traders! 👋
If you’re finding value in this analysis, smash that 👍 and hit Follow for high-accuracy trade setups that actually deliver! 💹🔥
Bitcoin dominance is once again hovering around the key resistance zone (~64%) that previously triggered a sharp rejection and boosted altcoins. 🚨
🟢 What we're watching:
Dominance bounced back after a breakdown from the rising wedge 📉
It's now retesting the breakdown zone (red resistance)
A rejection here = Altcoin Rally 🎯
A clean breakout above = Altcoins stay weak ⚠️
⏳ We’re at a decision point. Altcoin bulls are watching this zone very closely.
🧠 Our take:
Until BTC.D rejects from this level, don’t expect a full-blown Altseason. A strong red candle from here could open the floodgates for mid and low caps to run wild again. 🚀
📌 Stay patient, stay positioned. The move will be big—just a matter of “when.”

NFP ANALYSIS🚀#NFP Analysis : Pattern Formation💲💲
🔮As we can see in the chart of #NFP that there is a formation inverse head and shoulder pattern and it's a bullish pattern. Also there is a perfect breakout and retest of the levels. This indicates a potential bullish move.📈📈
🔰Current Price: $0.0910
🎯 Target Price: $0.1100
⚡️What to do ?
👀Keep an eye on #NFP price action. We can trade according to the chart and make some profits. The price must close above the neckline. After that we will see a bullish move. ⚡️⚡️
#NFP #Cryptocurrency #TechnicalAnalysis #DYOR

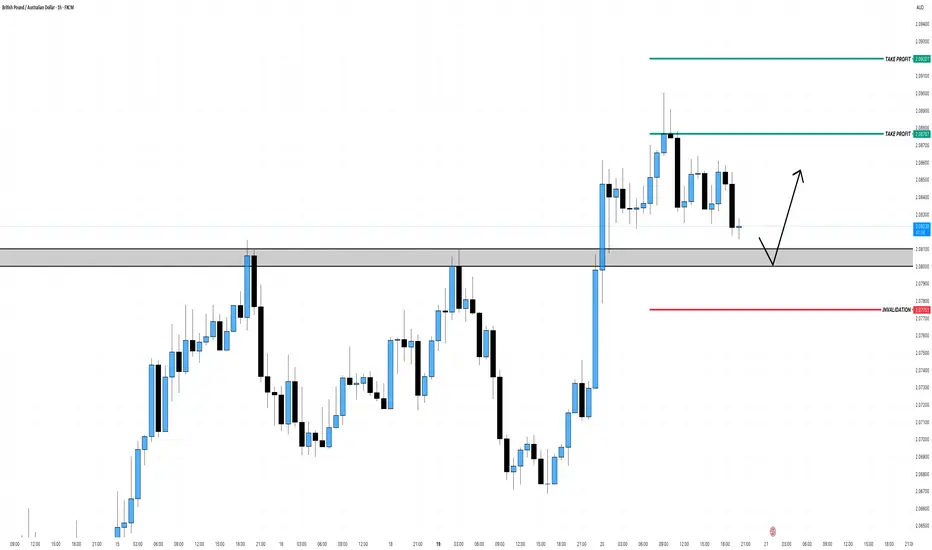
GBPAUD Bullish Break and RetestAfter weeks of consolidation, GBPAUD has broken out above key resistance at 2.0800–2.0830, flipping structure to bullish on the higher timeframes. Price is now retesting this zone.
Wait for bullish confirmation.
AUDJPY Retest Watch for 95AUDJPY has successfully broken out of a long-standing descending trendline on the daily timeframe, signaling a potential trend reversal after a prolonged bearish phase. This breakout was followed by a classic retest, where price pulled back to validate the previous resistance line now acting as new support.
Key Technical Observations:
The trendline, connecting multiple swing highs since late 2023, has been clearly violated to the upside.
A minor consolidation followed the breakout, which now appears to be testing the broken trendline.
The pair is forming higher lows, suggesting bullish intent and buyer interest on the retest.
Bullish Scenario:
Entry Zone: Around 92.00–92.50, during or after the retest confirmation.
Target 1: 95.00 (previous swing high)
Target 2: 96.68 (Fibonacci extension and prior horizontal resistance)
Target 3: 101.37 (major resistance from late 2023)
Stop Loss: Below 91.20 or under the retest low (safe zone: around 90.80).
Alternative (Bearish) Scenario:
If the price fails to hold above the broken trendline and closes below 91.00, the breakout could be a false move.
In that case, downside pressure may push the price back toward 88.14 support.
Technical Context:
This setup is based on trendline breakout and retest, where a break and successful retest of a long-term descending trendline often leads to a bullish continuation. In essence, the structure of the chart reflects a potential trend reversal.
