USOIL Is it the Upward END? 28.09.2023Currently Crude Oil has experienced a surprising upward movement, a reversal actually that could potentially give rise to a retracement opportunity.
The 93.75 resistance could serve as the end of the shock upwards and soon a retracement could follow, near to the level 92 USD/b.
__________________________
Information Regarding Important News and Figures can be found here in our Economic Calendar: mau.bdswiss.com/economic-calenda...
Risk Warning: Trading in CFDs is highly speculative and carries a high level of risk. It is possible to lose all of your invested capital. These products may not be suitable for everyone, and you should ensure that you fully understand the risks taking into consideration your investment objectives, level of experience, personal circumstances as well as personal resources. Speculate only with funds that you can afford to lose. Seek independent advice if necessary. Please refer to our Risk Disclosure.
BDSwiss is a trading name of BDS Markets and BDS Ltd.
BDS Markets is a company incorporated under the laws of the Republic of Mauritius and is authorized and regulated by the Financial Services Commission of Mauritius ( FSC ) under license number C116016172, address: 6th Floor, Tower 1, Nexteracom Building 72201 Ebene.
BDS Ltd is authorized and regulated by the Financial Services Authority Seychelles (FSA) under license number SD047, address: Tenancy 10, Marina House, Eden Island, Mahe. Payment transactions are managed by BDS Markets (Registration number: 143350).
Retracement

Unlocking the Next Bull CycleBitcoin's journey is often marked by key technical levels, and its monthly chart has a fascinating story to tell. The 0.5 Fibonacci retracement level from the All-Time High (ATH) has historically acted as a formidable resistance. Today, we find ourselves at a crucial juncture, echoing the past. To embark on a new bullish cycle, we need to conquer the 50K milestone.
Historical Significance of the 0.5 Fibonacci Level:
The 0.5 Fibonacci retracement level is a significant technical marker on the monthly Bitcoin chart.
It represents a retracement halfway from the ATH to a significant low, signifying a pivotal point in the asset's price history.
Historically, this level has posed a challenge for Bitcoin bulls, often requiring considerable momentum to breach.
The 50K Milestone:
As we observe the current market dynamics, it's evident that we're in a situation reminiscent of the past.
The 50K level is not just a psychological barrier; it's also in alignment with the 0.5 Fibonacci retracement.
Breaking above 50K could signify a new era for Bitcoin, potentially initiating a fresh bullish cycle.
What to Watch For:
Monitor Bitcoin's price action closely as it approaches the 50K level.
Look for signs of strong buying pressure, increased trading volumes, and positive sentiment in the crypto community.
Be aware of potential retracements or false breakouts; these are common in the crypto market.
The Bigger Picture:
While breaching 50K is a significant milestone, it doesn't guarantee an immediate and sustained bull run.
Consider the broader market context, macroeconomic factors, and institutional involvement in your analysis.
Diversify your trading strategy and have risk management measures in place.
Conclusion:
The 0.5 Fibonacci retracement level has historically held the monthly Bitcoin chart in check. Now, as we approach the 50K level, we stand on the precipice of a potential new bullish cycle. However, history reminds us that we must tread cautiously and stay vigilant.
Breaking through 50K could usher in a wave of optimism, but it's essential to be prepared for various market scenarios. Keep a close eye on the charts, follow market sentiment, and, most importantly, manage your risks wisely.
The crypto market is full of opportunities and challenges. It's a thrilling journey, and every milestone reached is a testament to Bitcoin's resilience and potential for growth. 🌟📊🧐

Reaction of Sunrun's against institutional traders
Executive Summary:
In Tuseday's market session, we observed a 5% increase in the price action of NASDAQ:RUN , which, as expected, triggered a minor retracement due to typical market dynamics. However, our focus today is on a highly significant order block zone, spanning from $14.13 to $14.90. After nearly a year of dedicated study into the behaviors of major institutional players in the market, we've uncovered a crucial aspect of their approach.
Understanding Institutional Strategies:
Institutional investors, in their quest to enter positions, follow a dual-pronged strategy. First, they aim to create adequate liquidity in the market to facilitate their trades. Second, they seek to initiate positions at the lowest possible prices, effectively maximizing their profit margins. It's important to note that their entry points often differ from those favored by retail traders, and herein lies the intriguing element of market dynamics.
Manipulating Retail Sentiment:
Institutional investors sometimes choose to exert selling pressure when the market approaches what appears to be a demand zone, a strategy designed to trigger stop losses placed by retail traders. This calculated move creates a cascade effect, further driving prices downward. As retail traders' stop losses are hit, the market sentiment shifts. What once seemed like a strong demand zone now appears fragile, causing retail participants to rethink their positions.
Conclusion and outlook
As we anticipate a continued retracement in the price action towards the demand zone, it becomes essential to employ a meticulous approach to risk management. Our objective is not only to align with institutional entry points but also to safeguard our positions against potential market volatility.
The Importance of Stop Loss Calculation:
In this endeavor, precise calculation of our stop loss assumes paramount significance. By leveraging historical market volatility data and average candle size, as represented by the Average True Range (ATR), we aim to strike an optimal balance between risk and reward.
Maximizing Position Security:
The crux of this methodology lies in maximizing the probability of maintaining open positions while positioning ourselves to capitalize on the forthcoming momentum instigated by institutional players.
Defining the Stop Loss:
For an entry price of $14.015, which closely aligns with the average demand zone valuation, we have determined that setting the stop loss at $13.77 provides an effective risk management strategy. This strategic adjustment substantially reduces the likelihood of liquidation in the face of adverse price movements.
Conclusion:
Incorporating these refined risk management techniques into our trading approach empowers us to align with institutional strategies while mitigating potential downside risks. As we move forward, we are well-equipped to not only participate in the anticipated upward momentum initiated by institutional entries but also to secure our positions, ensuring our trading endeavors remain both profitable and resilient.

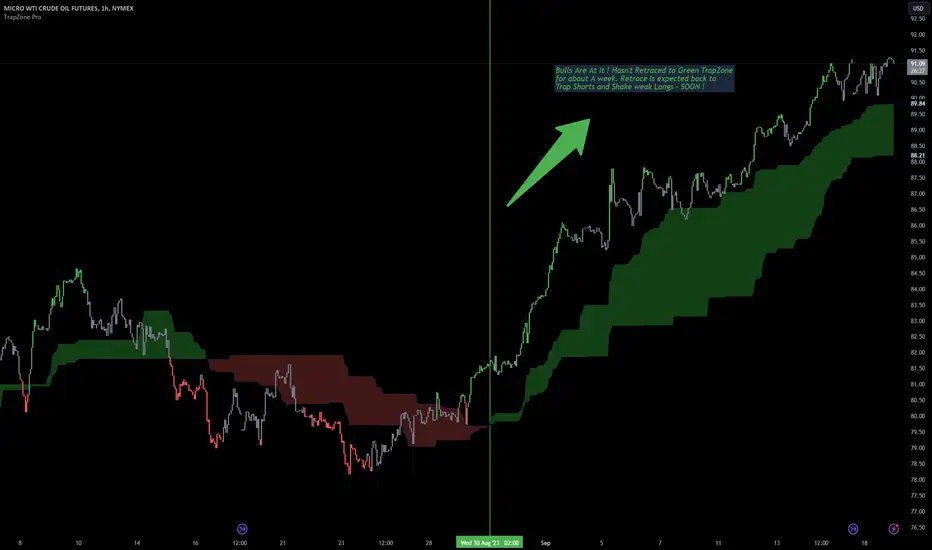
No retrace to the TrapZone ? How long is this LONG move?Bulls Are At It, Offcourse. When do you take Profits though ? Trap Bars are forming Now.
price Hasn't Retraced to Green TrapZone for about A week. Retrace Is expected back to Trap Shorts and Shake weak Longs - SOON !
Hourly Candlestick Chart of MCL/ Crude Futures with TrapZone Pro
EURUSD IDEASo the next trade i will took if it goes as planned is short on eurusd,as we see price is touching 0.5 fib retracment,i always put fib on a daily tf.Overall trend is bearish.
Wait for some kind of a confirmation to enter a short position like a bearish eng,or a pinbar to see that bears are serious about pushing the price down.Happy trading everyone!
entry around 1.06820
sl-1.07040
tp-1.05300

Bitcoin's Recent Battle with Fibbonaci🛡️Hey there, crypto enthusiasts! Let's take a closer look at the recent Bitcoin pump that didn't quite take off as expected. It turns out, we encountered a significant resistance level at the 0.5 Fibonacci retracement on the Fibonacci retracement tool. 📊💡
🌐 The Fibonacci Fascination: Before we delve into the recent action, let's touch on the golden tool of technical analysis – the Fibonacci retracement. It's a tool that helps traders identify potential support and resistance levels on a chart based on the Fibonacci sequence.
💰 The Golden Ratio: In this case, we're talking about the golden Fibonacci retracement, the 0.5 level. This level is often seen as a crucial point on the chart. When an asset like Bitcoin retraces to this level, it can act as either strong support or resistance.
📈 The Recent Pump: Bitcoin recently experienced a significant price pump, and many were hopeful that it might lead to a substantial rally. However, the price action encountered resistance right around the 0.5 Fibonacci retracement level.
🛡️ The Battle at 0.5: This level represents a critical point where traders and algorithms make decisions. It can be a make-or-break point for a potential bullish run.
📊 Fibonacci in Action: To use Fibonacci retracement, simply select the tool on your trading platform, and then click on a significant swing low and drag to a swing high. The tool will automatically plot the retracement levels, including the golden 0.5 Fibonacci retracement level.
📚 Fibonacci Tips: When using Fibonacci retracement, keep these tips in mind:
Look for confluence with other technical indicators.
Consider it a tool in your trading toolbox, not a standalone strategy.
Combine it with your overall trading plan and risk management.
Remember, while Fibonacci retracement is a powerful tool, it's not foolproof, and market dynamics can change rapidly. Stay informed, stay adaptable, and keep honing your trading skills. 🔄📈

Shopify Short term Sell Target Off Major Support BounceHI guys, ive been following Shopify (SHOP), since its test of some important SUPPORT. This is a quick update from my previous idea. (Which you can find down below for more context)
We've currently bounced extremely bullish off the SUPPORT level, heading towards a SUpport turned Resistance line associated with the UPTREND channel i identified.
Normally when we break down or break above trend lines, that we have respected for some time. We tend to retrace back to that same line to Re-Test it.
Such is the case for Shopify.
Watch the Volume, an INCREASE/ SPIKE in Volume is absolutely needed to get back ABOVE, resuming our UPTREND.
But due note: we are heading into Labor day weekend, thus RISK of LOW VOLUME.
I would then consider if you were able to take positions from the SUPPORT level bounce
To think about off loading some of your position here.
If we do get back into the UPTREND channel from my previous POST. We can look to take new positions if SUPPORT is CONFIRMED.
__________________________________________________________________________________
Thank you for taking the time to read my analysis. Hope it helped keep you informed. Please do support my ideas by boosting, following me and commenting. Thanks again.
Stay tuned for more updates on SHOP in the near future.
If you have any questions, do reach out. Thank you again.
DISCLAIMER: This is not financial advice, i am not a financial advisor. The thoughts expressed in the posts are my opinion and for educational purposes. Do not use my ideas for the basis of your trading strategy, make sure to work out your own strategy and when trading always spend majority of your time on risk management strategy

🔥 Are the Bulls Losing? Decoding Bitcoin's Recent Market TwistAfter the initial dump around the 17th, I made an analysis on BTC where I discussed the fact that this token was the most oversold on the daily RSI since the COVID dump. My short-term expectation was more edged towards the bullish side than towards the bearish.
My target area for the bounce lied between the 0.382 and 0.618 Fibonacci retracements. This area is often an area of strong resistance and will nearly always signal a continuation of the trend if it can hold.
To make things worse for the bulls, the 200-week average lies around 27.500. This moving average is historically the most important moving average. Given the fact that a lot of traders will look at this indicator makes it worthwhile to look at it as well.
I'm not convinced that the bulls will push through. With the ETF not even being approved yet it's essentially "news before the news". Sure, it's good news, but is it enough to start a long-term trend reversal?
Like mentioned before, I'm not convinced yet. If BTC can close the day above the 0.618 Fibonacci retracement (~28.300), I will switch my short-term bias to bullish. If not, we're still in bearish territory.

BTCUSDT SHORT SCALPQuick-quick, make a take me!
Watch this clip and the PEPESUDT SHORT video and it'll be perfectly clear. Especially when it does exactly what I'm suggesting.

SCALP ME SOME PEPE! SHORT PEPEUSDTFrom current position down to ~$0.000008600.
Watch the video for more details and some close-up shots showing the weird places I managed to get a sun burn over the weekend.
Enjoy.

NZDUSDNZDUSD was trading descending channel and recently bulls took the charge and has given the breakout from descending channel. Currently the price is retracing and creating the support around 0.5950 region.
Will the bulls take charge again continue for leg higher ?

GNS Consolidated and Resting from Big Move LONGOn the 30-minute chart, I see GNS as a Bullish Pennant on a high flag pole
in the big move yesterday with consolidation now. It is high in the VWAP
bands and so at risk for a reversal to the mean. Pennants more often than not continue
upside. To hedge, I have set two lines. If the price goes over the green line a
buy stop long will trigger into a market price. If the price drops below the pennant
height, a sell stop will trigger the short trade. One trade is on the other will not execute.
Ask if you want my suggestion as to stop losses and targets.
(EDIT - On the chart it is a flagpole not a flap pole !)

US30 - 21 to 25 July 2023 Hola !
Last week Friday we hit the sellside liquidity = 33+ day lows taken out
Anticipating a stronger correction before we go lower.. i will however be watching that sellzone carefully just to catch a few ticks
Remember always to follow your rules !
Cheers

NAS100 2nd Attempt 25.08.2023The market crashed intraday yesterday reversing more than 100% of the recent total rapid movement upwards.
The index found support and since its Friday we do not expect much volatility or further high activity in the market. However, some retracement has to take place for correction.
Let's see. Back to 61.8% of the movement perhaps.
__________________________
Information Regarding Important News and Figures can be found here in our Economic Calendar: mau.bdswiss.com/economic-calenda...
Risk Warning: Trading in CFDs is highly speculative and carries a high level of risk. It is possible to lose all of your invested capital. These products may not be suitable for everyone, and you should ensure that you fully understand the risks taking into consideration your investment objectives, level of experience, personal circumstances as well as personal resources. Speculate only with funds that you can afford to lose. Seek independent advice if necessary. Please refer to our Risk Disclosure.
BDSwiss is a trading name of BDS Markets and BDS Ltd.
BDS Markets is a company incorporated under the laws of the Republic of Mauritius and is authorized and regulated by the Financial Services Commission of Mauritius ( FSC ) under license number C116016172, address: 6th Floor, Tower 1, Nexteracom Building 72201 Ebene.
BDS Ltd is authorized and regulated by the Financial Services Authority Seychelles (FSA) under license number SD047, address: Tenancy 10, Marina House, Eden Island, Mahe. Payment transactions are managed by BDS Markets (Registration number: 143350).

NAS100 Mean Return 24.08.2023Possible NAS100 retracement today. The news at 15:30 will have an impact on the dollar and more volatility on indices is expected after 16:30. The opening could cause the index to drop if the 15300 level breaks.
__________________________
Information Regarding Important News and Figures can be found here in our Economic Calendar: mau.bdswiss.com/economic-calenda...
Risk Warning: Trading in CFDs is highly speculative and carries a high level of risk. It is possible to lose all of your invested capital. These products may not be suitable for everyone, and you should ensure that you fully understand the risks taking into consideration your investment objectives, level of experience, personal circumstances as well as personal resources. Speculate only with funds that you can afford to lose. Seek independent advice if necessary. Please refer to our Risk Disclosure.
BDSwiss is a trading name of BDS Markets and BDS Ltd.
BDS Markets is a company incorporated under the laws of the Republic of Mauritius and is authorized and regulated by the Financial Services Commission of Mauritius ( FSC ) under license number C116016172, address: 6th Floor, Tower 1, Nexteracom Building 72201 Ebene.
BDS Ltd is authorized and regulated by the Financial Services Authority Seychelles (FSA) under license number SD047, address: Tenancy 10, Marina House, Eden Island, Mahe. Payment transactions are managed by BDS Markets (Registration number: 143350).

XAUUSD Retracement? 23.08.2023Gold was following a downward trend recently.
It later showed signs of retracement and just broken resistance that might push it upwards.
__________________________
Information Regarding Important News and Figures can be found here in our Economic Calendar: mau.bdswiss.com/economic-calenda...
Risk Warning: Trading in CFDs is highly speculative and carries a high level of risk. It is possible to lose all of your invested capital. These products may not be suitable for everyone, and you should ensure that you fully understand the risks taking into consideration your investment objectives, level of experience, personal circumstances as well as personal resources. Speculate only with funds that you can afford to lose. Seek independent advice if necessary. Please refer to our Risk Disclosure.
BDSwiss is a trading name of BDS Markets and BDS Ltd.
BDS Markets is a company incorporated under the laws of the Republic of Mauritius and is authorized and regulated by the Financial Services Commission of Mauritius ( FSC ) under license number C116016172, address: 6th Floor, Tower 1, Nexteracom Building 72201 Ebene.
BDS Ltd is authorized and regulated by the Financial Services Authority Seychelles (FSA) under license number SD047, address: Tenancy 10, Marina House, Eden Island, Mahe. Payment transactions are managed by BDS Markets (Registration number: 143350).

EURUSD Dive Over? 23.08.2023The PMIs were devastating again for Eurozone.
The EURUSD dropped heavily during the day. Possibly the downward movement is finally over.
A retracement is expected back to the 61.8% of the movement.
__________________________
Information Regarding Important News and Figures can be found here in our Economic Calendar: mau.bdswiss.com/economic-calenda...
Risk Warning: Trading in CFDs is highly speculative and carries a high level of risk. It is possible to lose all of your invested capital. These products may not be suitable for everyone, and you should ensure that you fully understand the risks taking into consideration your investment objectives, level of experience, personal circumstances as well as personal resources. Speculate only with funds that you can afford to lose. Seek independent advice if necessary. Please refer to our Risk Disclosure.
BDSwiss is a trading name of BDS Markets and BDS Ltd.
BDS Markets is a company incorporated under the laws of the Republic of Mauritius and is authorized and regulated by the Financial Services Commission of Mauritius ( FSC ) under license number C116016172, address: 6th Floor, Tower 1, Nexteracom Building 72201 Ebene.
BDS Ltd is authorized and regulated by the Financial Services Authority Seychelles (FSA) under license number SD047, address: Tenancy 10, Marina House, Eden Island, Mahe. Payment transactions are managed by BDS Markets (Registration number: 143350).

USDCHF: Just short-term traders should trade it! Regarding our observations, currently there are absolutely more buyers in the market.
After breaking 0.8850 there is good place to long the pair.
Breaking ascending the trend-line down and retrace to top of the bearish channel make good chance for a short trade.
breaking down 0.8742 could be anoother opportunity for shorting the pair.

UNFIUSDTAfter the recent bullish move , now UNFIUSDT is break through inclining trendline and support area as well and it looks like UNFI is ready for big selloff.
Currently the price is retracing a bit and if it get rejection from 4.10 area, will be nice for sellers to attack.

TSLA Approaches Major Resistance and May Stall into July 21Primary Chart: TSLA on Weekly Time Frame with a Downtrend Line from the All-Time High and Fibonacci and Measured-Move Levels
Preliminary Comments
TSLA is poised to stall soon, perhaps into July 21. By definition, a stall does not necessitate a crash or major trend reversal (at the primary degree of trend). A major reversal downward (crash) is always possible especially once shorts have been decimated—major downward reversals seem to always wait for clearing out of hedging and shorts, right?
Although a major trend reversal could occur here given major resistance levels just overhead on higher time frames, no one has a crystal ball. Finding the time and price components of such a major reversal can be exceedingly difficult (note the conclusion section of this article about probabilities).
And no one who were to have a crystal ball that worked properly would share it. And a securities regulator would be sniffing around for insider trading for sure with too many trades lining up too perfectly especially before major news catalysts. Humor aside, trying to be too clever by calling the exact top is a misplaced endeavor. But it can be prudent to analyze the charts and consider the idea of vulnerability for a trend’s continuation in the short-to-intermediate term, i.e., whether the move might encounter major resistance that could at a minimum cause a mean reversion or retracement of the recent rally .
Trend Analysis
The charts don’t lie. TSLA’s intermediate-term trend since January 6, 2023 remains upward. Similarly, short-term (2-6 weeks) and intraday trends remain upward. But the primary trend is still arguably sideways when considered over a 2-3 year period, while the secular trend since 2010 arguably still remains firmly upward.
1. Secular trend (since 2010): uptrend
2. Primary trend (since 2020/2021): sideways trend (range)
3. Intermediate / secondary trend (since early 2023): uptrend
4. short-term trend: uptrend near crucial resistance
5. intraday trends: uptrend near crucial resistance
Supplementary Chart A: Primary Trend
Supplementary Chart B: Secular Trend
The intermediate term trend has run fast and furious for 1H 2023 (since the Jan. 6, 2023 low). That alone is not enough to expect a reversal. Shorting something merely because it seems to have risen too far is a well-known trading mistake comparable to catching a falling knife in a downtrend. Shorting powerful uptrends is not an easy way to make a living.
But several charts suggest vulnerability for TSLA’s rally at this level. This comes right as earning will be reported this week along with a major monthly options expiration on July 21. Earnings reports like TSLA's upcoming one present a binary risk event that could stretch prices significantly in either direction, or it could a whipsaw price in both directions before settling on a final directional move (see the section below titled “Trend vs. Fundamentals.”)
Supplementary Chart C shows that TSLA’s price is nearing a crucial Fibonacci level on a linear chart. This is the 61.8% Fibonacci retracement ($299.05) of its entire decline from its all-time high into the early January 2023 low. Coincidentally, this level shows confluence with other important resistance levels shown on the chart such as the down trendline from the all-time high. (Some prefer Fibonacci levels adjusted for a logarithmic chart, which is not shown. The next relevant upside Fibonacci level on a log chart, however, is the .786 of the entire decline at $306, which is not far from the .618 level at 295.05.
Supplementary Chart C
If the .618 Fibonacci retracement is overcome and held (not just a false breakout), this suggests prices may run higher to at least $314.67 or the next higher Fibonacci level at $347. But these are upside levels conditioned solely on the .618 retracement being overcome and held.
Next, consider the down trendline from TSLA's all-time high. This is being approached at around $300, right were significant call OI exists. Trendlines can be somewhat rigid measures of trend, but they can provide some value especially when other support / resistance levels coincide with the trendline. The down trendline from TSLA's all-time high runs right into the measured-move zone, shown by the blue circle on Supplementary Chart D.1.
Supplementary Chart D.1
Some traders prefer to look only at logarithmic charts, though here it doesn't add much to the technical picture since the trendline is quite close to where it lies on the linear chart.
Supplementary Chart D.2
Finally, some bearish divergences in momentum and price/volume indicators suggest that price has become quite stretched right at a time when TSLA has reached some major resistance levels. Supplementary Chart E shows the Elder Force Index (EFI), a useful indicator that displays a combination of volume and price, weighing the extent of each price change along with the extent of volume. It tends to pick up divergences in the "force" or commitment behind a move with more sensitivity than RSI or other common momentum indicators, but with increased sensitivity often comes more noise (more false signals) which can be helped to some extent through indicator adjustment. Nevertheless, here is what that indicator shows for TSLA on the daily timeframe:
Supplementary Chart E
As TSLA has made higher highs, it has done so with less force and commitment for each high, creating a divergence between higher price highs and lower EFI highs. TSLA may make a new YTD high this week, and if so, it will be important to see where the EFI high prints for that new high. Given how low EFI is currently, it would take a lot of volume and price change to move the high to exceed the prior EFIs (erasing the divergence). In SquishTrade's view, EFI is unlikely to erase both the June EFI high and the January EFI high even if TSLA runs to $300-$320 post earnings.
Supplementary Chart F shows RSI and ROC, two common momentum indicators which most readers understand well. ROC shows a series of three highs that each make a successively lower high while price made higher highs at the same time: January 2023, June 2023, and July 2023. RSI only shows a series of two highs where price made a higher high and RSI made a lower high.
Supplementary Chart F
Downside Targets
TSLA's price seems poised to pullback / retrace at a minimum. But referring to downside targets may seem a bit premature as price hasn't confirmed even a short-term reversal or the start of a retracement / consolidation within the intermediate trend yet. The technical conditions for a retracement are present, so if confirmation lower does occur in the next week or so, price can fall to trend support, however one decides to measure that within one's trading system.
Based on persistently and deeply inverted yield curves, many astute market players may be looking for more than just a retracement or consolidation within the intermediate uptrend. They want more than mean reversion, and that is understandable. Should TSLA followers expect that now? Today, July 15, 2023, confidence cannot exist about an impending trend reversal on higher time frames. Why? A major reversal where price retests / breaks January 2023 lows will likely coincide with recessionary economic data (e.g., rising UE rates), drastically changing EPS estimates based on disappointing earnings reports, and/or unexpectedly high interest rates across the curve because of sticky inflation won't budge further downward (the recent CPI print came in at 3% for headline but 4.8% for core for June 2023). Note: Fundamentals are discussed in greater depth in the next section below. But economic data has continued to come in better than expected. Recent real GDP print for Q1 2023 was recently raised to 2% and labor markets remain persistently tight as the Fed even has noted in its recent pressers. Inflation has cooled for June but this may result from basing effects.
Most importantly, trend structure on the weekly and daily time frames (intermediate and short-term) has not been broken. Until the intermediate trend structure is decisively broken, forecasting a major top / trend reversal is rash and unfounded from a technical viewpoint. This intermediate-term trend structure is the up trendline from January 2023 lows or some other more dynamic or flexible measures of trend.
So with the idea that price can run a bit higher before any retracement—since we haven't yet seen a confirmation lower yet—these downside targets remain conditioned on a short-term trend reversal. For now, the targets also must be considered corrective retracements / mean-reversion targets within the context of the current trend until the evidence proves otherwise.
Conservative Target: $245-$250
Moderate Target: $232-$238
Aggressive Target: $199-$218
Trends vs. Fundamentals
A purely technical analyst or technically oriented trend trader tends to consider only the trend and technical evidence supporting that objective. At critical junctures after retracements / corrective moves, this means favoring trend continuation rather than a reversal until the evidence says otherwise. And pure trend following means seeing the odds as favoring mean reversion when a trend gets too extended or stretched rather than reversal.
Ambiguity as to trend on varying time frames often confounds the discussion of trends. This is why it's important to remain precise and focused on time frames. For example, a long term secular trend in a given index can be upward while a primary trend can be downward or sideways (retracing / consolidating within the secular uptrend) while an intermediate trend can be upward (retracing or consolidating the primary downtrend)—and intraday traders levered up on calls and riding the short-term rip may be so hyperfocused on a rip in the short term that they dismiss a long-term analyst’s accurate characterization of corrective rally within a primary downtrend. This is just a hypothetical example of how vagueness around terminology and time frames doesn’t can obfuscate the proper technical approach to a given security.
As discussed, TSLA’s trend right now is upward on the intermediate trend and minor (short-term) trends. But the primary trend is still arguably sideways when considered from 2-3 years ago. And the secular trend since 2010 arguably still remains upward.
But may a trend trader peek outside the trend? That is a complicated question without a definite answer. For those wanting to explore whether it’s prudent to look at non-technical evidence outside the scope of the trend (e.g., considering the fundamentals and the broader macro), the following post offers some cost-benefit analysis and suggestions:
For those who wish to avoid being influenced by fundamental information, please skip this paragraph and read on to the next one. Andrew Dickson, the founder of Albert Bridge Capital and CIO of Alpha Europe Funds recently noted the following incongruities (downtrends) in EPS-estimate trends vs. price trends:
1. In late 2022, TSLA’s sell-side analysts expected $6.34 EPS in 2023 (about 9 months ago estimates).
2. After TSLA reported delivery numbers in early July, Dickson noted that “despite today's apparent 4% rev beat (implied from delivery-numbers) for Q2, 2023 EPS expectations have plummeted to $3.50. So earnings expectations for TSLA are now down -55% in 9 months and yet the stock is up +15%.”
3. He concluded that "the 2023 P/E multiple has expanded from 38x to 79x, or by 107%."
Dickson’s comments show that price is often not driven by fundamentals. Exactly what was priced in when the stock plummeted to $100 in January? And what is different now has nearly doubled off the lows? Or maybe the question is whether the data that gets priced in has different (and ever changing) weightings depending on the type of data. For example, maybe the data that affects price is most heavily weighted toward liquidity, capital flows, sentiment, seasonality, rather than fundamentals. But David Lundgren, a combined technical and fundamental analyst for whom SquishTrade has utmost respect, highly regards technical analysis, and especially favors technicals in the short / intermediate term, but says that fundamentals always matter in the long run. Here is a quotation from Lundgren from notes I've taken on his commentary in interviews and articles: "In the long-term, actual fundamentals will simply overwhelm any short-term technicals, emotions, sentiments driving a security or market price action."
Concluding Comments
Traders think in terms of probabilities, not certainties. Further, traders' time frames, risk management, and position sizes vary dramatically, which is why it seems imprudent to blindly follow another person’s signal service (whether paid or free). One very knowledgeable TV follower of mine has shorted TSLA with a position size that gives him a sizable margin of error. In other words, he can wait and allow significant fluctuations in price before getting shaken out of the position. My inference from our conversations is that his short thesis is based on deeply and persistently inverted yield curves, volatility being at major lows, deteriorating fundamentals at TSLA and other broader macro problems.
But macro and fundamentals can take a great deal of time to unfold, i.e., they do not play out immediately, and if they did, the big short should have been weeks or months ago. This year everyone thought a recession would be here by now, including experts with long-term experience managing or advising multi-billion dollar funds. This does not mean my fellow trader must be wrong. His thesis might yet succeed with time and patience, or it may yet experience more pressure or even be stopped out. This is why position size, risk management, and time frames matter. Before entering a trade or investment, one must consider time frame, position size, risk tolerance, risk management, technical or fundamental evidence, and an invalidation or stop level (which defines risk and relates integrally to position size). Shorter-term traders with leveraged, derivative, or supersized short positions would have already gotten crushed trying to short TSLA or other mega cap leaders the last few weeks or months.

GBPJPYGBPJPY is trading in smooth bullish channel and perfectly following Dow Theory by printing consistent HH and HL.
We are waiting for the price to print fresh HL which will be nice bullish attempt.

CTRM High Tight Bull Flag in Consolidation LONGCT
CTRM jumped about 20% with earnings in my idea published as that was occurring.
It is now in consolidation for two days on the 30 minute chart in what appears to be
a high tight bull flag pattern. These patterns are typically predictive of a bullish continuation
with decent reliability. The continuation can can be as much as the height of the flag
pole which is about 0.13 and so a continuation could be in the neighvborhood of 13/57
or about another 22% higher.
My trading plan is I will buy when price breaks above the flag's parallel channel with a stop
los below the channel. If there is a breakdown I will consider going short with a stop loss above
the parallel channel. Longside my target will be 20%. If I go short, I will target a 50%
retracement and so about 10%. For the time being, CTRM is on my penny-stock watchlist
as a long trade.

S&P 500 W reversal after 100 handles retracementWe saw a massive rally over the last months, with retracements around 100 handles.
This week's price made a 108 handles retracement after 4 failed attempts to form a new high at 4600, then price fell back to the magical 4500 level in 3 days.
At 4500 we saw a volume spike at the closing hour. With a higher low. All together it looks like a W formation at the bottom for me. Keep in mind, that tomorrow is NFP day. I'm hoping for a reversal, to a bullish trend. I'm crossing my fingers for positive news outcome.
Looking for a 4560 touch and a retest at 4500 for an explosive move, back to the highs at 4600.
Also keep in mind that it's Friday. Fridays, and Thursdays are usually great opportunities for reversals.
I also provided a 40 sample statistics from past retracements from 2022 june up until today. It shows a spread around the 100 area with oscillating trends. Hope it helps to gain a bit of confidence, that a 100 pip retracement is completely fine in a strong uptrend like what we had in july so far. (Scroll left a little bit to see the graph)
Green days and happy trading!
Peter
